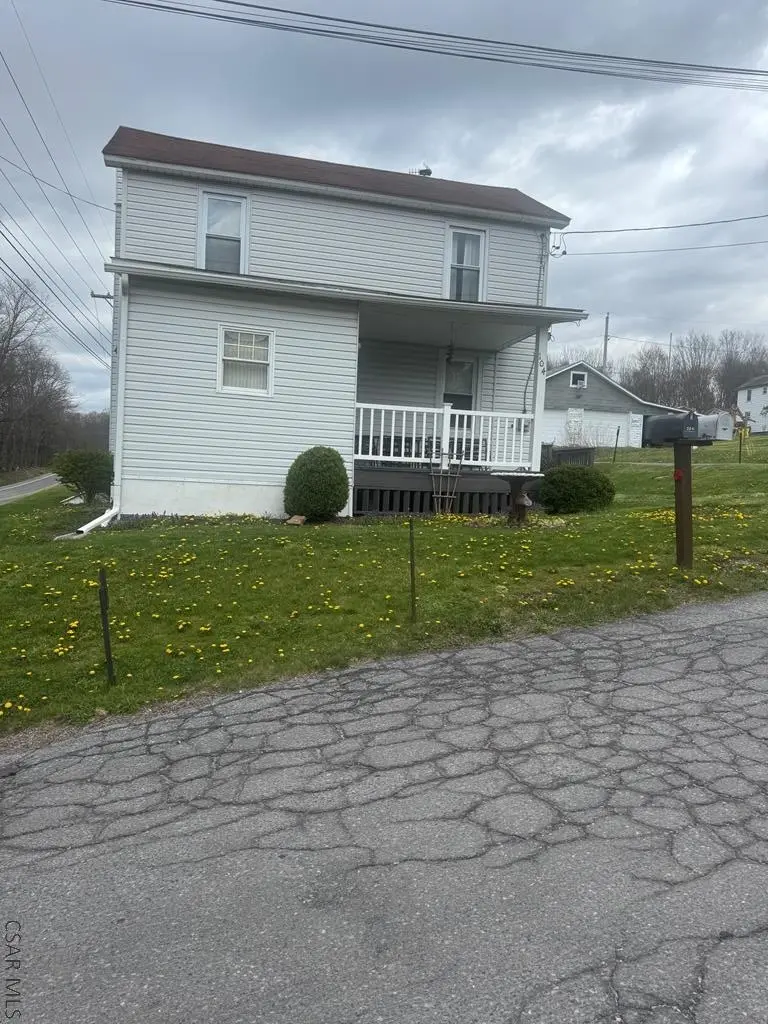
104 Robin St · Cairnbrook, PA
Flood risk 1/10 · Minimal
- FEMA flood zone
- X (unshaded)
- Chance of flooding over 30 yrs
- 0.0%
- Est. flood insurance / yr
- $473 – $860
Fire risk 2/10 · Minimal
- Est. fire insurance / yr
- $511 – $949
Heat risk 2/10 · Minimal
- Hot days now (above 89°F)
- 7 days/yr
- Hot days in 30 yrs
- 18 days/yr
Wind risk 2/10 · Minimal
- Chance of severe wind over 30 yrs
- —
Air-quality risk 1/10 · Minimal
- Unhealthy air days now
- 0 days/yr
- Unhealthy air days in 30 yrs
- 0 days/yr
Risk factors via First Street. Map © Google.
Why this score? — see what drove the B- grade
The composite is a weighted blend of 9 inputs, each scored 0–100. Each bar is that input's sub-score; the figure is the points it added to the 100-point composite (weight × sub-score).
- Cash flow +25.4/30.0
- Appreciation +9.1/10.0
- DSCR +8.4/10.0
- ARV discount +7.5/15.0
- 1% rule +6.2/10.0
- Schools +4.4/10.0
- Livability +3.2/5.0
- Rent growth +2.5/5.0
- Condition / age +2.5/5.0
$87,000
🖨 Deal sheet (PDF) 📄 Offer letter ✓ Due diligence
Listing remarks
Charming 3 bedroom home on a corner lot that is Move-In Ready! This well-maintained 3 bedroom, 1.5 bath home sits on a . 26-acre corner lot in a convenient location. Offering approximately 975 square feet of living space, the thoughtfully laid-out floor plan features a main floor bedroom and full bath— multigenerational living or easy one-level living. The two additional bedrooms are located upstairs. Outside, you'll enjoy a welcoming covered front porch and a side deck ideal for relaxing or entertaining. Additional highlights include a 2-car detached garage and a useful outbuilding for extra storage or workspace. Proudly cared for and nicely updated over the years, this home is read
Key facts
- Covered front porch
- Outbuilding
- Side deck
Tags
Property features AI
Exterior
- Parking: Detached garage with garage door opener; 2 garage spaces; Off-street parking; On-street parking
- Security: Smoke detectors
- Utilities: Public water; Public sewer; Sewer available
- Home design: Single family residence; One and one-half levels; Residential property
- Construction: Vinyl siding; Shingle roof
- Exterior features: Covered porch; Deck; Patio/porch
Interior
- Kitchen: Range; Oven; Refrigerator; Eat-in kitchen
- Bedrooms: Master bedroom on main level
- Bathrooms: 1 full bathroom; 1 half bathroom
- Heating & cooling: Forced air heating; Space heater; Coal heating; Oil heating; Propane heating; Wood heating
- Interior features: Eat-in kitchen; Master bedroom on main level; Full basement
- Laundry & utility: Washer; Dryer; Laundry in basement
Neighborhood map
What this means for you Summary
Snapshot
- This is a 3-bed/1.0-bath single-family listed at $87k.
Deal economics
- At list price, monthly cash flow is $199 ($2k/yr) — positive.
- The deal already cash-flows at list — no discount required.
- Meets the 1% rule at list price ($973 rent vs $87k).
- Recommended offer: $84k (3.0% below list) — sets the bar for market timing.
Location & tenants
- Location reads 64/100 on livability (#1,180 in PA) — a middle-class / working-renter tenant base. Strengths: cost of living A+, housing A+; Watch: employment C-, crime D+, amenities F.
- Shade-Central City SD (rural): math 45% / reading 55% proficiency, ranked #411 of 658 in PA (top 62%) — acceptable for families but not a draw, mixed tenant base, ~2y average lease.
- Zoned schools: Cairnbrook El Sch (math 32% / reading 47%, grade F, #947 of 1,518 statewide, top 65%, 166 students, 100% FRL); Shade Jshs (math 47% / reading 24%, grade F, #305 of 437 statewide, top 70%, 164 students, 60% FRL) — zoned schools average 80% FRL vs 42% district-wide (38 pts higher); higher-poverty schools than district average — tighter screening recommended.
- Zoned-school proficiency averages 38% at this address vs 50% district-wide (-12 pts) — the specific schools serving this property underperform the Shade-Central City SD average; the district grade overstates school quality for this exact location.
- Market conditions: 1 active listings in the ZIP; 78 units permitted in Somerset County in 2024 (0 in 5+ unit buildings).
Forward outlook
- In year one you build about $8k of equity ($601 loan paydown + $7k appreciation (8.2% local appreciation)).
- Somerset County population projected at -21% by 2050 — secular population decline; favor cash flow + early exit over multi-decade hold.
- At projected returns (8.2% appreciation + 3.0% rent growth), your $24k cash investment doubles in ~3 years — after that, you're playing with house money.
- By year 5, paydown + projected appreciation supports a ~$35k cash-out refi (75% LTV) — recoverable capital for the next deal without selling this one.
Negotiation context
- It's been on market 33 days — a 3% lower offer ($84k) is reasonable based on typical stale-listing flexibility.
Risks & watch-outs
- Watch-outs: built in 1916 — expect roof / HVAC / electrical / plumbing capex.
Questions for the listing agent
- It's been on market 33 days. Have you received any prior offers? Is the seller open to a 3% concession, seller financing, or rate buy-down credit?
- Built in 1916 — when were the roof, HVAC, electrical panel, plumbing, and water heater last replaced?
- Is there a deadline driving the sale (1031 exchange, divorce, estate, relocation)? That informs how much negotiation room exists.
- Crime grade is D in this area — have there been break-ins, vandalism, or insurance claims at this property in the last 3 years? What carrier currently insures it and at what premium?
- What's the average days-on-market for RENTAL listings here right now (not sales)? A rising rental-DOM trend means longer vacancies and softer asking-rent achievability than the comps imply.
- What's the recent tenant-quality profile in this submarket — average credit score on applications, eviction rate, late-payment / NSF rate, and stable-employment percentage? A property-management company in the area should have these aggregated.
- How much new for-sale + rental construction is in the pipeline within 1–3 miles? Heavy new supply typically softens prices + rents 12–24 months out; constrained supply supports both.
Investment metrics
- 1% rule
- 1.12% ✓
- Cap rate
- 9.04%
- Cash-on-cash
- 9.80%
- DSCR
- 1.44
- GRM
- 7.4
CMA / ARV
No comps found within radius.
Projected returns pro-forma
8.16% appreciation · 3.0% rent growth · sell at horizon
- IRR
- 27.9%
- Equity multiple
- 3.03×
- Total profit
- $49,375
- Equity at exit
- $67,015
- IRR
- 24.9%
- Equity multiple
- 6.50×
- Total profit
- $133,868
- Equity at exit
- $133,911
Cash invested: $24,360 (down + closing). Projections, not guarantees.
Landlord ↔ Tenant lean methodology
- Overall (STATE)
- 62 Landlord-Friendly
- State Pennsylvania
- 62 Landlord-Friendly · EVEN
- County
- — inherits STATE
- City
- — inherits STATE
ZIP-level market 15924
- Home prices YoY
- 5.5%
- Active inventory
- 1
- Price-to-rent
- 7.4×
Monthly cashflow live
- Estimated rent
- $973 medium interval (Pro) →
- Mortgage (P&I)
- −$456
- Tax from tax record
- −$77 /mo · $929/yr
- Insurance
- −$36
- HOA
- −$0
- Vacancy / Maint / Mgmt
- −$204
- Net cashflow
- $199
Break-even live
Sensitivity live
| Price | -10% $248 | -5% $224 | +0% $199 | +5% $174 | +10% $150 |
|---|---|---|---|---|---|
| Rent | -10% $122 | -5% $161 | +0% $199 | +5% $237 | +10% $276 |
| Rate | -1.0pp $243 | -0.5pp $221 | base $199 | +0.5pp $176 | +1.0pp $154 |
UW: 25.0% down · 7.5% · 30yr · 1.5% tax · 5.0% vac · 8.0% maint · 8.0% mgmt
Financing live
Cash to close
- Down payment
- $21,750
- Closing costs
- $2,610
- Reserves months
- —
- Total cash needed
- —
Loan-product check · same deal, 3 products live
Conventional
25% down · 7.5% · 30yr
- Down + closing
- —
- Monthly P&I
- —
- Monthly cashflow
- —
- DSCR
- —
- Eligible?
- —
Personal DTI + credit; lowest rate.
DSCR
20% down · 8.5% · 30yr
- Down + closing
- —
- Monthly P&I
- —
- Monthly cashflow
- —
- DSCR
- —
- Eligible?
- —
No personal income docs; deal must DSCR.
Hard money
10% down · 12.0% · 12mo
- Down + closing
- —
- Monthly P&I
- —
- Monthly cashflow
- —
- DSCR
- —
- Eligible?
- —
Short-term bridge; refi at stabilization.
Listing history 3 events
-
2026-05-18status Pending
-
2026-04-18historical Active Under Contract
-
2026-04-15$87,000 Active
ⓘ Source: listings_history table (triggers on properties + properties_extension) + one-shot
backfill from property_details.listing_events for pre-trigger history.
Tax reassessment forecast PA · Partial reset (capped growth)
- Current annual tax
- $929 · $77/mo
- Projected year-2 tax
- $1,152 · $96/mo
- Expected delta
- +$223/yr (+$19/mo · 23.9%)
ⓘ Screening estimate from a state-policy table — verify with the county assessor before closing.
Climate risk First Street
- Flood 1/10 Low FEMA zone X (unshaded) · 0% chance over 30 yrs
- Wildfire 2/10 Low
- Heat 2/10 Low 7 d/yr ≥89°F today · 18 d/yr by 30 yrs out
- Wind 2/10 Low
- Air quality 1/10 Low 0 unhealthy d/yr today · 0 by 30 yrs out
Nearby sold comps map
Loading sold comps map…
Walkable amenities ~0.75 mi
Loading nearby amenities…
Taxation est. · year 1
- Rental income
- $11,681
- − Mortgage interest
- −$4,873
- − Property taxes
- −$929
- − Insurance
- −$435
- − Repairs & maintenance
- −$934
- − Management
- −$934
- − Depreciation
- −$2,531
- Taxable income
- $1,043
- Est. tax owed @ 24.0%
- −$250
- After-tax cash flow
- $2,138/yr
For passive investors: Depreciation is non-cash, so a rental often shows a tax loss while cash-flowing — sheltering income. Rental losses are passive: they offset passive income freely, and up to $25,000/yr can offset ordinary (W-2) income if you actively participate and your MAGI is under $100k (phasing out to $0 by $150k); unused losses carry forward. On sale, claimed depreciation is recaptured at up to 25%, and gains may owe capital-gains tax (a 1031 exchange can defer both). Figures are a year-1 estimate at your 24.0% rate — not tax advice; consult a CPA.
Schools (NCES district)
- District
- Shade-Central City SD
- NCES district ID
- 4221180
- Math proficiency
- 45% ▲ 2.00%
- Reading proficiency
- 55% ▼ -2.00%
- Median HH income
- $39,850
- Composite
- 43.81/100
- National rank
- #6340
- State rank
- #411 of 658 in PA
Livability — Cairnbrook
- Score
- 64/100
- State rank
- #1180
- US rank
- #13792
Category grades
Schools grade is shown separately in the Schools card above.
Census & demographics
- Population (ZIP)
- 867
Population outlook (Somerset County) Hauer SSP2
- Today (2025)
- 71,318 people
- By 2030
- 68,555 · -3.9%
- By 2040
- 62,447 · -12.4%
- By 2050
- 56,437 · -20.9%
- By 2075
- 44,453 · -37.7%
- By 2100
- 32,408 · -54.6%
Race, ethnicity, and origin ACS 2023
- Neighborhood character
- Predominantly White (92%)
- Race & ethnicity
- White 92% Two or more races 8% Hispanic / Latino 2%
- Common ancestry
- Romanian 16% Slovene 2% Italian 1%
Political lean MEDSL · Somerset
- 2024 margin
- Solid R (+57.2) · D 21.0% · R 78.3%
- 2008→2024 swing
- -32.2pp toward R · 2008: -25.0pp · 2024: -57.2pp
- All cycles
- 2024: R+57.2 2020: R+56.3 2016: R+55.9 2012: R+42.9 2008: R+25.0
Not yet ingested
- Civics
- —
Market trends
- HPI YoY
- ▲ 8.16%
- Current HPI
- 156.7377
- Rent YoY
- —
- Metro
- —
- State GDP YoY
- ▲ 1.68%
- F500 in state
- 34
Industry mix (Fortune 500 HQ in PA)
| Industry | F500 HQs | Revenue |
|---|---|---|
| Healthcare | 2 | $309B |
|
||
| Insurance | 2 | $27B |
|
||
| Telecommunications / Media | 1 | $124B |
|
||
| Industrial Distribution | 1 | $22B |
|
||
| Financial Services | 1 | $20B |
|
||
| Chemicals / Materials | 1 | $18B |
|
||
Price history
3 events — show timeline
- 2026-05-18 Pending — CSMLS
- 2026-04-18 Contingent — CSMLS
- 2026-04-15 Listed $87,000 CSMLS
Property tax history
+2.2%/yrLatest (2026): $929 · +3.6% YoY. Source: county tax records.
Cash-flow waterfall
monthlySold comps — $/sqft
last 12 mo · ≤1 miLoading sold comps…