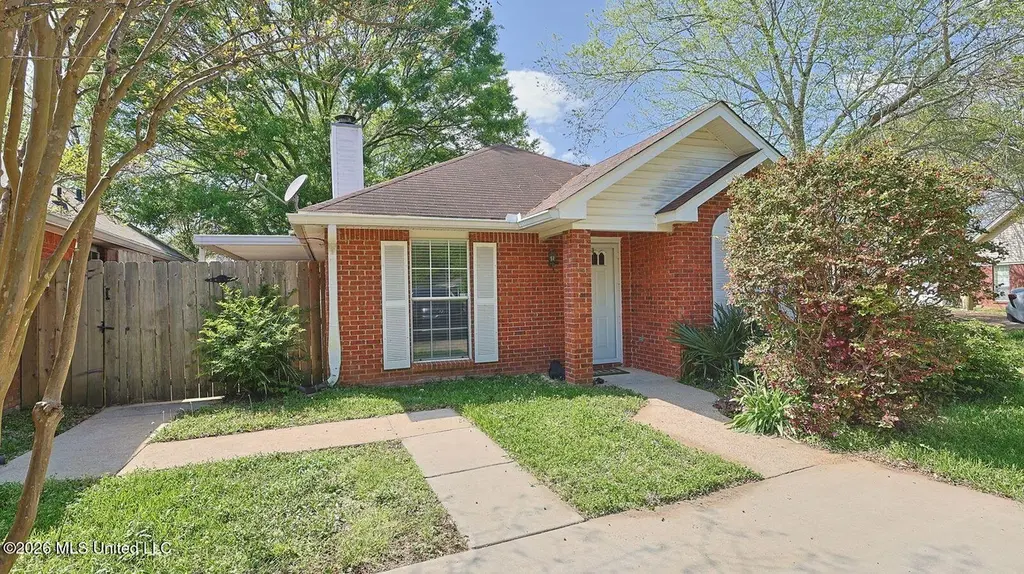
3007 Willow Dr · Brandon, MS
Flood risk 6/10 · Moderate
- FEMA flood zone
- A
- Chance of flooding over 30 yrs
- 0.71%
- Est. flood insurance / yr
- $1,009 – $1,996
Fire risk 3/10 · Minor
- Est. fire insurance / yr
- $1,241 – $2,305
Heat risk 7/10 · Major
- Hot days now (above 108°F)
- 7 days/yr
- Hot days in 30 yrs
- 20 days/yr
Wind risk 8/10 · Major
- Chance of severe wind over 30 yrs
- 80.0%
Air-quality risk 2/10 · Minimal
- Unhealthy air days now
- 1 days/yr
- Unhealthy air days in 30 yrs
- 1 days/yr
Risk factors via First Street. Map © Google.
Why this score? — see what drove the C- grade
The composite is a weighted blend of 9 inputs, each scored 0–100. Each bar is that input's sub-score; the figure is the points it added to the 100-point composite (weight × sub-score).
- Cash flow +19.2/30.0
- ARV discount +8.2/15.0
- DSCR +6.1/10.0
- Schools +4.6/10.0
- 1% rule +4.5/10.0
- Rent growth +4.3/5.0
- Livability +4.0/5.0
- Condition / age +2.5/5.0
- Appreciation +0.0/10.0
$205,000
🖨 Deal sheet 📄 Offer letter ✓ Due diligence
Listing remarks MLS
Cash Flow from Day One in Brandon's Strongest Rental Zip. This professionally managed 3 bedroom, 2 bathroom single family home at 3007 Willow Dr is a turnkey investment opportunity in Brandon, MS. Currently tenant-occupied under a lease running through March 2027, the property generates $1,575 per month in gross rental income, equating to $18,900 annually. The home received a comprehensive renovation prior to the current tenancy, including new carpet throughout, licensed electrical grounding upgrades with a passed City of Brandon inspection, HVAC repairs and servicing, updated appliances, and multiple systems updates. The property has been professionally managed with full work order history, tenant payment records, and repair documentation available to serious buyers upon request. No stabilization period. No vacancy risk. Just verified, documented income from day one. Do not disturb tenant. All showings by appointment only and must be coordinated through the listing agent.
Key facts
- Updated appliances
- 4,791 sq ft lot
- 2 parking spots
Tags
Neighborhood map
What this means for you Summary
Snapshot
- This is a 3-bed/1.0-bath single-family listed at $205k.
Deal economics
- At list price, monthly cash flow is $96 ($1k/yr) — positive.
- The deal already cash-flows at list — no discount required.
- To meet the 1% rule (rent ≥ 1% of price), the offer needs to be $195k (4.7% below list).
- Recommended offer: $195k (4.7% below list) — sets the bar for 1% rule.
- Cap rate 7.6% vs local median 4.2% in Brandon — top-decile yield for the area; either an underpriced asset or a hidden risk that comps aren't pricing in. Stress-test before assuming the spread holds.
Location & tenants
- Location reads 81/100 on livability (#3 in MS, #1,514 nationally) — a professional / high-income tenant draw. Strengths: crime A+, employment A+, cost of living A+; Watch: amenities F, commute F.
- Rankin County School District (rural): math 56% / reading 48% proficiency, ranked #6 of 130 in MS (top 5%) — acceptable for families but not a draw, mixed tenant base, ~2y average lease.
- Market conditions: Rents rising fast (+7.1%/yr); 302 active listings in the ZIP; 4 comparable units currently listed for rent nearby; rentals at typical pace (median 23d on market — plan ~3-4 weeks tenant-placement turnaround); solid renter incomes; 343 units permitted in Rankin County in 2024 (0 in 5+ unit buildings).
Forward outlook
- Local home prices are declining (-3.0%/yr); year-one equity from $1k of loan paydown is wiped out by about $6k of value loss. Plan a longer hold.
- Rankin County population projected at +17% by 2050 — long-run rental-demand tailwind backs the buy-and-hold thesis.
Negotiation context
- It's been on market 24 days — a 2% lower offer ($202k) is reasonable based on typical stale-listing flexibility.
- 8 sale attempts since 5y ago with the ask held roughly flat each time — persistent listings suggest the price (not the market) is what's stuck; bring a comps-based counter.
Risks & watch-outs
- Watch-outs: flood insurance adds $125/mo.
- Climate carrying-cost: in FEMA flood zone A (mandatory federal flood insurance); severe wind risk, 80% chance of damaging wind over 30y; extreme-heat days projected 7→20/yr by 2055 (HVAC capex compounding) — expect insurance premiums to compound above CPI over the hold.
Questions for the listing agent
- What's the actual annual flood-insurance premium (NFIP or private), and is the property in a SFHA with mandatory coverage?
- Is there a deadline driving the sale (1031 exchange, divorce, estate, relocation)? That informs how much negotiation room exists.
- Schools are A-rated — typically a magnet for longer-tenancy family renters. What's the average tenant stay here, and is there a school-zone premium baked into asking?
- What's the average days-on-market for RENTAL listings here right now (not sales)? A rising rental-DOM trend means longer vacancies and softer asking-rent achievability than the comps imply.
- What's the recent tenant-quality profile in this submarket — average credit score on applications, eviction rate, late-payment / NSF rate, and stable-employment percentage? A property-management company in the area should have these aggregated.
- How much new for-sale + rental construction is in the pipeline within 1–3 miles? Heavy new supply typically softens prices + rents 12–24 months out; constrained supply supports both.
Investment metrics
- 1% rule
- 0.95% ✗
- Cap rate
- 7.59%
- Cash-on-cash
- 4.63%
- DSCR
- 1.21
- GRM
- 8.7
CMA / ARV
- ARV (median comp)
- $208,146
- List price
- $205,000
- Delta
- -1.51%
- Verdict
- FAIR
- Comps
- 20 within 1.0 mi
Show comp detail 12 sales within ~0.75 mi
| Address | Dist | Beds/Ba | Sqft | Sold | Price | $/sf | Match |
|---|---|---|---|---|---|---|---|
| 3007 Willow Dr | 0.00mi | 3/2.0 | 1,390 (0%) | 0mo | $205,000 | $147 | 96 |
| 205 Edge Water Branch Dr | 0.16mi | 3/2.0 | 1,394 (+0%) | 2mo | $225,000 | $161 | 87 |
| 116 Windchase Dr | 0.03mi | 3/2.0 | 1,429 (+3%) | 6mo | $230,000 | $161 | 85 |
| 401 Windchase Dr | 0.20mi | 3/2.0 | 1,411 (+2%) | 5mo | $230,000 | $163 | 80 |
| 2030 Red Oak Dr | 0.07mi | 3/2.0 | 1,478 (+6%) | 9mo | $185,000 | $125 | 75 |
| 579 Lincolns Dr | 0.16mi | 3/2.0 | 1,458 (+5%) | 8mo | $235,000 | $161 | 74 |
| 3019 Willow Dr | 0.02mi | 3/2.0 | 1,547 (+11%) | 4mo | $219,000 | $142 | 73 |
| 569 Lincolns Dr | 0.21mi | 3/2.0 | 1,436 (+3%) | 10mo | $222,580 | $155 | 73 |
| 3072 Willow Dr | 0.09mi | 3/2.0 | 1,217 (-12%) | 1mo | $199,900 | $164 | 70 |
| 368 Highway 468 | 0.18mi | 3/2.0 | 1,251 (-10%) | 8mo | $205,000 | $164 | 65 |
| 404 Briars Bnd | 0.34mi | 3/2.0 | 1,552 (+12%) | 6mo | $239,500 | $154 | 55 |
| 106 Ole Duke Dr | 0.70mi | 3/2.0 | 1,533 (+10%) | 7mo | $250,000 | $163 | 40 |
Match score weights: distance 35% · size 25% · config 20% · recency 20%. Top-matched comps best support the ARV.
Projected returns pro-forma
-3.0% appreciation · 7.13% rent growth · sell at horizon
- IRR
- -8.5%
- Equity multiple
- 0.68×
- Total profit
- $-18,602
- Equity at exit
- $30,566
- IRR
- 5.8%
- Equity multiple
- 1.52×
- Total profit
- $29,641
- Equity at exit
- $17,725
Cash invested: $57,400 (down + closing). Projections, not guarantees.
Landlord ↔ Tenant lean methodology
- Overall (STATE)
- 90 Strongly Landlord-Friendly
- State Mississippi
- 90 Strongly Landlord-Friendly · R+11
- County
- — inherits STATE
- City
- — inherits STATE
ZIP-level market 39042
- Home prices YoY
- -34.3%
- Rents YoY
- 7.1%
- Active inventory
- 302
- Price-to-rent
- 8.7×
Monthly cashflow live
- Estimated rent
- $1,953 medium interval (Pro) →
- Mortgage (P&I)
- −$1,075
- Tax from tax record
- −$161 /mo · $1,931/yr
- Insurance
- −$85
- Flood insurance flood zone
- −$125 /mo · $1,502/yr
- HOA
- −$0
- Vacancy / Maint / Mgmt
- −$410
- Net cashflow
- $96
Break-even live
UW: 25.0% down · 7.5% · 30yr · 1.5% tax · 5.0% vac · 8.0% maint · 8.0% mgmt
Financing live
Cash to close
- Down payment
- $51,250
- Closing costs
- $6,150
- Reserves months
- —
- Total cash needed
- —
Loan-product check · same deal, 3 products live
Conventional
25% down · 7.5% · 30yr
- Down + closing
- —
- Monthly P&I
- —
- Monthly cashflow
- —
- DSCR
- —
- Eligible?
- —
Personal DTI + credit; lowest rate.
DSCR
20% down · 8.5% · 30yr
- Down + closing
- —
- Monthly P&I
- —
- Monthly cashflow
- —
- DSCR
- —
- Eligible?
- —
No personal income docs; deal must DSCR.
Hard money
10% down · 12.0% · 12mo
- Down + closing
- —
- Monthly P&I
- —
- Monthly cashflow
- —
- DSCR
- —
- Eligible?
- —
Short-term bridge; refi at stabilization.
Rent comps 4 comps
| Address | Beds | Baths | Sqft | Rent | $/sqft | DOM | Units | Dist |
|---|---|---|---|---|---|---|---|---|
| 114 Fox Meadow Dr Brandon, MS | 3.0 | 2.0 | 1500 | $2,250 | $1.50 | 13d | 1 | 0.66mi |
| 1500 Chapelridge Way Brandon, MS | 3.0 | 2.0 | 1081 | $1,609 | $1.49 | 23d | 1 | 0.93mi |
| 1500 Chapelridge Way Brandon, MS | 2.0 | 2.0 | 921 | $1,399 | $1.52 | 21d | 1 | 0.93mi |
| 202 Overby St Brandon, MS | 3.0 | 2.0 | 1394 | $1,786 | $1.28 | 43d | 1 | 1.19mi |
Listing history 25 events
-
2026-05-03status Pending 990-char remark
Show marketing remark (990 chars)
Cash Flow from Day One in Brandon's Strongest Rental Zip. This professionally managed 3 bedroom, 2 bathroom single family home at 3007 Willow Dr is a turnkey investment opportunity in Brandon, MS. Currently tenant-occupied under a lease running through March 2027, the property generates $1,575 per month in gross rental income, equating to $18,900 annually. The home received a comprehensive renovation prior to the current tenancy, including new carpet throughout, licensed electrical grounding upgrades with a passed City of Brandon inspection, HVAC repairs and servicing, updated appliances, and multiple systems updates. The property has been professionally managed with full work order history, tenant payment records, and repair documentation available to serious buyers upon request. No stabilization period. No vacancy risk. Just verified, documented income from day one. Do not disturb tenant. All showings by appointment only and must be coordinated through the listing agent.
-
2026-04-27price $205,000 990-char remark
Show marketing remark (990 chars)
Cash Flow from Day One in Brandon's Strongest Rental Zip. This professionally managed 3 bedroom, 2 bathroom single family home at 3007 Willow Dr is a turnkey investment opportunity in Brandon, MS. Currently tenant-occupied under a lease running through March 2027, the property generates $1,575 per month in gross rental income, equating to $18,900 annually. The home received a comprehensive renovation prior to the current tenancy, including new carpet throughout, licensed electrical grounding upgrades with a passed City of Brandon inspection, HVAC repairs and servicing, updated appliances, and multiple systems updates. The property has been professionally managed with full work order history, tenant payment records, and repair documentation available to serious buyers upon request. No stabilization period. No vacancy risk. Just verified, documented income from day one. Do not disturb tenant. All showings by appointment only and must be coordinated through the listing agent.
-
2026-04-09$215,000 Active 990-char remark
Show marketing remark (990 chars)
Cash Flow from Day One in Brandon's Strongest Rental Zip. This professionally managed 3 bedroom, 2 bathroom single family home at 3007 Willow Dr is a turnkey investment opportunity in Brandon, MS. Currently tenant-occupied under a lease running through March 2027, the property generates $1,575 per month in gross rental income, equating to $18,900 annually. The home received a comprehensive renovation prior to the current tenancy, including new carpet throughout, licensed electrical grounding upgrades with a passed City of Brandon inspection, HVAC repairs and servicing, updated appliances, and multiple systems updates. The property has been professionally managed with full work order history, tenant payment records, and repair documentation available to serious buyers upon request. No stabilization period. No vacancy risk. Just verified, documented income from day one. Do not disturb tenant. All showings by appointment only and must be coordinated through the listing agent.
-
2026-02-27historical $1,703
-
2026-02-13$1,703
-
2026-01-22historical $1,703
-
2026-01-13price $1,703
-
2025-12-02$1,575
-
2025-12-02historical $1,575
-
2025-11-28price $1,575
-
2025-11-21$1,645
-
2025-11-21historical $1,645
-
2025-11-19$1,645
-
2025-10-30historical $1,645
-
2025-10-24price $1,645
-
2025-09-28price $1,695
-
2025-09-24price $1,725
-
2025-09-18price $1,745
-
2025-09-17$1,795
-
2025-09-15historical
-
2025-08-31$215,000 Active
-
2023-03-02soldstatus
-
2021-04-27soldstatus
-
2021-04-27soldstatus
-
2021-03-23$165,000
ⓘ Source: listings_history table (triggers on properties + properties_extension) + one-shot
backfill from property_details.listing_events for pre-trigger history.
Tax reassessment forecast MS · Resets to sale price
- Current annual tax
- $1,931 · $161/mo
- Projected year-2 tax
- $1,931 · $161/mo
- Expected delta
- $0/yr ($0/mo · 0.0%)
ⓘ Screening estimate from a state-policy table — verify with the county assessor before closing.
Climate risk First Street
- Flood 6/10 Major FEMA zone A · 71% chance over 30 yrs
- Wildfire 3/10 Moderate
- Heat 7/10 Severe 7 d/yr ≥108°F today · 20 d/yr by 30 yrs out
- Wind 8/10 Severe 80% chance of damaging wind over 30 yrs
- Air quality 2/10 Low 1 unhealthy d/yr today · 1 by 30 yrs out
Nearby sold comps map
Loading sold comps map…
Walkable amenities ~0.75 mi
Loading nearby amenities…
Taxation est. · year 1
- Rental income
- $23,432
- − Mortgage interest
- −$11,483
- − Property taxes
- −$1,931
- − Insurance
- −$2,528
- − Repairs & maintenance
- −$1,875
- − Management
- −$1,875
- − Depreciation
- −$5,964
- Taxable loss
- −$2,222
- Est. tax savings @ 24.0%
- +$533
- After-tax cash flow
- $1,686/yr
For passive investors: Depreciation is non-cash, so a rental often shows a tax loss while cash-flowing — sheltering income. Rental losses are passive: they offset passive income freely, and up to $25,000/yr can offset ordinary (W-2) income if you actively participate and your MAGI is under $100k (phasing out to $0 by $150k); unused losses carry forward. On sale, claimed depreciation is recaptured at up to 25%, and gains may owe capital-gains tax (a 1031 exchange can defer both). Figures are a year-1 estimate at your 24.0% rate — not tax advice; consult a CPA.
Schools (NCES district)
- District
- Rankin County School District
- NCES district ID
- 2803830
- Math proficiency
- 56% ▼ -4.00%
- Reading proficiency
- 48% ▼ -6.00%
- Median HH income
- $61,867
- Composite
- 45.62/100
- National rank
- #2587
- State rank
- #6 of 130 in MS
Livability — Brandon
- Score
- 81/100
- State rank
- #3
- US rank
- #1514
Category grades
Schools grade is shown separately in the Schools card above.
Census & demographics
- Census place
- Brandon, MS
- County
- Rankin County · 123,614 people
- City population
- 79,950
- Metro
- Jackson, MS
- Population (ZIP)
- 39,142
- Household income
- $88,597
- Rent vs Own
- Severe rent burden
- 474.0
Population outlook (Rankin County) Hauer SSP2
- Today (2025)
- 164,317 people
- By 2030
- 171,013 · +4.1%
- By 2040
- 182,723 · +11.2%
- By 2050
- 192,376 · +17.1%
- By 2075
- 209,535 · +27.5%
- By 2100
- 209,534 · +27.5%
Race, ethnicity, and origin ACS 2023
- Neighborhood character
- Predominantly White (75%)
- Race & ethnicity
- White 75% Black 21% Hispanic / Latino 2% Two or more races 2%
- Common ancestry
- Italian 5% Slovak 2% Iranian 2%
- Foreign-born
- 2% · Canada
- Languages at home
- 97% English-only · Spanish 2%
Political lean MEDSL · Rankin
- 2024 margin
- Solid R (+47.1) · D 25.9% · R 73.0% · Other 1.0%
- 2008→2024 swing
- +6.4pp toward D · 2008: -53.5pp · 2024: -47.1pp
- All cycles
- 2024: R+47.1 2020: R+45.4 2016: R+52.9 2012: R+51.9 2008: R+53.5
Not yet ingested
- Civics
- —
Market trends
- HPI YoY
- ▼ -90.04%
- Current HPI
- 172.5248
- Rent YoY
- ▲ 7.13%
- Metro
- Jackson, MS
- State GDP YoY
- —
- F500 in state
- 0
Price history
+24.2% since first listed25 events — show timeline
- 2026-05-03 Pending — MLSU
- 2026-04-27 Price Changed $205,000 MLSU
- 2026-04-09 Listed $215,000 MLSU
- 2026-02-27 Rental Removed $1,703 RENTLY
- 2026-02-13 Listed for Rent $1,703 RENTLY
- 2026-01-22 Rental Removed $1,703 RENTLY
- 2026-01-13 Price Changed $1,703 RENTLY
- 2025-12-02 Listed for Rent $1,575 RENTLY
- 2025-12-02 Rental Removed $1,575 ZUMPER1
- 2025-11-28 Price Changed $1,575 ZUMPER1
- 2025-11-21 Listed for Rent $1,645 ZUMPER1
- 2025-11-21 Rental Removed $1,645 RENTLY
- 2025-11-19 Listed for Rent $1,645 RENTLY
- 2025-10-30 Rental Removed $1,645 RENTLY
- 2025-10-24 Price Changed $1,645 RENTLY
- 2025-09-28 Price Changed $1,695 RENTLY
- 2025-09-24 Price Changed $1,725 RENTLY
- 2025-09-18 Price Changed $1,745 RENTLY
- 2025-09-17 Listed for Rent $1,795 RENTLY
- 2025-09-15 Listing Removed — MLSU
- 2025-08-31 Listed $215,000 MLSU
- 2023-03-02 Sold (Public Records) — Public Records
- 2021-04-27 Sold (Public Records) — Public Records
- 2021-04-27 Sold (MLS) — MLSU
- 2021-03-23 Listed $165,000 MLSU
Property tax history
+9.8%/yrLatest (2025): $1,931 · +1.4% YoY. Source: county tax records.
Cash-flow waterfall
monthlySold comps — $/sqft
last 12 mo · ≤1 miLoading sold comps…