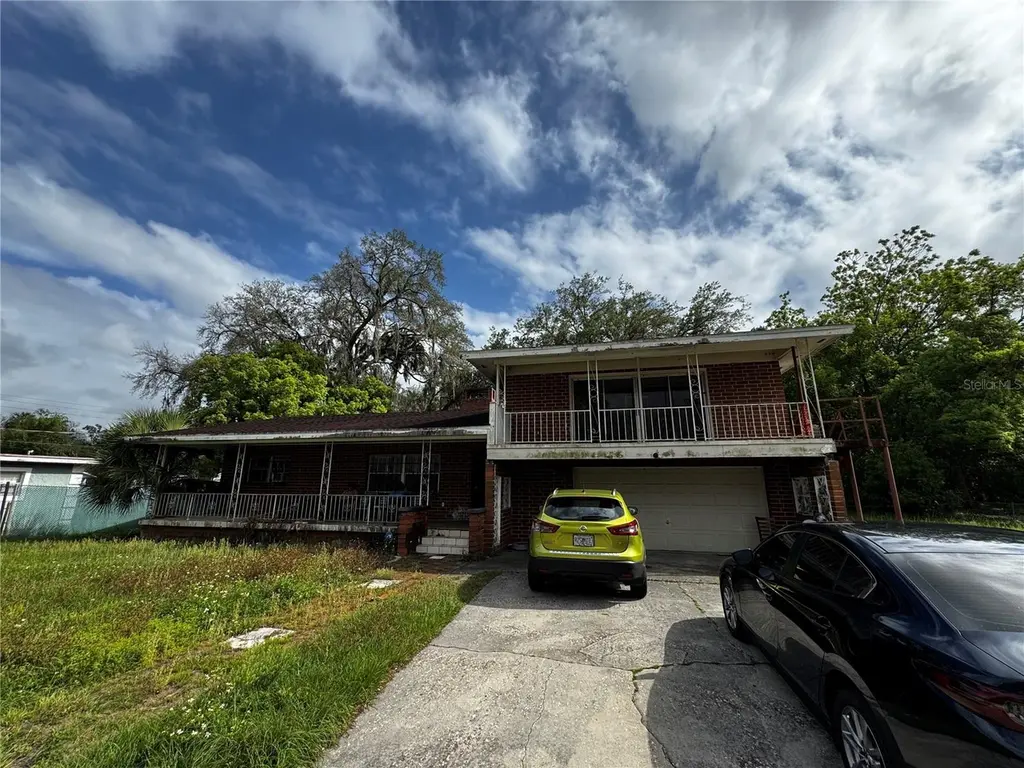
1307 Historic Goldsboro Blvd · Sanford, FL
Flood risk 1/10 · Minimal
- FEMA flood zone
- X (unshaded)
- Chance of flooding over 30 yrs
- 0.0%
- Est. flood insurance / yr
- $507 – $1,088
Fire risk 1/10 · Minimal
- Est. fire insurance / yr
- $947 – $1,759
Heat risk 8/10 · Major
- Hot days now (above 107°F)
- 7 days/yr
- Hot days in 30 yrs
- 21 days/yr
Wind risk 9/10 · Severe
- Chance of severe wind over 30 yrs
- 99.0%
Air-quality risk 2/10 · Minimal
- Unhealthy air days now
- 1 days/yr
- Unhealthy air days in 30 yrs
- 1 days/yr
Risk factors via First Street. Map © Google.
Why this score? — see what drove the C grade
The composite is a weighted blend of 9 inputs, each scored 0–100. Each bar is that input's sub-score; the figure is the points it added to the 100-point composite (weight × sub-score).
- Cash flow +17.1/30.0
- ARV discount +15.0/15.0
- DSCR +5.3/10.0
- Schools +5.1/10.0
- 1% rule +4.9/10.0
- Livability +3.7/5.0
- Rent growth +2.6/5.0
- Condition / age +2.5/5.0
- Appreciation +0.0/10.0
$224,999
🖨 Deal sheet 📄 Offer letter ✓ Due diligence
Listing remarks
Unlock the potential of this unique 4-bedroom home just minutes from the charm and energy of Downtown Sanford. Tucked behind a gated entry, this property offers privacy, space, and a rare opportunity to create something truly special. Inside, you’ll find a spacious layout ready for your vision—ideal for investors, renovators, or buyers looking to customize their dream home from the ground up. With four full bedrooms, there’s plenty of flexibility for families, rental income potential, or creative redesign. The property itself offers ample room to expand, enhance, or reimagine, making it a standout opportunity in a growing area. Located near local dining, shopping, and ente
Key facts
- Convenient access
- Ample room to expand
- Gated entry
Tags
Property features AI
Finance
- Other: Lot size about 0.39 acres (approx. 1/4 to less than 1/2 acre); Living area approximately 1,984 square feet
- HOA & community: No HOA association indicated
Exterior
- Parking: Attached 2-car garage
- Utilities: Public water; Public sewer; Electricity connected; Water connected
- Home design: Single family residence; Residential property; North-facing; Two stories; Entry level: Two-level home
- Construction: Block and brick construction; Shingle roof; Crawlspace foundation; Built on two levels
- Exterior features: Balcony; Exterior lighting; Paved road access; Lot dimensions approximately 120 x 140
Interior
- Kitchen: No appliances included
- Bedrooms: 4 bedrooms
- Flooring: Wood flooring
- Bathrooms: 2 full bathrooms
- Heating & cooling: Central heating; Ductless heating; Central air conditioning; Wall/window air conditioning units
- Interior features: Ceiling fans; Fireplace in family room
- Laundry & utility: Laundry located in garage
Neighborhood map
What this means for you Summary
Snapshot
- This is a 3-bed/2.0-bath single-family listed at $225k.
Deal economics
- At list price, monthly cash flow is $155 ($2k/yr) — positive.
- The deal already cash-flows at list — no discount required.
- To meet the 1% rule (rent ≥ 1% of price), the offer needs to be $222k (1.4% below list).
- Recommended offer: $218k (3.0% below list) — sets the bar for market timing.
- Cap rate 7.1% vs local median 3.6% in Sanford — top-decile yield for the area; either an underpriced asset or a hidden risk that comps aren't pricing in. Stress-test before assuming the spread holds.
Location & tenants
- Location reads 73/100 on livability (#316 in FL) — a middle-class / working-renter tenant base. Strengths: cost of living A+, housing A+, health & safety A+; Watch: employment C-, crime F, amenities F.
- Seminole (suburban): math 57% / reading 61% proficiency, ranked #13 of 73 in FL (top 18%) — acceptable for families but not a draw, mixed tenant base, ~2y average lease.
- Market conditions: Rents flat; 561 active listings in the ZIP; 14 comparable units currently listed for rent nearby; rentals at typical pace (median 18d on market — plan ~3-4 weeks tenant-placement turnaround); solid renter incomes; 1,979 units permitted in Seminole County in 2024 (1,191 in 5+ unit buildings).
- This rent runs 34% of the median local income ($78k/yr) — at the standard rent-burdened threshold; future hikes will face affordability resistance.
Forward outlook
- Local home prices are declining (-3.0%/yr); year-one equity from $2k of loan paydown is wiped out by about $7k of value loss. Plan a longer hold.
- Seminole County population projected at +24% by 2050 — long-run rental-demand tailwind backs the buy-and-hold thesis.
Negotiation context
- It's been on market 54 days — a 3% lower offer ($218k) is reasonable based on typical stale-listing flexibility.
Risks & watch-outs
- Climate carrying-cost: severe wind risk, 99% chance of damaging wind over 30y; extreme-heat days projected 7→21/yr by 2055 (HVAC capex compounding) — expect insurance premiums to compound above CPI over the hold.
Questions for the listing agent
- It's been on market 54 days. Have you received any prior offers? Is the seller open to a 3% concession, seller financing, or rate buy-down credit?
- Built in 1972 — when were the roof, HVAC, electrical panel, plumbing, and water heater last replaced?
- Is there a deadline driving the sale (1031 exchange, divorce, estate, relocation)? That informs how much negotiation room exists.
- Schools are B-rated — typically a magnet for longer-tenancy family renters. What's the average tenant stay here, and is there a school-zone premium baked into asking?
- Crime grade is F in this area — have there been break-ins, vandalism, or insurance claims at this property in the last 3 years? What carrier currently insures it and at what premium?
- What's the average days-on-market for RENTAL listings here right now (not sales)? A rising rental-DOM trend means longer vacancies and softer asking-rent achievability than the comps imply.
- What's the recent tenant-quality profile in this submarket — average credit score on applications, eviction rate, late-payment / NSF rate, and stable-employment percentage? A property-management company in the area should have these aggregated.
- How much new for-sale + rental construction is in the pipeline within 1–3 miles? Heavy new supply typically softens prices + rents 12–24 months out; constrained supply supports both.
Investment metrics
- 1% rule
- 0.99% ✗
- Cap rate
- 7.12%
- Cash-on-cash
- 2.96%
- DSCR
- 1.13
- GRM
- 8.5
CMA / ARV
- ARV (on-the-fly)
- $372,992
- Comps found
- 12
Show comp detail 12 sales within ~0.75 mi
| Address | Dist | Beds/Ba | Sqft | Sold | Price | $/sf | Match |
|---|---|---|---|---|---|---|---|
| 1203 W 9th St | 0.27mi | 4/2.0 (+1) | 1,800 (-9%) | 0mo | $378,000 | $210 | 67 |
| 1320 S Oleander Ave | 0.14mi | 4/3.5 (+1) | 1,905 (-4%) | 11mo | $186,000 | $98 | 66 |
| 1211 W 15th St | 0.16mi | 3/2.0 | 1,708 (-14%) | 5mo | $353,000 | $207 | 65 |
| 1013 W 11th St | 0.24mi | 3/3.0 | 1,705 (-14%) | 0mo | $326,800 | $192 | 61 |
| 1707 Merthie Dr | 0.50mi | 4/3.0 (+1) | 2,066 (+4%) | 5mo | $382,500 | $185 | 57 |
| 1012 S Holly Ave | 0.43mi | 4/3.0 (+1) | 2,150 (+8%) | 3mo | $405,000 | $188 | 55 |
| 1604 Peach Ave | 0.40mi | 4/3.0 (+1) | 1,879 (-5%) | 13mo | $270,000 | $144 | 53 |
| 801 Pecan Ave | 0.37mi | 4/3.0 (+1) | 2,142 (+8%) | 13mo | $403,000 | $188 | 50 |
| 300 W 12th St | 0.72mi | 4/3.0 (+1) | 2,038 (+3%) | 5mo | $355,000 | $174 | 49 |
| 1402 Persimmon Ave | 0.44mi | 4/3.0 (+1) | 2,211 (+11%) | 5mo | $405,000 | $183 | 47 |
| 2006 S Maple Ave | 0.68mi | 3/2.0 | 1,708 (-14%) | 2mo | $370,000 | $217 | 44 |
| 615 S Laurel Ave | 0.74mi | 4/3.0 (+1) | 1,802 (-9%) | 2mo | $354,000 | $196 | 39 |
Match score weights: distance 35% · size 25% · config 20% · recency 20%. Top-matched comps best support the ARV.
Projected returns pro-forma
-3.0% appreciation · 0.38% rent growth · sell at horizon
- IRR
- -14.7%
- Equity multiple
- 0.49×
- Total profit
- $-32,202
- Equity at exit
- $33,548
- IRR
- -11.2%
- Equity multiple
- 0.41×
- Total profit
- $-37,243
- Equity at exit
- $19,454
Cash invested: $63,000 (down + closing). Projections, not guarantees.
Landlord ↔ Tenant lean methodology
- Overall (STATE)
- 87 Strongly Landlord-Friendly
- State Florida
- 87 Strongly Landlord-Friendly · R+3
- County
- — inherits STATE
- City
- — inherits STATE
ZIP-level market 32771
- Rents YoY
- 0.4%
- Active inventory
- 561
- Price-to-rent
- 8.5×
Monthly cashflow live
- Estimated rent
- $2,218 high interval (Pro) →
- Mortgage (P&I)
- −$1,180
- Tax from tax record
- −$323 /mo · $3,879/yr
- Insurance
- −$94
- HOA
- −$0
- Vacancy / Maint / Mgmt
- −$466
- Net cashflow
- $155
Break-even live
UW: 25.0% down · 7.5% · 30yr · 1.5% tax · 5.0% vac · 8.0% maint · 8.0% mgmt
Financing live
Cash to close
- Down payment
- $56,250
- Closing costs
- $6,750
- Reserves months
- —
- Total cash needed
- —
Loan-product check · same deal, 3 products live
Conventional
25% down · 7.5% · 30yr
- Down + closing
- —
- Monthly P&I
- —
- Monthly cashflow
- —
- DSCR
- —
- Eligible?
- —
Personal DTI + credit; lowest rate.
DSCR
20% down · 8.5% · 30yr
- Down + closing
- —
- Monthly P&I
- —
- Monthly cashflow
- —
- DSCR
- —
- Eligible?
- —
No personal income docs; deal must DSCR.
Hard money
10% down · 12.0% · 12mo
- Down + closing
- —
- Monthly P&I
- —
- Monthly cashflow
- —
- DSCR
- —
- Eligible?
- —
Short-term bridge; refi at stabilization.
Rent comps 14 comps
| Address | Beds | Baths | Sqft | Rent | $/sqft | DOM | Units | Dist |
|---|---|---|---|---|---|---|---|---|
| 2008 William Clark Ave Sanford, FL | 3.0 | 2.0 | 1328 | $2,199 | $1.66 | 3d | 1 | 0.61mi |
| 107 Garrison Dr Sanford, FL | 3.0 | 2.0 | 1439 | $1,800 | $1.25 | 18d | 1 | 0.63mi |
| 153 Cape Honeysuckle Pl Sanford, FL | 3.0 | 2.5 | 1380 | $2,395 | $1.74 | 24d | 1 | 0.93mi |
| 164 Cape Honeysuckle Pl Sanford, FL | 3.0 | 2.5 | 1587 | $2,395 | $1.51 | 24d | 1 | 0.95mi |
| 2441 Marshall Ave Sanford, FL | 3.0 | 2.0 | 1462 | $2,235 | $1.53 | 5d | 1 | 0.96mi |
| 129 Oakman Way Unit 1 Sanford, FL | 3.0 | 3.0 | 1652 | $2,349 | $1.42 | 5d | 1 | 1.13mi |
| 2006 Williams Ave Sanford, FL | 3.0 | 2.0 | 1546 | $3,200 | $2.07 | 5d | 1 | 1.16mi |
| 2015 Jones Ave Sanford, FL | 3.0 | 1.5 | 1291 | $1,895 | $1.47 | 13d | 1 | 1.19mi |
| 2530 Georgia Ave Unit B Sanford, FL | 2.0 | 2.0 | 1400 | $1,650 | $1.18 | 24d | 1 | 1.28mi |
| 700 E 7th St Sanford, FL | 4.0 | 2.0 | 1440 | $2,200 | $1.53 | 24d | 1 | 1.30mi |
| 2995 Railside Loop Sanford, FL | 1.0–3.0 | 1.0–2.0 | 961 | $2,458 | $2.56 | 5d | 21 | 1.30mi |
| 2616 River Landing Dr Sanford, FL | 3.0 | 2.5 | 1642 | $2,190 | $1.33 | 24d | 1 | 1.35mi |
| 2752 River Landing Dr Sanford, FL | 2.0 | 2.5 | 1575 | $1,990 | $1.26 | 17d | 1 | 1.37mi |
| 331 Placid Lake Dr Sanford, FL | 3.0 | 2.0 | 1292 | $1,960 | $1.52 | 20d | 1 | 1.47mi |
Listing history 15 events
-
2026-06-18days on market $224,999 Active 54 DOM
-
2026-06-17days on market $224,999 Active 53 DOM
-
2026-06-16days on market $224,999 Active 52 DOM
-
2026-06-15days on market $224,999 Active 51 DOM
-
2026-06-13days on market $224,999 Active 49 DOM
-
2026-06-09days on market $224,999 Active 45 DOM
-
2026-06-08days on market $224,999 Active 44 DOM
-
2026-06-07days on market $224,999 Active 43 DOM
-
2026-06-04days on market $224,999 Active 40 DOM
-
2026-06-03days on market $224,999 Active 39 DOM
-
2026-06-02days on market $224,999 Active 38 DOM
-
2026-06-01days on market $224,999 Active 37 DOM
-
2026-05-31days on market $224,999 Active 36 DOM
-
2026-05-21price $224,999
-
2026-04-25$239,999 Active
ⓘ Source: listings_history table (triggers on properties + properties_extension) + one-shot
backfill from property_details.listing_events for pre-trigger history.
Tax reassessment forecast FL · Resets to sale price
- Current annual tax
- $3,879 · $323/mo
- Projected year-2 tax
- $3,879 · $323/mo
- Expected delta
- $0/yr ($0/mo · 0.0%)
ⓘ Screening estimate from a state-policy table — verify with the county assessor before closing.
Climate risk First Street
- Flood 1/10 Low FEMA zone X (unshaded) · 0% chance over 30 yrs
- Wildfire 1/10 Low
- Heat 8/10 Severe 7 d/yr ≥107°F today · 21 d/yr by 30 yrs out
- Wind 9/10 Extreme 99% chance of damaging wind over 30 yrs
- Air quality 2/10 Low 1 unhealthy d/yr today · 1 by 30 yrs out
Nearby sold comps map
Loading sold comps map…
Walkable amenities ~0.75 mi
Loading nearby amenities…
Taxation est. · year 1
- Rental income
- $26,617
- − Mortgage interest
- −$12,603
- − Property taxes
- −$3,879
- − Insurance
- −$1,125
- − Repairs & maintenance
- −$2,129
- − Management
- −$2,129
- − Depreciation
- −$6,545
- Taxable loss
- −$1,794
- Est. tax savings @ 24.0%
- +$431
- After-tax cash flow
- $2,295/yr
For passive investors: Depreciation is non-cash, so a rental often shows a tax loss while cash-flowing — sheltering income. Rental losses are passive: they offset passive income freely, and up to $25,000/yr can offset ordinary (W-2) income if you actively participate and your MAGI is under $100k (phasing out to $0 by $150k); unused losses carry forward. On sale, claimed depreciation is recaptured at up to 25%, and gains may owe capital-gains tax (a 1031 exchange can defer both). Figures are a year-1 estimate at your 24.0% rate — not tax advice; consult a CPA.
Schools (NCES district)
- District
- Seminole
- NCES district ID
- 1201710
- Math proficiency
- 57% ▼ -7.00%
- Reading proficiency
- 61% ▼ -1.00%
- Median HH income
- $58,478
- Composite
- 51.05/100
- National rank
- #1769
- State rank
- #13 of 73 in FL
Livability — Sanford
- Score
- 73/100
- State rank
- #316
- US rank
- #5359
Category grades
Schools grade is shown separately in the Schools card above.
Census & demographics
- Census place
- Sanford, FL
- County
- Seminole County · 436,154 people
- City population
- 96,638
- Metro
- Orlando-Kissimmee-Sanford, FL
- Population (ZIP)
- 62,606
- Household income
- $77,868
- Rent vs Own
- Severe rent burden
- 2645.0
Population outlook (Seminole County) Hauer SSP2
- Today (2025)
- 515,494 people
- By 2030
- 545,713 · +5.9%
- By 2040
- 598,068 · +16.0%
- By 2050
- 640,663 · +24.3%
- By 2075
- 724,461 · +40.5%
- By 2100
- 755,530 · +46.6%
Race, ethnicity, and origin ACS 2023
- Neighborhood character
- Diverse neighborhood (Simpson 0.70)
- Race & ethnicity
- White 43% Black 24% Hispanic / Latino 23% Two or more races 13% Asian 7%
- Hispanic origin (detail)
- Mexican 2% Puerto Rican 7% Cuban 2% Dominican 2%
- Common ancestry
- Romanian 2% Slovak 1% Italian 1%
- Foreign-born
- 18% · Canada, Jamaica, China
- Languages at home
- 76% English-only · Spanish 15% Other Indo-European 3% Other Asian/Pacific 1%
Political lean MEDSL · Seminole
- 2024 margin
- Toss-up / Even · D 47.6% · R 51.1% · Other 1.3%
- 2008→2024 swing
- -0.8pp no change · 2008: -2.8pp · 2024: -3.5pp
- All cycles
- 2024: R+3.5 2020: D+2.8 2016: R+1.6 2012: R+6.5 2008: R+2.8
Not yet ingested
- Civics
- —
Market trends
- HPI YoY
- ▼ -281.27%
- Current HPI
- 299.2738
- Rent YoY
- ▲ 0.38%
- Metro
- Orlando-Kissimmee-Sanford, FL
- State GDP YoY
- ▲ 3.28%
- F500 in state
- 36
Industry mix (Fortune 500 HQ in FL)
| Industry | F500 HQs | Revenue |
|---|---|---|
| Industrial Technology | 2 | $29B |
|
||
| Insurance | 2 | $17B |
|
||
| Retail | 1 | $60B |
|
||
| Technology Distribution | 1 | $58B |
|
||
| Homebuilding | 1 | $35B |
|
||
| Technology Manufacturing | 1 | $35B |
|
||
Price history
-6.3% since first listed2 events — show timeline
- 2026-05-21 Price Changed $224,999 Stellar MLS as Distributed by MLS Grid
- 2026-04-25 Listed $239,999 Stellar MLS as Distributed by MLS Grid
Property tax history
+5.7%/yrLatest (2025): $3,879 · +5.9% YoY. Source: county tax records.
Cash-flow waterfall
monthlySold comps — $/sqft
last 12 mo · ≤1 miLoading sold comps…