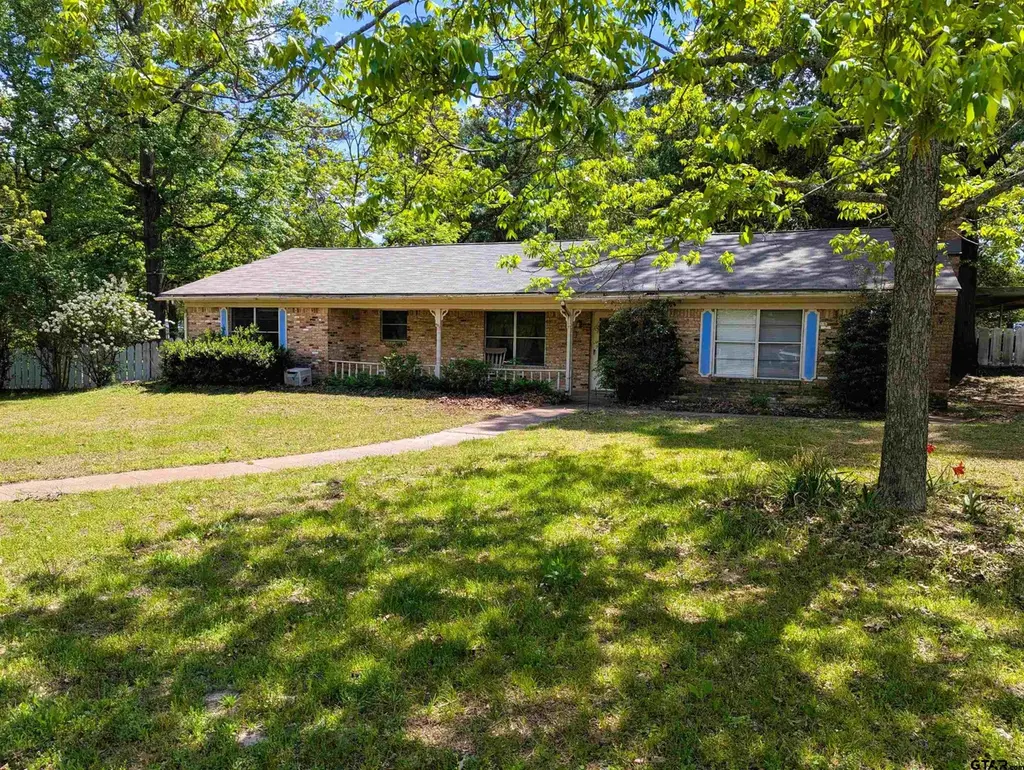
7434 Brookhollow Dr · Tyler, TX
Flood risk 1/10 · Minimal
- FEMA flood zone
- X (unshaded)
- Chance of flooding over 30 yrs
- 0.0%
- Est. flood insurance / yr
- $507 – $1,088
Fire risk 4/10 · Minor
- Est. fire insurance / yr
- $1,222 – $2,270
Heat risk 6/10 · Moderate
- Hot days now (above 109°F)
- 7 days/yr
- Hot days in 30 yrs
- 26 days/yr
Wind risk 6/10 · Moderate
- Chance of severe wind over 30 yrs
- 61.0%
Air-quality risk 2/10 · Minimal
- Unhealthy air days now
- 0 days/yr
- Unhealthy air days in 30 yrs
- 1 days/yr
Risk factors via First Street. Map © Google.
Why this score? — see what drove the C- grade
The composite is a weighted blend of 9 inputs, each scored 0–100. Each bar is that input's sub-score; the figure is the points it added to the 100-point composite (weight × sub-score).
- ARV discount +15.0/15.0
- Cash flow +13.7/30.0
- Schools +5.5/10.0
- DSCR +4.1/10.0
- Livability +3.8/5.0
- 1% rule +3.6/10.0
- Rent growth +3.1/5.0
- Condition / age +2.5/5.0
- Appreciation +0.0/10.0
$249,000
🖨 Deal sheet 📄 Offer letter ✓ Due diligence
Listing remarks MLS
One-story, huge corner lot, with 4BR/2BTH/4 Car Carport brick home with circle drive and Whitehouse Schools on 3/4 acre & HUGE SHOP with access doors in front and back, and a built in concrete ramp. Located near Grande and Rhones Quarter Rd. , with 2174 SF, built in 1965. NEW ROOF just under a year old. Nice covered back porch/patio area. Huge living area, massive master bedroom, huge dining/den area. Two gas fireplaces. All appliances convey including refrigerator, microwave, washer and dryer. Call today for your showing.
Key facts
- 0.76 acre lot
- Built 1965
- Listed 69 days
Neighborhood map
What this means for you Summary
Snapshot
- This is a 4-bed/2.0-bath single-family listed at $249k.
Deal economics
- At list price, monthly cash flow is $16 ($196/yr) — positive.
- The deal already cash-flows at list — no discount required.
- To meet the 1% rule (rent ≥ 1% of price), the offer needs to be $214k (14.0% below list).
- Recommended offer: $214k (14.0% below list) — sets the bar for 1% rule.
- Cap rate 6.4% vs local median 3.6% in Tyler — top-decile yield for the area; either an underpriced asset or a hidden risk that comps aren't pricing in. Stress-test before assuming the spread holds.
Location & tenants
- Location reads 75/100 on livability (#147 in TX, #4,181 nationally) — a middle-class / working-renter tenant base. Strengths: cost of living A+, housing A+, health & safety A+; Watch: employment C-, schools D+, crime D+.
- Whitehouse ISD (suburban): math 68% / reading 59% proficiency, ranked #38 of 826 in TX (top 5%) — acceptable for families but not a draw, mixed tenant base, ~2y average lease.
- Market conditions: Rents rising (+2.4%/yr); 188 active listings in the ZIP; 20 comparable units currently listed for rent nearby; rentals lingering (median 44d on market — plan ~5-8 weeks vacancy on turnover, expect pricing pressure); 50% of comp listings sitting > 30 days — soft ceiling on asking rent; solid renter incomes; 595 units permitted in Smith County in 2024 (45 in 5+ unit buildings).
- This rent runs 30% of the median local income ($85k/yr) — at the standard rent-burdened threshold; future hikes will face affordability resistance.
Forward outlook
- Local home prices are declining (-3.0%/yr); year-one equity from $2k of loan paydown is wiped out by about $7k of value loss. Plan a longer hold.
- Smith County population projected at +24% by 2050 — long-run rental-demand tailwind backs the buy-and-hold thesis.
Negotiation context
- It's been on market 70 days — a 6% lower offer ($234k) is reasonable based on typical stale-listing flexibility.
Risks & watch-outs
- Climate carrying-cost: major wind risk, 61% chance of damaging wind over 30y; extreme-heat days projected 7→26/yr by 2055 (HVAC capex compounding) — expect insurance premiums to compound above CPI over the hold.
Questions for the listing agent
- It's been on market 70 days. Have you received any prior offers? Is the seller open to a 14% concession, seller financing, or rate buy-down credit?
- Built in 1965 — when were the roof, HVAC, electrical panel, plumbing, and water heater last replaced?
- Why hasn't it sold? Are there any deal-killer items the seller is aware of (foundation, flood, title, zoning, code violations)?
- Is there a deadline driving the sale (1031 exchange, divorce, estate, relocation)? That informs how much negotiation room exists.
- Schools are D-rated, which usually means shorter tenancies and higher turnover. Who's the typical renter profile here, and what's been the actual vacancy rate?
- Crime grade is D in this area — have there been break-ins, vandalism, or insurance claims at this property in the last 3 years? What carrier currently insures it and at what premium?
- What's the average days-on-market for RENTAL listings here right now (not sales)? A rising rental-DOM trend means longer vacancies and softer asking-rent achievability than the comps imply.
- What's the recent tenant-quality profile in this submarket — average credit score on applications, eviction rate, late-payment / NSF rate, and stable-employment percentage? A property-management company in the area should have these aggregated.
- How much new for-sale + rental construction is in the pipeline within 1–3 miles? Heavy new supply typically softens prices + rents 12–24 months out; constrained supply supports both.
Investment metrics
- 1% rule
- 0.86% ✗
- Cap rate
- 6.37%
- Cash-on-cash
- 0.28%
- DSCR
- 1.01
- GRM
- 9.7
CMA / ARV
- ARV (median comp)
- $315,968
- List price
- $249,000
- Delta
- -21.19%
- Verdict
- UNDERPRICED
- Comps
- 20 within 1.0 mi
Show comp detail 2 sales within ~0.75 mi
| Address | Dist | Beds/Ba | Sqft | Sold | Price | $/sf | Match |
|---|---|---|---|---|---|---|---|
| 5527 Andover Dr | 0.59mi | 4/2.0 | 2,374 (+9%) | 2mo | $379,500 | $160 | 56 |
| 5707 Persimmon Dr | 0.38mi | 4/2.0 | 1,915 (-12%) | 13mo | $335,000 | $175 | 52 |
Match score weights: distance 35% · size 25% · config 20% · recency 20%. Top-matched comps best support the ARV.
Projected returns pro-forma
-3.0% appreciation · 2.37% rent growth · sell at horizon
- IRR
- -16.5%
- Equity multiple
- 0.42×
- Total profit
- $-40,652
- Equity at exit
- $37,127
- IRR
- -9.5%
- Equity multiple
- 0.43×
- Total profit
- $-39,506
- Equity at exit
- $21,529
Cash invested: $69,720 (down + closing). Projections, not guarantees.
Landlord ↔ Tenant lean methodology
- Overall (STATE)
- 87 Strongly Landlord-Friendly
- State Texas
- 87 Strongly Landlord-Friendly · R+5
- County
- — inherits STATE
- City
- — inherits STATE
ZIP-level market 75707
- Home prices YoY
- -24.8%
- Rents YoY
- 2.4%
- Active inventory
- 188
- Price-to-rent
- 9.7×
Monthly cashflow live
- Estimated rent
- $2,141 high interval (Pro) →
- Mortgage (P&I)
- −$1,306
- Tax from tax record
- −$266 /mo · $3,189/yr
- Insurance
- −$104
- HOA
- −$0
- Vacancy / Maint / Mgmt
- −$450
- Net cashflow
- $16
Break-even live
UW: 25.0% down · 7.5% · 30yr · 1.5% tax · 5.0% vac · 8.0% maint · 8.0% mgmt
Financing live
Cash to close
- Down payment
- $62,250
- Closing costs
- $7,470
- Reserves months
- —
- Total cash needed
- —
Loan-product check · same deal, 3 products live
Conventional
25% down · 7.5% · 30yr
- Down + closing
- —
- Monthly P&I
- —
- Monthly cashflow
- —
- DSCR
- —
- Eligible?
- —
Personal DTI + credit; lowest rate.
DSCR
20% down · 8.5% · 30yr
- Down + closing
- —
- Monthly P&I
- —
- Monthly cashflow
- —
- DSCR
- —
- Eligible?
- —
No personal income docs; deal must DSCR.
Hard money
10% down · 12.0% · 12mo
- Down + closing
- —
- Monthly P&I
- —
- Monthly cashflow
- —
- DSCR
- —
- Eligible?
- —
Short-term bridge; refi at stabilization.
Rent comps 20 comps
| Address | Beds | Baths | Sqft | Rent | $/sqft | DOM | Units | Dist |
|---|---|---|---|---|---|---|---|---|
| 6505 Rhones Quarter Rd Tyler, TX | 2.0–3.0 | 2.5 | 1331 | $1,995 | $1.50 | 43d | 3 | 0.29mi |
| 3021 Naomi Dr Tyler, TX | 3.0 | 3.0 | 1412 | $1,950 | $1.38 | 43d | 1 | 0.35mi |
| 5716 Thomas Nelson Dr Tyler, TX | 3.0 | 2.0 | 1855 | $2,300 | $1.24 | 43d | 1 | 0.39mi |
| 8856 Pleasant Hill Cir Tyler, TX | 3.0 | 2.0 | 2000 | $3,200 | $1.60 | 13d | 1 | 0.51mi |
| 6331 Villa Rosa Way Unit 6331 Tyler, TX | 3.0 | 2.0 | 1498 | $1,895 | $1.27 | 21d | 1 | 0.54mi |
| 5603 Thomas Nelson Dr Tyler, TX | 3.0 | 2.0 | 1880 | $2,500 | $1.33 | 43d | 1 | 0.54mi |
| 13370 State Highway 110 S Tyler, TX | 3.0 | 2.0 | 2281 | $1,950 | $0.85 | 43d | 1 | 0.62mi |
| 6228 Villa Rosa Way Unit 6228 Tyler, TX | 3.0 | 2.0 | 1498 | $1,895 | $1.27 | 43d | 1 | 0.62mi |
| 6225 Villa Rosa Way Unit 6225 Tyler, TX | 3.0 | 2.5 | 1556 | $1,795 | $1.15 | 13d | 1 | 0.63mi |
| 6219 Villa Rosa Way Tyler, TX | 3.0 | 2.5 | 1556 | $1,795 | $1.15 | 13d | 1 | 0.64mi |
| 6218 Villa Rosa Way Unit 6218 Tyler, TX | 3.0 | 2.0 | 1498 | $1,895 | $1.27 | 43d | 1 | 0.65mi |
| 6015 Villa Rosa Way Tyler, TX | 3.0 | 2.0 | 1498 | $1,895 | $1.27 | 43d | 1 | 0.66mi |
| 6215 Villa Rosa Way Unit 6215 Tyler, TX | 3.0 | 2.5 | 1556 | $1,850 | $1.19 | 21d | 1 | 0.66mi |
| 6017 Villa Rosa Way Unit 6017 Tyler, TX | 3.0 | 2.0 | 1498 | $1,895 | $1.27 | 21d | 1 | 0.66mi |
| 6036 Villa Rosa Way Unit 6036 Tyler, TX | 3.0 | 2.0 | 1498 | $1,850 | $1.23 | 43d | 1 | 0.71mi |
| 7069 Hillside Ave Tyler, TX | 3.0 | 2.5 | 1882 | $2,695 | $1.43 | 43d | 1 | 0.73mi |
| 2525 Shiloh Rd Tyler, TX | 3.0–4.0 | 2.0 | 1360 | $1,599 | $1.18 | 13d | 1 | 0.82mi |
| 14659 County Road 2191 Whitehouse, TX | 2.0–3.0 | 2.0–2.5 | 1325 | $1,995 | $1.51 | 13d | 3 | 1.01mi |
| 4520 Edinburgh Dr Tyler, TX | 3.0 | 2.0 | 1436 | $1,425 | $0.99 | 21d | 1 | 1.45mi |
| 4518 Edinburgh Dr Unit 4520 Edinburgh Tyler, TX | 3.0 | 2.0 | 1436 | $1,425 | $0.99 | 21d | 1 | 1.46mi |
Listing history 19 events
-
2026-06-19days on market $249,000 Active 70 DOM
-
2026-06-18days on market $249,000 Active 69 DOM
-
2026-06-17days on market $249,000 Active 68 DOM
-
2026-06-16days on market $249,000 Active 67 DOM
-
2026-06-15days on market $249,000 Active 66 DOM
-
2026-06-14days on market $249,000 Active 64 DOM
-
2026-06-13days on market $249,000 Active 63 DOM
-
2026-06-10days on market $249,000 Active 61 DOM
-
2026-06-09days on market $249,000 Active 60 DOM
-
2026-06-08days on market $249,000 Active 59 DOM
-
2026-06-07days on market $249,000 Active 58 DOM
-
2026-06-05days on market $249,000 Active 55 DOM
-
2026-06-02days on market $249,000 Active 53 DOM
-
2026-06-01days on market $249,000 Active 52 DOM
-
2026-05-31days on market $249,000 Active 51 DOM
-
2026-05-30days on market $249,000 Active 50 DOM
-
2026-05-10price $249,000 535-char remark
Show marketing remark (535 chars)
One-story, huge corner lot, with 4BR/2BTH/4 Car Carport brick home with circle drive and Whitehouse Schools on 3/4 acre & HUGE SHOP with access doors in front and back, and a built in concrete ramp. Located near Grande and Rhones Quarter Rd. , with 2174 SF, built in 1965. NEW ROOF just under a year old. Nice covered back porch/patio area. Huge living area, massive master bedroom, huge dining/den area. Two gas fireplaces. All appliances convey including refrigerator, microwave, washer and dryer. Call today for your showing.
-
2026-04-10$259,000 Active 535-char remark
Show marketing remark (535 chars)
One-story, huge corner lot, with 4BR/2BTH/4 Car Carport brick home with circle drive and Whitehouse Schools on 3/4 acre & HUGE SHOP with access doors in front and back, and a built in concrete ramp. Located near Grande and Rhones Quarter Rd. , with 2174 SF, built in 1965. NEW ROOF just under a year old. Nice covered back porch/patio area. Huge living area, massive master bedroom, huge dining/den area. Two gas fireplaces. All appliances convey including refrigerator, microwave, washer and dryer. Call today for your showing.
-
1992-09-30soldstatus
ⓘ Source: listings_history table (triggers on properties + properties_extension) + one-shot
backfill from property_details.listing_events for pre-trigger history.
Tax reassessment forecast TX · Resets to sale price
- Current annual tax
- $3,189 · $266/mo
- Projected year-2 tax
- $4,557 · $380/mo
- Expected delta
- +$1,367/yr (+$114/mo · 42.9%)
ⓘ Screening estimate from a state-policy table — verify with the county assessor before closing.
Climate risk First Street
- Flood 1/10 Low FEMA zone X (unshaded) · 0% chance over 30 yrs
- Wildfire 4/10 Moderate
- Heat 6/10 Major 7 d/yr ≥109°F today · 26 d/yr by 30 yrs out
- Wind 6/10 Major 61% chance of damaging wind over 30 yrs
- Air quality 2/10 Low 0 unhealthy d/yr today · 1 by 30 yrs out
Nearby sold comps map
Loading sold comps map…
Walkable amenities ~0.75 mi
Loading nearby amenities…
Taxation est. · year 1
- Rental income
- $25,696
- − Mortgage interest
- −$13,948
- − Property taxes
- −$3,189
- − Insurance
- −$1,245
- − Repairs & maintenance
- −$2,056
- − Management
- −$2,056
- − Depreciation
- −$7,244
- Taxable loss
- −$4,041
- Est. tax savings @ 24.0%
- +$970
- After-tax cash flow
- $1,166/yr
For passive investors: Depreciation is non-cash, so a rental often shows a tax loss while cash-flowing — sheltering income. Rental losses are passive: they offset passive income freely, and up to $25,000/yr can offset ordinary (W-2) income if you actively participate and your MAGI is under $100k (phasing out to $0 by $150k); unused losses carry forward. On sale, claimed depreciation is recaptured at up to 25%, and gains may owe capital-gains tax (a 1031 exchange can defer both). Figures are a year-1 estimate at your 24.0% rate — not tax advice; consult a CPA.
Schools (NCES district)
- District
- Whitehouse ISD
- NCES district ID
- 4845600
- Math proficiency
- 68% ▼ -4.00%
- Reading proficiency
- 59% ▼ -1.00%
- Median HH income
- $62,060
- Composite
- 55.18/100
- National rank
- #1274
- State rank
- #38 of 826 in TX
Livability — Tyler
- Score
- 75/100
- State rank
- #147
- US rank
- #4181
Category grades
Schools grade is shown separately in the Schools card above.
Census & demographics
- County
- Smith County · 180,570 people
- City population
- 127,842
- Metro
- Tyler, TX
- Population (ZIP)
- 17,532
- Household income
- $84,954
- Rent vs Own
- Severe rent burden
- 304.0
Population outlook (Smith County) Hauer SSP2
- Today (2025)
- 248,890 people
- By 2030
- 261,665 · +5.1%
- By 2040
- 286,114 · +15.0%
- By 2050
- 308,006 · +23.8%
- By 2075
- 354,171 · +42.3%
- By 2100
- 372,828 · +49.8%
Race, ethnicity, and origin ACS 2023
- Neighborhood character
- Predominantly White (72%)
- Race & ethnicity
- White 72% Hispanic / Latino 14% Black 10% Two or more races 6% Asian 2%
- Hispanic origin (detail)
- Mexican 13%
- Common ancestry
- Slovak 1% Italian 1% Iranian 1%
- Foreign-born
- 5% · Canada
- Languages at home
- 88% English-only · Spanish 10% Other Indo-European 1% Tagalog/Filipino 1%
Political lean MEDSL · Smith
- 2024 margin
- Solid R (+45.1) · D 27.0% · R 72.1%
- 2008→2024 swing
- -5.6pp toward R · 2008: -39.5pp · 2024: -45.1pp
- All cycles
- 2024: R+45.1 2020: R+39.4 2016: R+43.9 2012: R+46.9 2008: R+39.5
Not yet ingested
- Civics
- —
Market trends
- HPI YoY
- ▼ -64.97%
- Current HPI
- 196.577
- Rent YoY
- ▲ 2.37%
- Metro
- Tyler, TX
- State GDP YoY
- ▲ 3.95%
- F500 in state
- 110
Industry mix (Fortune 500 HQ in TX)
| Industry | F500 HQs | Revenue |
|---|---|---|
| Energy | 16 | $1,198B |
|
||
| Technology | 5 | $198B |
|
||
| Engineering / Construction | 4 | $72B |
|
||
| Energy Services | 3 | $60B |
|
||
| Utilities | 3 | $41B |
|
||
| Healthcare | 2 | $330B |
|
||
Price history
-3.9% since first listed3 events — show timeline
- 2026-05-10 Price Changed $249,000 GTAR
- 2026-04-10 Listed $259,000 GTAR
- 1992-09-30 Sold (Public Records) — Public Records
Property tax history
+4.5%/yrLatest (2024): $3,189 · +11.4% YoY. Source: county tax records.
Cash-flow waterfall
monthlySold comps — $/sqft
last 12 mo · ≤1 miLoading sold comps…