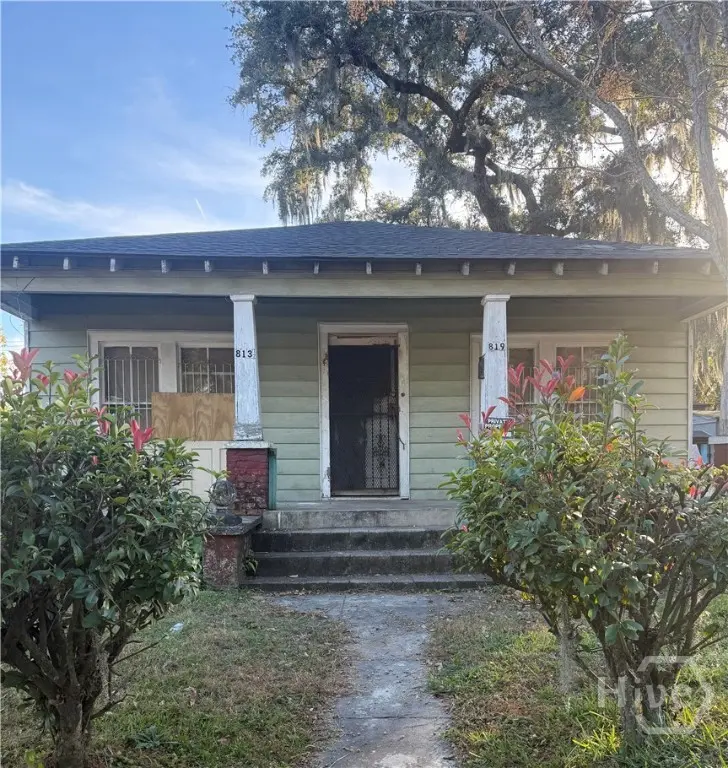
819 W 52nd Ln · Savannah, GA
Flood risk 1/10 · Minimal
- FEMA flood zone
- X (unshaded)
- Chance of flooding over 30 yrs
- 0.0%
- Est. flood insurance / yr
- $507 – $1,088
Fire risk 2/10 · Minimal
- Est. fire insurance / yr
- $963 – $1,789
Heat risk 9/10 · Severe
- Hot days now (above 108°F)
- 7 days/yr
- Hot days in 30 yrs
- 18 days/yr
Wind risk 9/10 · Severe
- Chance of severe wind over 30 yrs
- 99.0%
Air-quality risk 2/10 · Minimal
- Unhealthy air days now
- 2 days/yr
- Unhealthy air days in 30 yrs
- 2 days/yr
Risk factors via First Street. Map © Google.
Why this score? — see what drove the B- grade
The composite is a weighted blend of 9 inputs, each scored 0–100. Each bar is that input's sub-score; the figure is the points it added to the 100-point composite (weight × sub-score).
- Cash flow +30.0/30.0
- 1% rule +10.0/10.0
- DSCR +10.0/10.0
- ARV discount +7.5/15.0
- Livability +4.3/5.0
- Rent growth +2.3/5.0
- Schools +2.0/10.0
- Condition / age +1.0/5.0
- Appreciation +0.0/10.0
$115,000
🖨 Deal sheet 📄 Offer letter ✓ Due diligence
Listing remarks
Back On the Market. No Fault to Seller. Located just 10 minutes from downtown Savannah, this 4-bedroom, 3-bathroom corner-lot property offers excellent investment potential. The home requires renovation and is being sold AS IS, making it a strong value-add opportunity for investors looking to customize and maximize returns. The property also features a mother-in-law suite located behind the main home, ideal for additional rental income or a separate living space. With its convenient location, flexible layout, and multi-unit possibilities, this property is a prime opportunity to enhance your portfolio. This is an estate sale.
Key facts
- Mother-in-law suite
- Flexible layout
- Corner-lot property
Tags
Property features AI
Exterior
- Utilities: Public water; Public sewer
- Home design: Single-family residence, 1 story; Property is attached with no common walls
- Construction: Frame and wood siding construction
- Exterior features: Property has a view
Interior
- Bathrooms: 3 full bathrooms
- Interior features: Gas water heater
- Laundry & utility: Laundry area (other)
Neighborhood map
What this means for you Summary
Snapshot
- This is a 4-bed/3.0-bath single-family listed at $115k. Condition is rated poor.
Deal economics
- At list price, monthly cash flow is $1k ($12k/yr) — positive.
- The deal already cash-flows at list — no discount required.
- Meets the 1% rule at list price ($2k rent vs $115k).
- Recommended offer: $108k (6.0% below list) — sets the bar for market timing.
- Cap rate 17.0% vs local median 4.0% in Savannah — top-decile yield for the area; either an underpriced asset or a hidden risk that comps aren't pricing in. Stress-test before assuming the spread holds.
Location & tenants
- Location reads 86/100 on livability (#1 in GA, #397 nationally) — a professional / high-income tenant draw. Strengths: crime A+, amenities A+, commute A+; Watch: employment D, schools F.
- Savannah-Chatham County (urban): math 20% / reading 26% proficiency, ranked #134 of 174 in GA (top 77%) — low school quality limits family demand, transient renter base, plan for 1-2y turnover.
- Market conditions: Rents soft (-0.7%/yr); 268 active listings in the ZIP; 40 comparable units currently listed for rent nearby; rentals at typical pace (median 24d on market — plan ~3-4 weeks tenant-placement turnaround); 42% of comp listings sitting > 30 days — soft ceiling on asking rent; 2,694 units permitted in Chatham County in 2024 (973 in 5+ unit buildings).
- This rent runs 42% of the median local income ($66k/yr) — at the standard rent-burdened threshold; future hikes will face affordability resistance.
Forward outlook
- Local home prices are declining (-3.0%/yr); year-one equity from $795 of loan paydown is wiped out by about $3k of value loss. Plan a longer hold.
- Chatham County population projected at +33% by 2050 — long-run rental-demand tailwind backs the buy-and-hold thesis.
- At projected returns (-3.0% appreciation + 0.0% rent growth), your $32k cash investment doubles in ~4 years — after that, you're playing with house money.
Negotiation context
- It's been on market 64 days — a 6% lower offer ($108k) is reasonable based on typical stale-listing flexibility.
Risks & watch-outs
- Watch-outs: built in 1950 — expect roof / HVAC / electrical / plumbing capex.
- Climate carrying-cost: severe wind risk, 99% chance of damaging wind over 30y; extreme-heat days projected 7→18/yr by 2055 (HVAC capex compounding) — expect insurance premiums to compound above CPI over the hold.
Questions for the listing agent
- It's been on market 64 days. Have you received any prior offers? Is the seller open to a 6% concession, seller financing, or rate buy-down credit?
- Have any recent inspections been done? Can we get a copy of the seller's disclosures and any deferred-maintenance estimates?
- Built in 1950 — when were the roof, HVAC, electrical panel, plumbing, and water heater last replaced?
- Why hasn't it sold? Are there any deal-killer items the seller is aware of (foundation, flood, title, zoning, code violations)?
- Is there a deadline driving the sale (1031 exchange, divorce, estate, relocation)? That informs how much negotiation room exists.
- Schools are F-rated, which usually means shorter tenancies and higher turnover. Who's the typical renter profile here, and what's been the actual vacancy rate?
- What's the average days-on-market for RENTAL listings here right now (not sales)? A rising rental-DOM trend means longer vacancies and softer asking-rent achievability than the comps imply.
- What's the recent tenant-quality profile in this submarket — average credit score on applications, eviction rate, late-payment / NSF rate, and stable-employment percentage? A property-management company in the area should have these aggregated.
- How much new for-sale + rental construction is in the pipeline within 1–3 miles? Heavy new supply typically softens prices + rents 12–24 months out; constrained supply supports both.
Investment metrics
- 1% rule
- 2.01% ✓
- Cap rate
- 17.04%
- Cash-on-cash
- 38.37%
- DSCR
- 2.71
- GRM
- 4.1
CMA / ARV
- ARV (on-the-fly)
- $271,440
- Comps found
- 12
Show comp detail 12 sales within ~0.75 mi
| Address | Dist | Beds/Ba | Sqft | Sold | Price | $/sf | Match |
|---|---|---|---|---|---|---|---|
| 522 Acacia St | 0.31mi | 4/2.5 | 1,696 (-2%) | 9mo | $330,000 | $195 | 72 |
| 115 W 55th St | 0.47mi | 3/2.0 (-1) | 1,682 (-3%) | 3mo | $395,000 | $235 | 61 |
| 1128 W 49th St | 0.43mi | 3/2.0 (-1) | 1,610 (-8%) | 5mo | $249,900 | $155 | 54 |
| 925 W Victory Dr | 0.52mi | 3/1.0 (-1) | 1,704 (-2%) | 9mo | $120,000 | $70 | 52 |
| 1031 Milton St | 0.61mi | 3/2.0 (-1) | 1,720 (-1%) | 10mo | $300,000 | $174 | 52 |
| 10 E 55th St | 0.64mi | 3/2.0 (-1) | 1,722 (-1%) | 10mo | $636,000 | $369 | 51 |
| 540 W 44th St | 0.54mi | 3/1.5 (-1) | 1,873 (+8%) | 4mo | $215,000 | $115 | 48 |
| 704 W 60th St | 0.40mi | 3/1.0 (-1) | 1,509 (-13%) | 4mo | $136,400 | $90 | 43 |
| 2511 Hopkins St | 0.61mi | 4/2.5 | 1,951 (+12%) | 11mo | $305,000 | $156 | 40 |
| 4206 Crane St | 0.56mi | 3/2.0 (-1) | 1,488 (-14%) | 3mo | $190,000 | $128 | 38 |
| 1004 W 41st St | 0.64mi | 3/2.0 (-1) | 1,480 (-15%) | 11mo | $170,000 | $115 | 27 |
| 815 W 39th St | 0.72mi | 3/2.0 (-1) | 1,508 (-13%) | 11mo | $262,000 | $174 | 26 |
Match score weights: distance 35% · size 25% · config 20% · recency 20%. Top-matched comps best support the ARV.
Projected returns pro-forma
-3.0% appreciation · 0.0% rent growth · sell at horizon
- IRR
- 31.0%
- Equity multiple
- 2.25×
- Total profit
- $40,207
- Equity at exit
- $17,147
- IRR
- 36.5%
- Equity multiple
- 3.90×
- Total profit
- $93,437
- Equity at exit
- $9,943
Cash invested: $32,200 (down + closing). Projections, not guarantees.
Landlord ↔ Tenant lean methodology
- Overall (STATE)
- 90 Strongly Landlord-Friendly
- State Georgia
- 90 Strongly Landlord-Friendly · R+3
- County
- — inherits STATE
- City
- — inherits STATE
ZIP-level market 31405
- Home prices YoY
- -32.4%
- Rents YoY
- -0.7%
- Active inventory
- 268
- Price-to-rent
- 4.1×
Monthly cashflow live
- Estimated rent
- $2,309 high interval (Pro) →
- Mortgage (P&I)
- −$603
- Tax est. 1.5%
- −$144 /mo · $1,725/yr
- Insurance
- −$48
- HOA
- −$0
- Vacancy / Maint / Mgmt
- −$485
- Net cashflow
- $1,030
Break-even live
UW: 25.0% down · 7.5% · 30yr · 1.5% tax · 5.0% vac · 8.0% maint · 8.0% mgmt
Financing live
Cash to close
- Down payment
- $28,750
- Closing costs
- $3,450
- Reserves months
- —
- Total cash needed
- —
Loan-product check · same deal, 3 products live
Conventional
25% down · 7.5% · 30yr
- Down + closing
- —
- Monthly P&I
- —
- Monthly cashflow
- —
- DSCR
- —
- Eligible?
- —
Personal DTI + credit; lowest rate.
DSCR
20% down · 8.5% · 30yr
- Down + closing
- —
- Monthly P&I
- —
- Monthly cashflow
- —
- DSCR
- —
- Eligible?
- —
No personal income docs; deal must DSCR.
Hard money
10% down · 12.0% · 12mo
- Down + closing
- —
- Monthly P&I
- —
- Monthly cashflow
- —
- DSCR
- —
- Eligible?
- —
Short-term bridge; refi at stabilization.
Rent comps 40 comps
| Address | Beds | Baths | Sqft | Rent | $/sqft | DOM | Units | Dist |
|---|---|---|---|---|---|---|---|---|
| 1004 W 53rd St Savannah, GA | 3.0 | 2.0 | 1700 | $2,300 | $1.35 | 43d | 1 | 0.08mi |
| 601 W 54th St Savannah, GA | 1.0–4.0 | 1.0–2.0 | 881 | $1,850 | $2.10 | 23d | 1 | 0.24mi |
| 1003 W 46th St Savannah, GA | 3.0 | 1.0 | 1100 | $1,625 | $1.48 | 13d | 1 | 0.36mi |
| 607 W 44th St Unit B Savannah, GA | 3.0 | 1.0 | 1050 | $1,650 | $1.57 | 43d | 1 | 0.51mi |
| 1005 W Victory Dr Savannah, GA | 3.0 | 2.0 | 1056 | $1,950 | $1.85 | 23d | 1 | 0.52mi |
| 906 W Victory Dr Savannah, GA | 3.0 | 2.0 | 1176 | $2,400 | $2.04 | 23d | 1 | 0.53mi |
| 206 W 60th St Savannah, GA | 3.0 | 1.0 | 1600 | $1,600 | $1.00 | 21d | 1 | 0.59mi |
| 3605 Bull St #2 Savannah, GA | 3.0 | 2.0 | 1408 | $1,695 | $1.20 | 43d | 1 | 0.61mi |
| 3605 Bull St Unit 3 Savannah, GA | 3.0 | 2.0 | 1408 | $1,600 | $1.14 | 23d | 1 | 0.61mi |
| 3601 Bull St Apt 3 Savannah, GA | 3.0 | 2.0 | 1386 | $1,825 | $1.32 | 43d | 1 | 0.61mi |
| 3601 Bull St Unit 2 Savannah, GA | 3.0 | 2.0 | 1386 | $1,900 | $1.37 | 43d | 1 | 0.61mi |
| 2 E 54th St Savannah, GA | 3.0 | 2.5 | 2164 | $2,575 | $1.19 | 43d | 1 | 0.64mi |
| 2 E 54th St Savannah, GA | 3.0 | 2.5 | 2164 | $2,575 | $1.19 | 23d | 1 | 0.64mi |
| 1026 W 41st St Savannah, GA | 3.0 | 1.0 | 1128 | $1,500 | $1.33 | 13d | 1 | 0.64mi |
| 44 Thackery Pl Apt 3 Savannah, GA | 3.0 | 2.0 | 1489 | $1,800 | $1.21 | 13d | 1 | 0.65mi |
| 1011 W 40th St Savannah, GA | 3.0 | 2.0 | 1125 | $1,995 | $1.77 | 13d | 1 | 0.67mi |
| 310 W 42nd St Savannah, GA | 3.0 | 2.0 | 1300 | $1,800 | $1.38 | 43d | 1 | 0.72mi |
| 216 W 43rd St Savannah, GA | 3.0 | 3.0 | 1722 | $2,900 | $1.68 | 23d | 1 | 0.73mi |
| 2910 Bull St Savannah, GA | 3.0 | 2.0 | 1200 | $3,500 | $2.92 | 43d | 1 | 0.75mi |
| 714 W 38th St Savannah, GA | 3.0 | 1.5 | 1200 | $1,650 | $1.38 | 23d | 1 | 0.79mi |
| 630 W 38th St Savannah, GA | 3.0 | 2.0 | 1600 | $1,950 | $1.22 | 13d | 1 | 0.82mi |
| 211 W 40th St Unit B Savannah, GA | 3.0 | 1.0 | 1400 | $3,200 | $2.29 | 23d | 1 | 0.82mi |
| 212 W 40th St Savannah, GA | 3.0 | 2.0 | 2030 | $3,600 | $1.77 | 23d | 1 | 0.84mi |
| 516 W 38th St Unit 1/2 Savannah, GA | 3.0 | 1.0 | 1176 | $1,600 | $1.36 | 23d | 1 | 0.85mi |
| 516 W 38th St Unit 1/2 Savannah, GA | 3.0 | 1.0 | 1176 | $1,500 | $1.28 | 13d | 1 | 0.85mi |
| 1025 W 38th St Savannah, GA | 4.0 | 3.0 | 1722 | $2,400 | $1.39 | 23d | 1 | 0.86mi |
| 123 E 55th St Unit Lower Savannah, GA | 3.0 | 1.0 | 1700 | $2,800 | $1.65 | 43d | 1 | 0.88mi |
| 206 W 39th St Savannah, GA | 3.0 | 2.5 | 1966 | $2,650 | $1.35 | 23d | 1 | 0.90mi |
| 2305 Whitaker St Unit A Savannah, GA | 3.0 | 3.0 | 1600 | $3,300 | $2.06 | 13d | 1 | 0.91mi |
| 138 E 50th St Unit 2 Savannah, GA | 3.0 | 2.0 | 2200 | $3,000 | $1.36 | 43d | 1 | 0.92mi |
| 2235 Whitaker St Savannah, GA | 3.0 | 2.0 | 1600 | $2,950 | $1.84 | 13d | 1 | 0.95mi |
| 120 E 61st St Savannah, GA | 4.0 | 4.0 | 1750 | $2,082 | $1.19 | 43d | 1 | 0.97mi |
| 216 E 48th St Savannah, GA | 3.0 | 1.0 | 1950 | $2,395 | $1.23 | 43d | 1 | 1.00mi |
| 214 E 48th St Savannah, GA | 3.0 | 2.0 | 1950 | $2,499 | $1.28 | 43d | 1 | 1.00mi |
| 1019 W 35th St Unit B Savannah, GA | 3.0 | 2.0 | 1071 | $2,199 | $2.05 | 13d | 1 | 1.01mi |
| 107 W 37th St Savannah, GA | 4.0 | 2.0 | 1300 | $3,200 | $2.46 | 43d | 1 | 1.02mi |
| 217 W 36th St Savannah, GA | 3.0 | 2.0 | 1950 | $3,200 | $1.64 | 43d | 1 | 1.02mi |
| 219 W 36th St Savannah, GA | 3.0 | 2.0 | 1950 | $3,200 | $1.64 | 43d | 1 | 1.02mi |
| 123 E 40th St Savannah, GA | 3.0 | 1.0 | 1389 | $1,900 | $1.37 | 43d | 1 | 1.02mi |
| 720 Dixon St Savannah, GA | 4.0 | 2.0 | 1262 | $2,250 | $1.78 | 23d | 1 | 1.07mi |
Listing history 19 events
-
2026-06-18days on market $115,000 Active 64 DOM
-
2026-06-17days on market $115,000 Active 63 DOM
-
2026-06-16days on market $115,000 Active 62 DOM
-
2026-06-15days on market $115,000 Active 61 DOM
-
2026-06-14days on market $115,000 Active 59 DOM
-
2026-06-13days on market $115,000 Active 58 DOM
-
2026-06-10days on market $115,000 Active 56 DOM
-
2026-06-09days on market $115,000 Active 55 DOM
-
2026-06-08days on market $115,000 Active 54 DOM
-
2026-06-07days on market $115,000 Active 53 DOM
-
2026-06-05remarks 632-char remark
-
2026-06-05statusdays on market $115,000 Active 50 DOM
-
2026-06-03days on market $115,000 Active Under Contract 49 DOM
-
2026-06-02days on market $115,000 Active Under Contract 48 DOM
-
2026-06-01days on market $115,000 Active Under Contract 47 DOM
-
2026-05-31days on market $115,000 Active Under Contract 46 DOM
-
2026-05-30days on market $115,000 Active Under Contract 45 DOM
-
2026-05-22historical Active Under Contract
-
2026-04-09$115,000 Active
ⓘ Source: listings_history table (triggers on properties + properties_extension) + one-shot
backfill from property_details.listing_events for pre-trigger history.
Climate risk First Street
- Flood 1/10 Low FEMA zone X (unshaded) · 0% chance over 30 yrs
- Wildfire 2/10 Low
- Heat 9/10 Extreme 7 d/yr ≥108°F today · 18 d/yr by 30 yrs out
- Wind 9/10 Extreme 99% chance of damaging wind over 30 yrs
- Air quality 2/10 Low 2 unhealthy d/yr today · 2 by 30 yrs out
Nearby sold comps map
Loading sold comps map…
Walkable amenities ~0.75 mi
Loading nearby amenities…
Taxation est. · year 1
- Rental income
- $27,711
- − Mortgage interest
- −$6,442
- − Property taxes
- −$1,725
- − Insurance
- −$575
- − Repairs & maintenance
- −$2,217
- − Management
- −$2,217
- − Depreciation
- −$3,345
- Taxable income
- $11,190
- Est. tax owed @ 24.0%
- −$2,686
- After-tax cash flow
- $9,669/yr
For passive investors: Depreciation is non-cash, so a rental often shows a tax loss while cash-flowing — sheltering income. Rental losses are passive: they offset passive income freely, and up to $25,000/yr can offset ordinary (W-2) income if you actively participate and your MAGI is under $100k (phasing out to $0 by $150k); unused losses carry forward. On sale, claimed depreciation is recaptured at up to 25%, and gains may owe capital-gains tax (a 1031 exchange can defer both). Figures are a year-1 estimate at your 24.0% rate — not tax advice; consult a CPA.
Condition & rehab AI · 5 photos
This property requires extensive renovation, including a new roof, siding, and windows, to become move-in ready. Significant value can be added through these improvements, making it a strong investment opportunity.
Repairs flagged
- Major roof — Exposed roof structure, missing shingles
- Major exterior siding — Weathered and peeling
- Major exterior windows — Broken glass
- Major exterior doors — Damaged and missing panels
Value-add opportunities
- Both New roof and siding — Improves both appearance and structural integrity
- Both New windows and doors — Enhances curb appeal and energy efficiency
- Both Landscaping and curb appeal improvements — Enhances property's visual appeal and marketability
Renovation cost estimate screening
| Repair item | Severity | Est. cost |
|---|---|---|
| roof · Exposed roof structure, missing shingles | Major | $15,000–50,000 |
| exterior siding · Weathered and peeling | Major | $15,000–50,000 |
| exterior windows · Broken glass | Major | $15,000–50,000 |
| exterior doors · Damaged and missing panels | Major | $15,000–50,000 |
| Total estimated repair cost · 4 items | $60,000–200,000 |
Value-add ROI direction
- Both New roof and siding — Improves both appearance and structural integrity ↑
- Both New windows and doors — Enhances curb appeal and energy efficiency ↑
- Both Landscaping and curb appeal improvements — Enhances property's visual appeal and marketability ↑
ⓘ Cost ranges are severity-bucket heuristics (US national rule-of-thumb). Get contractor quotes + a written scope before underwriting a rehab budget.
Schools (NCES district)
- District
- Savannah-Chatham County
- NCES district ID
- 1301020
- Math proficiency
- 20% ▼ -11.00%
- Reading proficiency
- 26% ▼ -5.00%
- Median HH income
- $47,443
- Composite
- 20.14/100
- National rank
- #8639
- State rank
- #134 of 174 in GA
Livability — Savannah
- Score
- 86/100
- State rank
- #1
- US rank
- #397
Category grades
Schools grade is shown separately in the Schools card above.
Census & demographics
- Census place
- Savannah, GA
- County
- Chatham County · 271,602 people
- City population
- 216,564
- Metro
- Savannah, GA
- Population (ZIP)
- 40,764
- Household income
- $65,710
- Rent vs Own
- Severe rent burden
- 1712.0
Population outlook (Chatham County) Hauer SSP2
- Today (2025)
- 332,584 people
- By 2030
- 355,508 · +6.9%
- By 2040
- 400,030 · +20.3%
- By 2050
- 443,019 · +33.2%
- By 2075
- 534,579 · +60.7%
- By 2100
- 583,863 · +75.6%
Race, ethnicity, and origin ACS 2023
- Neighborhood character
- Diverse neighborhood (Simpson 0.63)
- Race & ethnicity
- Black 47% White 38% Hispanic / Latino 8% Two or more races 6% Asian 3%
- Hispanic origin (detail)
- Mexican 3% Puerto Rican 1%
- Common ancestry
- Italian 1% Slovak 1% Romanian 1%
- Foreign-born
- 7% · Canada, China, Jamaica
- Languages at home
- 88% English-only · Spanish 6% Other Indo-European 2% Chinese 1%
Political lean MEDSL · Chatham
- 2024 margin
- D (+18.0) · D 58.6% · R 40.6%
- 2008→2024 swing
- +3.6pp toward D · 2008: 14.4pp · 2024: 18.0pp
- All cycles
- 2024: D+18.0 2020: D+18.8 2016: D+14.5 2012: D+12.0 2008: D+14.4
Not yet ingested
- Civics
- —
Market trends
- HPI YoY
- ▼ -147.33%
- Current HPI
- 307.4442
- Rent YoY
- ▼ -0.66%
- Metro
- Savannah, GA
- State GDP YoY
- ▲ 2.66%
- F500 in state
- 28
Industry mix (Fortune 500 HQ in GA)
| Industry | F500 HQs | Revenue |
|---|---|---|
| Paper / Packaging | 2 | $29B |
|
||
| Retail | 1 | $160B |
|
||
| Transportation / Logistics | 1 | $91B |
|
||
| Airlines | 1 | $62B |
|
||
| Consumer Goods | 1 | $47B |
|
||
| Utilities | 1 | $25B |
|
||
Price history
2 events — show timeline
- 2026-05-22 Contingent — Hive MLS
- 2026-04-09 Listed $115,000 Hive MLS
Cash-flow waterfall
monthlySold comps — $/sqft
last 12 mo · ≤1 miLoading sold comps…