 🏗️ New Construction
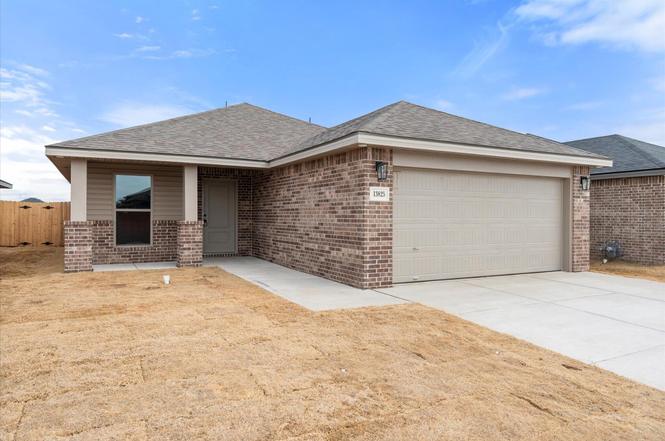
13825 Gary Ave · Lubbock, TX
Flood risk No data
- FEMA flood zone
- —
- Chance of flooding over 30 yrs
- —
- Est. flood insurance / yr
- —
Fire risk No data
- Est. fire insurance / yr
- —
Heat risk No data
- Hot days now (above threshold)
- —
- Hot days in 30 yrs
- —
Wind risk No data
- Chance of severe wind over 30 yrs
- —
Air-quality risk No data
- Unhealthy air days now
- —
- Unhealthy air days in 30 yrs
- —
Risk factors via First Street. Map © Google.
Why this score? — see what drove the C- grade
The composite is a weighted blend of 9 inputs, each scored 0–100. Each bar is that input's sub-score; the figure is the points it added to the 100-point composite (weight × sub-score).
- Cash flow +19.0/30.0
- ARV discount +7.5/15.0
- DSCR +6.0/10.0
- Schools +4.8/10.0
- 1% rule +4.1/10.0
- Livability +4.0/5.0
- Rent growth +3.0/5.0
- Condition / age +2.5/5.0
- Appreciation +0.0/10.0
$207,000
🖨 Deal sheet (PDF) 📄 Offer letter ✓ Due diligence
Listing remarks
NOW and get up to $8,000 Use-It-Your-Way Cash! This stunning home features a classic brick exterior with double columns framing a welcoming covered front porch. Inside, luxury vinyl plank flooring flows through the common areas, leading to an open-concept kitchen, living, and dining space. The kitchen impresses with granite or quartz countertops, a spacious peninsula with bar seating, stainless steel appliances, and an enclosed pantry. The secluded master suite boasts a walk-in closet, while a covered back patio provides the perfect spot to unwind. Premium fixtures throughout add a touch of elegance to this thoughtfully designed home.
Key facts
- Covered front porch
- Brick exterior
- Open-concept kitchen
Tags
Property features AI
Finance
- HOA & community: Homeowners association with $350 annual fee (about $29.17/month)
Exterior
- Parking: Attached garage with garage door opener; 2 garage spaces
- Utilities: Paved road
- Home design: Single-family residence; New construction; One story; Brick construction
- Construction: Built on slab foundation; Composition roof
- Exterior features: Covered patio; Fenced yard; Landscaped front yard with sprinklers; Paved road access
Interior
- Kitchen: Range; Cooktop; Dishwasher; Disposal; Microwave; Free-standing electric range
- Bedrooms: Total rooms: 8
- Flooring: Vinyl
- Bathrooms: 2 full bathrooms
- Heating & cooling: Central heating (natural gas); Central air; Ceiling fans; Electric cooling
- Interior features: Breakfast bar; Ceiling fans; Granite counters; Open floorplan; Pantry; Walk-in closets
- Laundry & utility: Laundry room
Neighborhood map
What this means for you Summary
Snapshot
- This is a 3-bed/2.0-bath land listed at $207k.
Deal economics
- At list price, monthly cash flow is $216 ($3k/yr) — positive.
- The deal already cash-flows at list — no discount required.
- To meet the 1% rule (rent ≥ 1% of price), the offer needs to be $188k (9.1% below list).
- Recommended offer: $188k (9.1% below list) — sets the bar for 1% rule.
Location & tenants
- Location reads 80/100 on livability (#37 in TX, #1,749 nationally) — a professional / high-income tenant draw. Strengths: commute A+, cost of living A+, housing A+; Watch: employment C-, crime F.
- Lubbock-Cooper ISD (rural): math 54% / reading 52% proficiency, ranked #98 of 826 in TX (top 12%) — acceptable for families but not a draw, mixed tenant base, ~2y average lease.
- Zoned schools: Lubbock-Cooper East El (math 45% / reading 37%, grade F, #1,462 of 4,322 statewide, top 34%, 759 students, 55% FRL); Lubbock-Cooper Middle (math 46% / reading 45%, grade D+, #470 of 1,662 statewide, top 29%, 914 students, 37% FRL); Lubbock-Cooper H S (math 67% / reading 65%, grade B, #189 of 1,632 statewide, top 12%, 2,117 students, 31% FRL).
- Market conditions: Rents rising (+2.1%/yr); 673 active listings in the ZIP; 35 comparable units currently listed for rent nearby; rentals at typical pace (median 23d on market — plan ~3-4 weeks tenant-placement turnaround); solid renter incomes; 2,219 units permitted in Lubbock County in 2024 (252 in 5+ unit buildings).
Forward outlook
- Local home prices are declining (-3.0%/yr); year-one equity from $1k of loan paydown is wiped out by about $6k of value loss. Plan a longer hold.
- Lubbock County population projected at +39% by 2050 — long-run rental-demand tailwind backs the buy-and-hold thesis.
Negotiation context
- It's been on market 56 days — a 3% lower offer ($201k) is reasonable based on typical stale-listing flexibility.
- 5 sale attempts; this cycle's ask has dropped $17k (8%) from the opening price — seller is motivated, your offer sets the floor, not the list.
Questions for the listing agent
- It's been on market 56 days. Have you received any prior offers? Is the seller open to a 9% concession, seller financing, or rate buy-down credit?
- What does the HOA fee cover, when was the last increase, and are there any pending special assessments or reserve-fund shortfalls?
- Is there a deadline driving the sale (1031 exchange, divorce, estate, relocation)? That informs how much negotiation room exists.
- Schools are D-rated, which usually means shorter tenancies and higher turnover. Who's the typical renter profile here, and what's been the actual vacancy rate?
- Crime grade is F in this area — have there been break-ins, vandalism, or insurance claims at this property in the last 3 years? What carrier currently insures it and at what premium?
- What's the average days-on-market for RENTAL listings here right now (not sales)? A rising rental-DOM trend means longer vacancies and softer asking-rent achievability than the comps imply.
- What's the recent tenant-quality profile in this submarket — average credit score on applications, eviction rate, late-payment / NSF rate, and stable-employment percentage? A property-management company in the area should have these aggregated.
- How much new for-sale + rental construction is in the pipeline within 1–3 miles? Heavy new supply typically softens prices + rents 12–24 months out; constrained supply supports both.
Investment metrics
- 1% rule
- 0.91% ✗
- Cap rate
- 7.55%
- Cash-on-cash
- 4.48%
- DSCR
- 1.20
- GRM
- 9.2
CMA / ARV
No comps found within radius.
Projected returns pro-forma
-3.0% appreciation · 2.13% rent growth · sell at horizon
- IRR
- -10.2%
- Equity multiple
- 0.63×
- Total profit
- $-21,470
- Equity at exit
- $30,864
- IRR
- -2.1%
- Equity multiple
- 0.86×
- Total profit
- $-7,826
- Equity at exit
- $17,898
Cash invested: $57,960 (down + closing). Projections, not guarantees.
Landlord ↔ Tenant lean methodology
- Overall (STATE)
- 87 Strongly Landlord-Friendly
- State Texas
- 87 Strongly Landlord-Friendly · R+5
- County
- — inherits STATE
- City
- — inherits STATE
ZIP-level market 79423
- Rents YoY
- 2.1%
- Active inventory
- 673
- Price-to-rent
- 9.2×
Monthly cashflow live
- Estimated rent
- $1,881 high interval (Pro) →
- Mortgage (P&I)
- −$1,086
- Tax from tax record
- −$69 /mo · $828/yr
- Insurance
- −$86
- HOA
- −$29
- Vacancy / Maint / Mgmt
- −$395
- Net cashflow
- $216
Break-even live
Sensitivity live
| Price | -10% $333 | -5% $275 | +0% $216 | +5% $158 | +10% $99 |
|---|---|---|---|---|---|
| Rent | -10% $68 | -5% $142 | +0% $216 | +5% $291 | +10% $365 |
| Rate | -1.0pp $321 | -0.5pp $269 | base $216 | +0.5pp $163 | +1.0pp $108 |
UW: 25.0% down · 7.5% · 30yr · 1.5% tax · 5.0% vac · 8.0% maint · 8.0% mgmt
Financing live
Cash to close
- Down payment
- $51,750
- Closing costs
- $6,210
- Reserves months
- —
- Total cash needed
- —
Loan-product check · same deal, 3 products live
Conventional
25% down · 7.5% · 30yr
- Down + closing
- —
- Monthly P&I
- —
- Monthly cashflow
- —
- DSCR
- —
- Eligible?
- —
Personal DTI + credit; lowest rate.
DSCR
20% down · 8.5% · 30yr
- Down + closing
- —
- Monthly P&I
- —
- Monthly cashflow
- —
- DSCR
- —
- Eligible?
- —
No personal income docs; deal must DSCR.
Hard money
10% down · 12.0% · 12mo
- Down + closing
- —
- Monthly P&I
- —
- Monthly cashflow
- —
- DSCR
- —
- Eligible?
- —
Short-term bridge; refi at stabilization.
Rent comps 35 comps
| Address | Beds | Baths | Sqft | Rent | $/sqft | DOM | Units | Dist |
|---|---|---|---|---|---|---|---|---|
| 3111 140th St Lubbock, TX | 4.0 | 2.0 | 1600 | $2,050 | $1.28 | 45d | 1 | 0.10mi |
| 3105 140th St Lubbock, TX | 4.0 | 2.0 | 1700 | $2,150 | $1.26 | 15d | 1 | 0.12mi |
| 3015 138th Pl Lubbock, TX | 3.0 | 2.0 | 1760 | $2,200 | $1.25 | 45d | 1 | 0.15mi |
| 3011 138th Pl Lubbock, TX | 3.0 | 2.0 | 1760 | $2,200 | $1.25 | 45d | 1 | 0.17mi |
| 3011 138th Pl Lubbock, TX | 3.0 | 2.0 | 1760 | $2,200 | $1.25 | 23d | 1 | 0.17mi |
| 3016 140th St Lubbock, TX | 3.0 | 2.0 | 1350 | $2,000 | $1.48 | 23d | 1 | 0.17mi |
| 3008 139th St Lubbock, TX | 4.0 | 2.0 | 1600 | $2,000 | $1.25 | 23d | 1 | 0.19mi |
| 13510 Indiana Ave Lubbock, TX | 1.0–2.0 | 1.5–2.5 | 895 | $1,275 | $1.42 | 15d | 8 | 0.37mi |
| 2745 137th St Lubbock, TX | 3.0 | 2.0 | 1410 | $1,550 | $1.10 | 23d | 1 | 0.45mi |
| 2739 137th St Lubbock, TX | 3.0 | 2.0 | 1418 | $1,600 | $1.13 | 45d | 1 | 0.46mi |
| 2903 134th St Lubbock, TX | 4.0 | 2.0 | 1873 | $2,300 | $1.23 | 23d | 1 | 0.46mi |
| 2713 138th St Lubbock, TX | 4.0 | 2.0 | 1650 | $2,100 | $1.27 | 23d | 1 | 0.50mi |
| 2550 137th St Lubbock, TX | 3.0 | 2.5 | 1732 | $1,795 | $1.04 | 15d | 1 | 0.61mi |
| 2626 136th St Lubbock, TX | 2.0 | 2.0 | 1238 | $1,400 | $1.13 | 45d | 1 | 0.63mi |
| 2540 138th St Lubbock, TX | 2.0 | 2.0 | 1328 | $1,425 | $1.07 | 15d | 1 | 0.63mi |
| 2627 135th St Lubbock, TX | 3.0 | 2.0 | 1518 | $1,600 | $1.05 | 23d | 1 | 0.63mi |
| 2613 136th St Lubbock, TX | 3.0 | 2.0 | 1251 | $1,599 | $1.28 | 23d | 1 | 0.65mi |
| 2529 138th St Lubbock, TX | 2.0 | 2.5 | 1249 | $1,400 | $1.12 | 23d | 1 | 0.65mi |
| 2611 136th St Lubbock, TX | 2.0 | 2.0 | 1251 | $1,599 | $1.28 | 23d | 1 | 0.65mi |
| 2607 135th St Lubbock, TX | 3.0 | 2.0 | 1518 | $1,500 | $0.99 | 45d | 1 | 0.68mi |
| 2415 144th St Unit 1-2 Lubbock, TX | 3.0 | 2.5 | 1350 | $1,500 | $1.11 | 15d | 1 | 0.84mi |
| 2410 144th St Unit A Lubbock, TX | 3.0 | 2.0 | 1350 | $1,500 | $1.11 | 45d | 1 | 0.86mi |
| 2410 144th St Unit 1-2 Lubbock, TX | 3.0 | 2.0 | 1350 | $1,399 | $1.04 | 45d | 1 | 0.86mi |
| 2309 134th St Lubbock, TX | 3.0 | 2.0 | 1455 | $1,799 | $1.24 | 15d | 1 | 0.88mi |
| 2404 144th St Unit 1-2 Lubbock, TX | 3.0 | 2.0 | 1350 | $1,399 | $1.04 | 45d | 1 | 0.90mi |
| 14408 Avenue X Unit 1-2 Lubbock, TX | 3.0 | 2.5 | 1350 | $1,500 | $1.11 | 15d | 1 | 0.91mi |
| 2308 133rd St Lubbock, TX | 3.0 | 2.0 | 1550 | $1,700 | $1.10 | 45d | 1 | 0.91mi |
| 14413 Avenue X Unit B Lubbock, TX | 3.0 | 2.0 | 1350 | $1,450 | $1.07 | 45d | 1 | 0.95mi |
| 13802 Avenue W Lubbock, TX | 3.0 | 2.0 | 1820 | $1,900 | $1.04 | 15d | 1 | 0.98mi |
| 14102 Avenue V Lubbock, TX | 3.0 | 2.0 | 1450 | $1,500 | $1.03 | 23d | 1 | 1.10mi |
| 2217 150th Pl Lubbock, TX | 4.0 | 2.0 | 1773 | $2,150 | $1.21 | 15d | 1 | 1.21mi |
| 13808 Sherman Ave Lubbock, TX | 3.0 | 2.0 | 1450 | $1,650 | $1.14 | 45d | 1 | 1.39mi |
| 13218 Sherman Ave Lubbock, TX | 4.0 | 2.0 | 1700 | $2,000 | $1.18 | 45d | 1 | 1.43mi |
| 13213 Sherman Ave Lubbock, TX | 4.0 | 2.0 | 1700 | $1,950 | $1.15 | 15d | 1 | 1.45mi |
| 13212 Avenue S Lubbock, TX | 3.0 | 2.0 | 1450 | $1,699 | $1.17 | 23d | 1 | 1.48mi |
HOA detail
- Monthly dues
- $29 · $348/yr
Listing history 14 events
-
2026-05-14status Pending
-
2026-05-13status Active
-
2026-04-28status Pending
-
2026-04-27price $207,000
-
2026-04-21status Active
-
2026-04-18status Pending
-
2026-04-17status Active
-
2026-04-01status Pending
-
2026-03-28status Active
-
2026-03-27status Pending
-
2026-03-27price $209,000
-
2026-03-23price $211,880
-
2026-03-06price $215,880
-
2026-02-12$224,000 Active
ⓘ Source: listings_history table (triggers on properties + properties_extension) + one-shot
backfill from property_details.listing_events for pre-trigger history.
Tax reassessment forecast TX · Resets to sale price
- Current annual tax
- $828 · $69/mo
- Projected year-2 tax
- $3,788 · $316/mo
- Expected delta
- +$2,960/yr (+$247/mo · 357.7%)
ⓘ Screening estimate from a state-policy table — verify with the county assessor before closing.
Nearby sold comps map
Loading sold comps map…
Walkable amenities ~0.75 mi
Loading nearby amenities…
Taxation est. · year 1
- Rental income
- $22,573
- − Mortgage interest
- −$11,595
- − Property taxes
- −$828
- − Insurance
- −$1,035
- − Repairs & maintenance
- −$1,806
- − Management
- −$1,806
- − HOA
- −$348
- − Depreciation
- −$6,022
- Taxable loss
- −$867
- Est. tax savings @ 24.0%
- +$208
- After-tax cash flow
- $2,803/yr
For passive investors: Depreciation is non-cash, so a rental often shows a tax loss while cash-flowing — sheltering income. Rental losses are passive: they offset passive income freely, and up to $25,000/yr can offset ordinary (W-2) income if you actively participate and your MAGI is under $100k (phasing out to $0 by $150k); unused losses carry forward. On sale, claimed depreciation is recaptured at up to 25%, and gains may owe capital-gains tax (a 1031 exchange can defer both). Figures are a year-1 estimate at your 24.0% rate — not tax advice; consult a CPA.
Schools (NCES district)
- District
- Lubbock-Cooper ISD
- NCES district ID
- 4815180
- Math proficiency
- 54% ▼ -7.00%
- Reading proficiency
- 52% ▼ -3.00%
- Median HH income
- $77,347
- Composite
- 47.9/100
- National rank
- #2214
- State rank
- #98 of 826 in TX
Livability — Lubbock
- Score
- 80/100
- State rank
- #37
- US rank
- #1749
Category grades
Schools grade is shown separately in the Schools card above.
Census & demographics
- Census place
- Lubbock, TX
- County
- Lubbock County · 293,542 people
- City population
- 283,030
- Metro
- Lubbock, TX
- Population (ZIP)
- 46,998
- Household income
- $84,933
- Rent vs Own
- Severe rent burden
- 1385.0
Population outlook (Lubbock County) Hauer SSP2
- Today (2025)
- 345,960 people
- By 2030
- 371,449 · +7.4%
- By 2040
- 424,539 · +22.7%
- By 2050
- 481,150 · +39.1%
- By 2075
- 633,467 · +83.1%
- By 2100
- 746,853 · +115.9%
Race, ethnicity, and origin ACS 2023
- Neighborhood character
- Majority White (61%)
- Race & ethnicity
- White 61% Hispanic / Latino 31% Two or more races 15% Black 4% Asian 2%
- Hispanic origin (detail)
- Mexican 26%
- Common ancestry
- Slovak 1% Italian 1% Serbian 1%
- Foreign-born
- 5% · Canada
- Languages at home
- 84% English-only · Spanish 13% Tagalog/Filipino 1% Other Asian/Pacific 1%
Political lean MEDSL · Lubbock
- 2024 margin
- Solid R (+39.5) · D 29.7% · R 69.2% · Other 1.0%
- 2008→2024 swing
- -2.8pp toward R · 2008: -36.7pp · 2024: -39.5pp
- All cycles
- 2024: R+39.5 2020: R+32.2 2016: R+38.4 2012: R+40.9 2008: R+36.7
Not yet ingested
- Civics
- —
Market trends
- HPI YoY
- ▼ -155.00%
- Current HPI
- 213.6491
- Rent YoY
- ▲ 2.13%
- Metro
- Lubbock, TX
- State GDP YoY
- ▲ 3.95%
- F500 in state
- 110
Industry mix (Fortune 500 HQ in TX)
| Industry | F500 HQs | Revenue |
|---|---|---|
| Energy | 16 | $1,198B |
|
||
| Technology | 5 | $198B |
|
||
| Engineering / Construction | 4 | $72B |
|
||
| Energy Services | 3 | $60B |
|
||
| Utilities | 3 | $41B |
|
||
| Healthcare | 2 | $330B |
|
||
Price history
-7.6% since first listed14 events — show timeline
- 2026-05-14 Pending — LARMLS
- 2026-05-13 Relisted — LARMLS
- 2026-04-28 Pending — LARMLS
- 2026-04-27 Price Changed $207,000 LARMLS
- 2026-04-21 Relisted — LARMLS
- 2026-04-18 Pending — LARMLS
- 2026-04-17 Relisted — LARMLS
- 2026-04-01 Pending — LARMLS
- 2026-03-28 Relisted — LARMLS
- 2026-03-27 Pending — LARMLS
- 2026-03-27 Price Changed $209,000 LARMLS
- 2026-03-23 Price Changed $211,880 LARMLS
- 2026-03-06 Price Changed $215,880 LARMLS
- 2026-02-12 Listed $224,000 LARMLS
Cash-flow waterfall
monthlySold comps — $/sqft
last 12 mo · ≤1 miLoading sold comps…