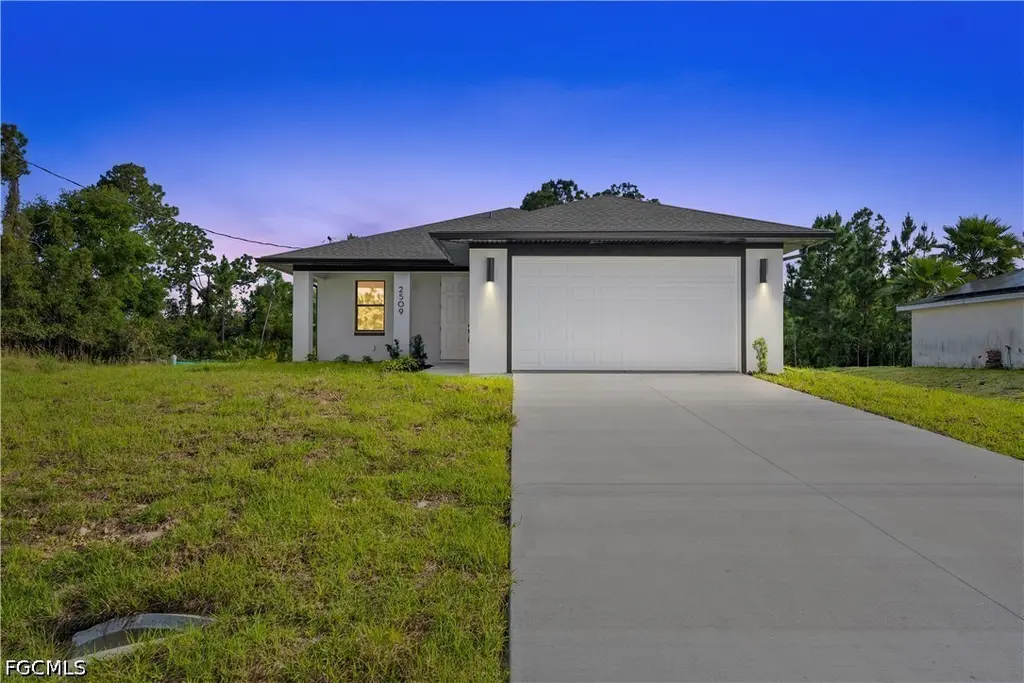
3231 57th St W · Lehigh Acres, FL
Flood risk 1/10 · Minimal
- FEMA flood zone
- X (unshaded)
- Chance of flooding over 30 yrs
- 0.0%
- Est. flood insurance / yr
- $507 – $1,088
Fire risk 3/10 · Minor
- Est. fire insurance / yr
- $947 – $1,759
Heat risk 9/10 · Severe
- Hot days now (above 108°F)
- 7 days/yr
- Hot days in 30 yrs
- 27 days/yr
Wind risk 10/10 · Severe
- Chance of severe wind over 30 yrs
- 99.0%
Air-quality risk 2/10 · Minimal
- Unhealthy air days now
- 1 days/yr
- Unhealthy air days in 30 yrs
- 1 days/yr
Risk factors via First Street. Map © Google.
Why this score? — see what drove the F grade
The composite is a weighted blend of 9 inputs, each scored 0–100. Each bar is that input's sub-score; the figure is the points it added to the 100-point composite (weight × sub-score).
- Cash flow +8.1/30.0
- ARV discount +7.5/15.0
- Schools +4.1/10.0
- Livability +3.0/5.0
- 1% rule +2.5/10.0
- Condition / age +2.5/5.0
- DSCR +2.1/10.0
- Rent growth +1.3/5.0
- Appreciation +0.0/10.0
$275,000
🖨 Deal sheet (PDF) 📄 Offer letter ✓ Due diligence
Listing remarks MLS
SELLER OWNS TWO LOTS THAT ARE SIDE BY SIDE. 3231 & 3233 57TH ST. W. , NICE OPPORTUNITY TO OWN ONE LOT TO BUILD AND SECOND LOT FOR FUTURE USE. 3233 IS AT CORNER OF RUTH AVE N. AND 57TH ST WEST, COME TAKE A LOOK. BUYER WILL NEED TO WALK PROPERTY TO CHECK FOR ANY ENDANGERED SPECIES (GOPHER TURTLES, ETC. ). ENTER AT YOUR OWN RISK. ENTER AT YOUR OWN RISK. AS YOU KNOW UNDERGROUND OIL, GAS AND MINERALS WERE TRANSFERED MANY YEARS AGO IN MOST OF LEHIGH ACRES.
Key facts
- 0.25 acre lot
- 2 garage spots
- Built 2025
Property features AI
Finance
- Financial info: Pets allowed
- HOA & community: Non-gated community; No association fee
Exterior
- Parking: Attached garage; 2 covered garage spaces
- Security: High-impact doors
- Utilities: Septic tank; Well water; Cable not available
- Home design: Single-story; Entry level: 1; New construction; Faces north
- Construction: Block, concrete and stucco construction; Shingle roof
- Exterior features: Security / high-impact doors; Rectangular lot; South exposure; Has a view
Interior
- Kitchen: Dishwasher; Microwave; Range; Refrigerator
- Flooring: Tile
- Bathrooms: 2 full bathrooms
- Heating & cooling: Central heating (electric); Central air conditioning (electric)
- Interior features: Display windows; Impact glass; Dual sinks; Kitchen island; Open living/dining area; Pantry; Shower-only baths; Separate shower(s); Unfurnished
Neighborhood map
What this means for you Summary
Snapshot
- This is a 3-bed/2.0-bath land listed at $275k.
Deal economics
- At list price, monthly cash flow is $-268 ($-3k/yr) — negative.
- To cash-flow at today's rent, offer at most $236k (14.1% below list).
- To meet the 1% rule (rent ≥ 1% of price), the offer needs to be $207k (24.9% below list).
- Recommended offer: $207k (24.9% below list) — sets the bar for 1% rule.
Location & tenants
- Location reads 59/100 on livability (#826 in FL) — a working-class tenant base; expect higher turnover. Strengths: cost of living A+, housing A+; Watch: crime C-, employment D+, amenities F.
- Lee (suburban): math 47% / reading 50% proficiency, ranked #42 of 73 in FL (top 58%) — families likely to look elsewhere, expect single-tenant / working-renter base with shorter leases.
- Zoned schools: Veterans Park Academy For The Arts (math 41% / reading 45%, grade F, #1,366 of 2,144 statewide, top 64%, 2,133 students, 36% FRL); Oak Hammock Middle School (math 43% / reading 41%, grade D-, #340 of 571 statewide, top 61%, 1,563 students, 56% FRL); Lehigh Senior High School (math 23% / reading 45%, grade F, #394 of 667 statewide, top 60%, 2,476 students, 57% FRL).
- Market conditions: Rents falling (-4.7%/yr); 1347 active listings in the ZIP; 40 comparable units currently listed for rent nearby; rentals at typical pace (median 18d on market — plan ~3-4 weeks tenant-placement turnaround); solid renter incomes; 15,411 units permitted in Lee County in 2024 (4,686 in 5+ unit buildings).
- This rent runs 32% of the median local income ($78k/yr) — at the standard rent-burdened threshold; future hikes will face affordability resistance.
Forward outlook
- Local home prices are declining (-3.0%/yr); year-one equity from $2k of loan paydown is wiped out by about $8k of value loss. Plan a longer hold.
- Lee County population projected at +44% by 2050 — long-run rental-demand tailwind backs the buy-and-hold thesis.
Negotiation context
- It's been on market 41 days — a 3% lower offer ($267k) is reasonable based on typical stale-listing flexibility.
- 4 sale attempts since 3y ago with the ask held roughly flat each time — persistent listings suggest the price (not the market) is what's stuck; bring a comps-based counter.
- Current owner paid $23k; list at $275k implies a 1096% gain — meaningful room to come down on a strong offer.
Risks & watch-outs
- Climate carrying-cost: severe wind risk, 99% chance of damaging wind over 30y; extreme-heat days projected 7→27/yr by 2055 (HVAC capex compounding) — expect insurance premiums to compound above CPI over the hold.
Questions for the listing agent
- What do current leases actually rent for vs. the listed asking? Can we see a recent rent roll and the last 12 months of T-12 income?
- It's been on market 41 days. Have you received any prior offers? Is the seller open to a 25% concession, seller financing, or rate buy-down credit?
- Is there a deadline driving the sale (1031 exchange, divorce, estate, relocation)? That informs how much negotiation room exists.
- Schools are D-rated, which usually means shorter tenancies and higher turnover. Who's the typical renter profile here, and what's been the actual vacancy rate?
- The area grade is low — what's the realistic commute time and amenity access for the typical tenant pool here? Any planned neighborhood developments (good or bad) we should know about?
- What's the average days-on-market for RENTAL listings here right now (not sales)? A rising rental-DOM trend means longer vacancies and softer asking-rent achievability than the comps imply.
- What's the recent tenant-quality profile in this submarket — average credit score on applications, eviction rate, late-payment / NSF rate, and stable-employment percentage? A property-management company in the area should have these aggregated.
- How much new for-sale + rental construction is in the pipeline within 1–3 miles? Heavy new supply typically softens prices + rents 12–24 months out; constrained supply supports both.
Investment metrics
- 1% rule
- 0.75% ✗
- Cap rate
- 5.12%
- Cash-on-cash
- -4.18%
- DSCR
- 0.81
- GRM
- 11.1
CMA / ARV
No comps found within radius.
Projected returns pro-forma
-3.0% appreciation · 0.0% rent growth · sell at horizon
- IRR
- -26.7%
- Equity multiple
- 0.12×
- Total profit
- $-67,683
- Equity at exit
- $41,003
- IRR
- -39.0%
- Equity multiple
- -0.35×
- Total profit
- $-104,224
- Equity at exit
- $23,777
Cash invested: $77,000 (down + closing). Projections, not guarantees.
Landlord ↔ Tenant lean methodology
- Overall (STATE)
- 87 Strongly Landlord-Friendly
- State Florida
- 87 Strongly Landlord-Friendly · R+3
- County
- — inherits STATE
- City
- — inherits STATE
ZIP-level market 33971
- Home prices YoY
- -8.0%
- Rents YoY
- -4.7%
- Active inventory
- 1347
- Price-to-rent
- 11.1×
Monthly cashflow live
- Estimated rent
- $2,066 high interval (Pro) →
- Mortgage (P&I)
- −$1,442
- Tax est. 1.5%
- −$344 /mo · $4,125/yr
- Insurance
- −$115
- HOA
- −$0
- Vacancy / Maint / Mgmt
- −$434
- Net cashflow
- $-268
Break-even live
Sensitivity live
| Price | -10% $-78 | -5% $-173 | +0% $-268 | +5% $-363 | +10% $-459 |
|---|---|---|---|---|---|
| Rent | -10% $-432 | -5% $-350 | +0% $-268 | +5% $-187 | +10% $-105 |
| Rate | -1.0pp $-130 | -0.5pp $-199 | base $-268 | +0.5pp $-340 | +1.0pp $-412 |
UW: 25.0% down · 7.5% · 30yr · 1.5% tax · 5.0% vac · 8.0% maint · 8.0% mgmt
Financing live
Cash to close
- Down payment
- $68,750
- Closing costs
- $8,250
- Reserves months
- —
- Total cash needed
- —
Loan-product check · same deal, 3 products live
Conventional
25% down · 7.5% · 30yr
- Down + closing
- —
- Monthly P&I
- —
- Monthly cashflow
- —
- DSCR
- —
- Eligible?
- —
Personal DTI + credit; lowest rate.
DSCR
20% down · 8.5% · 30yr
- Down + closing
- —
- Monthly P&I
- —
- Monthly cashflow
- —
- DSCR
- —
- Eligible?
- —
No personal income docs; deal must DSCR.
Hard money
10% down · 12.0% · 12mo
- Down + closing
- —
- Monthly P&I
- —
- Monthly cashflow
- —
- DSCR
- —
- Eligible?
- —
Short-term bridge; refi at stabilization.
Rent comps 40 comps
| Address | Beds | Baths | Sqft | Rent | $/sqft | DOM | Units | Dist |
|---|---|---|---|---|---|---|---|---|
| 3302 56th St W Lehigh Acres, FL | 2.0 | 2.0 | 1032 | $1,775 | $1.72 | 18d | 1 | 0.06mi |
| 3306 56th St W #1 Lehigh Acres, FL | 4.0 | 2.0 | 1534 | $2,099 | $1.37 | 23d | 1 | 0.09mi |
| 3201 57th St W Lehigh Acres, FL | 3.0 | 2.0 | 1630 | $2,100 | $1.29 | 25d | 1 | 0.21mi |
| 5901 Rita Ave N Lehigh Acres, FL | 3.0 | 2.0 | 1324 | $2,000 | $1.51 | 25d | 1 | 0.24mi |
| 3103 58th St W Lehigh Acres, FL | 3.0 | 2.0 | 1310 | $1,800 | $1.37 | 5d | 1 | 0.34mi |
| 3213 51st St W Lehigh Acres, FL | 3.0 | 2.0 | 1654 | $2,250 | $1.36 | 4d | 1 | 0.37mi |
| 3304 49th St W Lehigh Acres, FL | 3.0 | 2.0 | 1399 | $2,340 | $1.67 | 4d | 1 | 0.44mi |
| 3202 61st St W Lehigh Acres, FL | 3.0 | 2.0 | 1777 | $1,800 | $1.01 | 25d | 1 | 0.46mi |
| 2910 57th St W Lehigh Acres, FL | 3.0 | 2.0 | 1550 | $1,805 | $1.16 | 4d | 1 | 0.52mi |
| 3012 51st St W Lehigh Acres, FL | 3.0 | 2.0 | 1551 | $1,599 | $1.03 | 18d | 1 | 0.52mi |
| 3601 57th St W Lehigh Acres, FL | 3.0 | 2.0 | 1458 | $1,850 | $1.27 | 5d | 1 | 0.53mi |
| 3512 50th St W Lehigh Acres, FL | 3.0 | 2.0 | 1615 | $1,995 | $1.24 | 16d | 1 | 0.54mi |
| 3016 62nd St W Lehigh Acres, FL | 4.0 | 2.0 | 1389 | $1,750 | $1.26 | 23d | 1 | 0.62mi |
| 3214 65th St W Lehigh Acres, FL | 4.0 | 2.0 | 1209 | $1,625 | $1.34 | 25d | 1 | 0.68mi |
| 3013 64th St W Lehigh Acres, FL | 3.0 | 2.0 | 1389 | $1,750 | $1.26 | 25d | 1 | 0.70mi |
| 2910 61st St W Lehigh Acres, FL | 4.0 | 2.0 | 1810 | $1,915 | $1.06 | 4d | 1 | 0.73mi |
| 2910 61st St W Lehigh Acres, FL | 4.0 | 2.0 | 1810 | $2,095 | $1.16 | 23d | 1 | 0.73mi |
| 3208 66th St W Lehigh Acres, FL | 4.0 | 2.0 | 1800 | $2,100 | $1.17 | 13d | 1 | 0.75mi |
| 3105 66th St W Lehigh Acres, FL | 3.0 | 2.0 | 1615 | $2,000 | $1.24 | 25d | 1 | 0.77mi |
| 2713 56th St W Lehigh Acres, FL | 3.0 | 2.0 | 1606 | $2,100 | $1.31 | 23d | 1 | 0.83mi |
| 3505 67th St W Lehigh Acres, FL | 4.0 | 2.0 | 1389 | $1,799 | $1.30 | 18d | 1 | 0.83mi |
| 3000 66th St W Lehigh Acres, FL | 2.0 | 2.0 | 1032 | $1,775 | $1.72 | 18d | 1 | 0.88mi |
| 3301 69th St W Lehigh Acres, FL | 2.0 | 2.0 | 968 | $1,350 | $1.39 | 16d | 1 | 0.89mi |
| 3404 68th St W Lehigh Acres, FL | 3.0 | 2.0 | 1458 | $1,855 | $1.27 | 5d | 1 | 0.89mi |
| 3406 68th St W Lehigh Acres, FL | 3.0 | 2.0 | 1472 | $1,875 | $1.27 | 5d | 1 | 0.90mi |
| 2906 65th St W Lehigh Acres, FL | 3.0 | 2.0 | 1310 | $2,175 | $1.66 | 25d | 1 | 0.91mi |
| 6016 Lindbrook Ave Fort Myers, FL | 3.0 | 2.0 | 1422 | $1,800 | $1.27 | 23d | 1 | 0.97mi |
| 4626 Ida Ave N Lehigh Acres, FL | 3.0 | 2.0 | 1615 | $2,000 | $1.24 | 18d | 1 | 1.00mi |
| 6048 Stratton Rd Fort Myers, FL | 3.0 | 2.0 | 1635 | $2,200 | $1.35 | 5d | 1 | 1.00mi |
| 2906 68th St W Lehigh Acres, FL | 3.0 | 2.0 | 1239 | $1,875 | $1.51 | 25d | 1 | 1.00mi |
| 6050 Stratton Rd Fort Myers, FL | 3.0 | 2.0 | 1635 | $2,200 | $1.35 | 5d | 1 | 1.01mi |
| 2800 47th St W Lehigh Acres, FL | 3.0 | 2.0 | 1370 | $2,000 | $1.46 | 25d | 1 | 1.02mi |
| 3113 71st St W Lehigh Acres, FL | 3.0 | 2.0 | 1100 | $1,760 | $1.60 | 5d | 1 | 1.04mi |
| 2804 67th St Lehigh Acres, FL | 3.0 | 2.0 | 1055 | $1,699 | $1.61 | 4d | 1 | 1.12mi |
| 6108 Stratton Rd Fort Myers, FL | 3.0 | 2.0 | 1635 | $2,200 | $1.35 | 5d | 1 | 1.13mi |
| 6006 Dora Ave N Lehigh Acres, FL | 3.0 | 2.0 | 1272 | $2,061 | $1.62 | 4d | 1 | 1.14mi |
| 2617 49th St W Lehigh Acres, FL | 2.0 | 2.0 | 968 | $1,499 | $1.55 | 25d | 1 | 1.15mi |
| 3005 41st St W Lehigh Acres, FL | 3.0 | 2.0 | 1853 | $2,250 | $1.21 | 25d | 1 | 1.15mi |
| 2808 44th St W Lehigh Acres, FL | 4.0 | 2.0 | 1800 | $1,745 | $0.97 | 25d | 1 | 1.16mi |
| 2613 62nd St W Lehigh Acres, FL | 3.0 | 2.0 | 1060 | $1,900 | $1.79 | 25d | 1 | 1.16mi |
Listing history 18 events
-
2026-06-07status $275,000 Pending 41 DOM
-
2026-06-03days on market $275,000 Active 41 DOM
-
2026-06-02days on market $275,000 Active 40 DOM
-
2026-06-01days on market $275,000 Active 39 DOM
-
2026-05-31days on market $275,000 Active 38 DOM
-
2026-05-20price $275,000
-
2026-04-23$280,000 Active
-
2026-04-16historical
-
2026-03-14price $280,000
-
2025-12-17price $285,000
-
2025-10-15$290,000 Active
-
2024-08-28soldstatus $23,000
-
2024-08-26soldstatus $23,000 Closed 460-char remark
Show marketing remark (460 chars)
SELLER OWNS TWO LOTS THAT ARE SIDE BY SIDE. 3231 & 3233 57TH ST. W. , NICE OPPORTUNITY TO OWN ONE LOT TO BUILD AND SECOND LOT FOR FUTURE USE. 3233 IS AT CORNER OF RUTH AVE N. AND 57TH ST WEST, COME TAKE A LOOK. BUYER WILL NEED TO WALK PROPERTY TO CHECK FOR ANY ENDANGERED SPECIES (GOPHER TURTLES, ETC. ). ENTER AT YOUR OWN RISK. ENTER AT YOUR OWN RISK. AS YOU KNOW UNDERGROUND OIL, GAS AND MINERALS WERE TRANSFERED MANY YEARS AGO IN MOST OF LEHIGH ACRES.
-
2024-08-04status Pending 460-char remark
Show marketing remark (460 chars)
SELLER OWNS TWO LOTS THAT ARE SIDE BY SIDE. 3231 & 3233 57TH ST. W. , NICE OPPORTUNITY TO OWN ONE LOT TO BUILD AND SECOND LOT FOR FUTURE USE. 3233 IS AT CORNER OF RUTH AVE N. AND 57TH ST WEST, COME TAKE A LOOK. BUYER WILL NEED TO WALK PROPERTY TO CHECK FOR ANY ENDANGERED SPECIES (GOPHER TURTLES, ETC. ). ENTER AT YOUR OWN RISK. ENTER AT YOUR OWN RISK. AS YOU KNOW UNDERGROUND OIL, GAS AND MINERALS WERE TRANSFERED MANY YEARS AGO IN MOST OF LEHIGH ACRES.
-
2024-07-30$24,500 Active 460-char remark
Show marketing remark (460 chars)
SELLER OWNS TWO LOTS THAT ARE SIDE BY SIDE. 3231 & 3233 57TH ST. W. , NICE OPPORTUNITY TO OWN ONE LOT TO BUILD AND SECOND LOT FOR FUTURE USE. 3233 IS AT CORNER OF RUTH AVE N. AND 57TH ST WEST, COME TAKE A LOOK. BUYER WILL NEED TO WALK PROPERTY TO CHECK FOR ANY ENDANGERED SPECIES (GOPHER TURTLES, ETC. ). ENTER AT YOUR OWN RISK. ENTER AT YOUR OWN RISK. AS YOU KNOW UNDERGROUND OIL, GAS AND MINERALS WERE TRANSFERED MANY YEARS AGO IN MOST OF LEHIGH ACRES.
-
2024-01-18status Pending
-
2024-01-18historical
-
2023-12-18$18,900 Active
ⓘ Source: listings_history table (triggers on properties + properties_extension) + one-shot
backfill from property_details.listing_events for pre-trigger history.
Climate risk First Street
- Flood 1/10 Low FEMA zone X (unshaded) · 0% chance over 30 yrs
- Wildfire 3/10 Moderate
- Heat 9/10 Extreme 7 d/yr ≥108°F today · 27 d/yr by 30 yrs out
- Wind 10/10 Extreme 99% chance of damaging wind over 30 yrs
- Air quality 2/10 Low 1 unhealthy d/yr today · 1 by 30 yrs out
Nearby sold comps map
Loading sold comps map…
Walkable amenities ~0.75 mi
Loading nearby amenities…
Taxation est. · year 1
- Rental income
- $24,790
- − Mortgage interest
- −$15,404
- − Property taxes
- −$4,125
- − Insurance
- −$1,375
- − Repairs & maintenance
- −$1,983
- − Management
- −$1,983
- − Depreciation
- −$8,000
- Taxable loss
- −$8,081
- Est. tax savings @ 24.0%
- +$1,939
- After-tax cash flow
- $-1,282/yr
For passive investors: Depreciation is non-cash, so a rental often shows a tax loss while cash-flowing — sheltering income. Rental losses are passive: they offset passive income freely, and up to $25,000/yr can offset ordinary (W-2) income if you actively participate and your MAGI is under $100k (phasing out to $0 by $150k); unused losses carry forward. On sale, claimed depreciation is recaptured at up to 25%, and gains may owe capital-gains tax (a 1031 exchange can defer both). Figures are a year-1 estimate at your 24.0% rate — not tax advice; consult a CPA.
Schools (NCES district)
- District
- Lee
- NCES district ID
- 1201080
- Math proficiency
- 47% ▼ -11.00%
- Reading proficiency
- 50% ▼ -4.00%
- Median HH income
- $49,518
- Composite
- 41.49/100
- National rank
- #3458
- State rank
- #42 of 73 in FL
Livability — Lehigh Acres
- Score
- 59/100
- State rank
- #826
- US rank
- #20055
Category grades
Schools grade is shown separately in the Schools card above.
Census & demographics
- Census place
- Lehigh Acres, FL
- County
- Lee County · 788,662 people
- City population
- 130,638
- Metro
- Cape Coral-Fort Myers, FL
- Population (ZIP)
- 30,790
- Household income
- $77,723
- Rent vs Own
- Severe rent burden
- 587.0
Population outlook (Lee County) Hauer SSP2
- Today (2025)
- 871,946 people
- By 2030
- 955,468 · +9.6%
- By 2040
- 1,113,587 · +27.7%
- By 2050
- 1,256,891 · +44.1%
- By 2075
- 1,560,270 · +78.9%
- By 2100
- 1,726,848 · +98.0%
Race, ethnicity, and origin ACS 2023
- Neighborhood character
- Diverse neighborhood (Simpson 0.65)
- Race & ethnicity
- Hispanic / Latino 49% Two or more races 32% White 26% Black 19% Asian 2%
- Hispanic origin (detail)
- Mexican 9% Puerto Rican 13% Cuban 14% Dominican 2%
- Common ancestry
- Hispanic 7% Estonian 1% Romanian 1%
- Foreign-born
- 31% · Canada, Vietnam, Guatemala
- Languages at home
- 46% English-only · Spanish 41% French/Haitian/Cajun 9% Other Indo-European 2%
Political lean MEDSL · Lee
- 2024 margin
- Strong R (+28.4) · D 35.5% · R 63.9%
- 2008→2024 swing
- -18.0pp toward R · 2008: -10.4pp · 2024: -28.4pp
- All cycles
- 2024: R+28.4 2020: R+19.2 2016: R+20.4 2012: R+16.6 2008: R+10.4
Not yet ingested
- Civics
- —
Market trends
- HPI YoY
- ▼ -27.68%
- Current HPI
- 317.7147
- Rent YoY
- ▼ -4.69%
- Metro
- Cape Coral-Fort Myers, FL
- State GDP YoY
- ▲ 3.28%
- F500 in state
- 36
Industry mix (Fortune 500 HQ in FL)
| Industry | F500 HQs | Revenue |
|---|---|---|
| Industrial Technology | 2 | $29B |
|
||
| Insurance | 2 | $17B |
|
||
| Retail | 1 | $60B |
|
||
| Technology Distribution | 1 | $58B |
|
||
| Homebuilding | 1 | $35B |
|
||
| Technology Manufacturing | 1 | $35B |
|
||
Price history
+1355.0% since first listed13 events — show timeline
- 2026-05-20 Price Changed $275,000 FORTMLS
- 2026-04-23 Listed $280,000 FORTMLS
- 2026-04-16 Listing Removed — FORTMLS
- 2026-03-14 Price Changed $280,000 FORTMLS
- 2025-12-17 Price Changed $285,000 FORTMLS
- 2025-10-15 Listed $290,000 FORTMLS
- 2024-08-28 Sold (Public Records) $23,000 Public Records
- 2024-08-26 Sold (MLS) $23,000 FORTMLS
- 2024-08-04 Pending — FORTMLS
- 2024-07-30 Listed $24,500 FORTMLS
- 2024-01-18 Pending — FORTMLS
- 2024-01-18 Listing Removed — FORTMLS
- 2023-12-18 Listed $18,900 FORTMLS
Property tax history
+19.5%/yrLatest (2025): $455 · +29.4% YoY. Source: county tax records.
Cash-flow waterfall
monthlySold comps — $/sqft
last 12 mo · ≤1 miLoading sold comps…