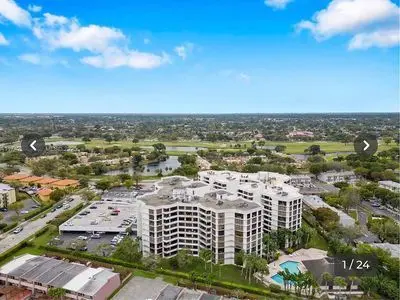
13953 Kendale Lakes Cir · Kendale Lakes, FL
Flood risk No data
- FEMA flood zone
- —
- Chance of flooding over 30 yrs
- —
- Est. flood insurance / yr
- —
Fire risk No data
- Est. fire insurance / yr
- —
Heat risk No data
- Hot days now (above threshold)
- —
- Hot days in 30 yrs
- —
Wind risk No data
- Chance of severe wind over 30 yrs
- —
Air-quality risk No data
- Unhealthy air days now
- —
- Unhealthy air days in 30 yrs
- —
Risk factors via First Street. Map © Google.
Why this score? — see what drove the F grade
The composite is a weighted blend of 9 inputs, each scored 0–100. Each bar is that input's sub-score; the figure is the points it added to the 100-point composite (weight × sub-score).
- ARV discount +7.5/15.0
- 1% rule +5.1/10.0
- Cash flow +4.8/30.0
- Schools +4.2/10.0
- Condition / age +4.0/5.0
- Livability +3.9/5.0
- Rent growth +2.5/5.0
- DSCR +0.0/10.0
- Appreciation +0.0/10.0
$285,000
🖨 Deal sheet (PDF) 📄 Offer letter ✓ Due diligence
Listing remarks
& acirc; & euro; & cent; Spacious Family Condo in the Heart of Kendall & acirc; & euro; & ldquo; Owner Direct & acirc; & euro; & cent; Rare opportunity to own a beautifully maintained and exceptionally spacious condo in one of Kendall & acirc; & euro; & trade; s most peaceful and family-friendly communities. This warm and welcoming home features oversized living areas, large bedrooms, abundant natural light, and a spacious private balcony perfect for relaxing and enjoying the peaceful surroundings. Features Include: & acirc; & euro; & cent; Very spacious layout & acirc; & euro; & cent; Large private balcony &
Key facts
- Secure building
- Private balcony
- Kendall location
Tags
Property features AI
Exterior
- Home design: Built in 1973
- Construction: Living area approximately 1,850
- Exterior features: Located in the West End subdivision
Neighborhood map
What this means for you Summary
Snapshot
- This is a 2-bed/2.0-bath condo listed at $285k. Condition is rated good.
Deal economics
- At list price, monthly cash flow is $-695 ($-8k/yr) — negative.
- The deal already cash-flows at list — no discount required.
- Meets the 1% rule at list price ($3k rent vs $285k).
- Recommended offer: $281k (1.5% below list) — sets the bar for market timing.
Location & tenants
- Location reads 77/100 on livability (#186 in FL, #2,923 nationally) — a middle-class / working-renter tenant base. Strengths: housing A+, crime A-, commute B+; Watch: amenities F.
- Miami-Dade (suburban): math 45% / reading 54% proficiency, ranked #40 of 73 in FL (top 55%) — families likely to look elsewhere, expect single-tenant / working-renter base with shorter leases; 64% free/reduced lunch — lower-income household profile, screen leases tightly.
- Zoned schools: Bent Tree Elementary School (math 57% / reading 67%, grade B, #608 of 2,144 statewide, top 29%, 395 students, 60% FRL); Howard D. Mcmillan Middle School (math 54% / reading 61%, grade B, #157 of 571 statewide, top 28%, 865 students, 60% FRL); Miami Sunset Senior High School (math 30% / reading 42%, grade F, #359 of 667 statewide, top 55%, 1,062 students, 54% FRL).
- Market conditions: Rents soft (-0.1%/yr); 186 active listings in the ZIP; 40 comparable units currently listed for rent nearby; rentals leasing fast (median 10d on market — plan ~1-2 weeks tenant-placement turnaround); 10,051 units permitted in Miami-Dade County in 2024 (7,758 in 5+ unit buildings).
- At $2,872/mo this rent would consume 49% of the median local household income ($70k/yr) (locally 1416% of renters already pay >50% of income on rent) — very limited rent-growth headroom before tenants either downsize or default.
Forward outlook
- Local home prices are declining (-3.0%/yr); year-one equity from $2k of loan paydown is wiped out by about $9k of value loss. Plan a longer hold.
- Miami-Dade County population projected at +28% by 2050 — long-run rental-demand tailwind backs the buy-and-hold thesis.
Negotiation context
- It's been on market 29 days — a 2% lower offer ($281k) is reasonable based on typical stale-listing flexibility.
- 2 sale attempts with the ask held roughly flat each time — persistent listings suggest the price (not the market) is what's stuck; bring a comps-based counter.
Risks & watch-outs
- Watch-outs: HOA is 35% of rent.
Questions for the listing agent
- What do current leases actually rent for vs. the listed asking? Can we see a recent rent roll and the last 12 months of T-12 income?
- Built in 1973 — when were the roof, HVAC, electrical panel, plumbing, and water heater last replaced?
- What does the HOA fee cover, when was the last increase, and are there any pending special assessments or reserve-fund shortfalls?
- Any open or pending special assessments — roof, HVAC, plumbing, elevator, façade? What's the per-unit balance and payoff schedule, and is the seller paying it off at close or rolling it to the buyer?
- Is there a deadline driving the sale (1031 exchange, divorce, estate, relocation)? That informs how much negotiation room exists.
- Schools are A-rated — typically a magnet for longer-tenancy family renters. What's the average tenant stay here, and is there a school-zone premium baked into asking?
- The area grade is low — what's the realistic commute time and amenity access for the typical tenant pool here? Any planned neighborhood developments (good or bad) we should know about?
- What's the average days-on-market for RENTAL listings here right now (not sales)? A rising rental-DOM trend means longer vacancies and softer asking-rent achievability than the comps imply.
- What's the recent tenant-quality profile in this submarket — average credit score on applications, eviction rate, late-payment / NSF rate, and stable-employment percentage? A property-management company in the area should have these aggregated.
- How much new apartment / multifamily construction is in the pipeline within 1–3 miles? Heavy new supply (>2% of stock underway) typically softens rents 12–24 months out; light construction supports rent growth.
Investment metrics
- 1% rule
- 1.01% ✓
- Cap rate
- 3.37%
- Cash-on-cash
- -10.45%
- DSCR
- 0.53
- GRM
- 8.3
CMA / ARV
No comps found within radius.
Projected returns pro-forma
-3.0% appreciation · 0.0% rent growth · sell at horizon
- IRR
- -40.8%
- Equity multiple
- -0.23×
- Total profit
- $-98,212
- Equity at exit
- $42,494
- IRR
- —
- Equity multiple
- -1.16×
- Total profit
- $-172,388
- Equity at exit
- $24,642
Cash invested: $79,800 (down + closing). Projections, not guarantees.
Landlord ↔ Tenant lean methodology
- Overall (STATE)
- 87 Strongly Landlord-Friendly
- State Florida
- 87 Strongly Landlord-Friendly · R+3
- County
- — inherits STATE
- City
- — inherits STATE
ZIP-level market 33183
- Rents YoY
- -0.1%
- Active inventory
- 186
- Price-to-rent
- 8.3×
Monthly cashflow live
- Estimated rent
- $2,872 high interval (Pro) →
- Mortgage (P&I)
- −$1,495
- Tax est. 1.5%
- −$356 /mo · $4,275/yr
- Insurance
- −$119
- HOA est. from 2 same-building comps
- −$994
- Lot rent
- −$0
- Vacancy / Maint / Mgmt
- −$603
- Net cashflow
- $-695
Break-even live
Sensitivity live
| Price | -10% $-498 | -5% $-597 | +0% $-695 | +5% $-794 | +10% $-892 |
|---|---|---|---|---|---|
| Rent | -10% $-922 | -5% $-808 | +0% $-695 | +5% $-582 | +10% $-468 |
| Rate | -1.0pp $-552 | -0.5pp $-623 | base $-695 | +0.5pp $-769 | +1.0pp $-844 |
UW: 25.0% down · 7.5% · 30yr · 1.5% tax · 5.0% vac · 8.0% maint · 8.0% mgmt
Financing live
Cash to close
- Down payment
- $71,250
- Closing costs
- $8,550
- Reserves months
- —
- Total cash needed
- —
Loan-product check · same deal, 3 products live
Conventional
25% down · 7.5% · 30yr
- Down + closing
- —
- Monthly P&I
- —
- Monthly cashflow
- —
- DSCR
- —
- Eligible?
- —
Personal DTI + credit; lowest rate.
DSCR
20% down · 8.5% · 30yr
- Down + closing
- —
- Monthly P&I
- —
- Monthly cashflow
- —
- DSCR
- —
- Eligible?
- —
No personal income docs; deal must DSCR.
Hard money
10% down · 12.0% · 12mo
- Down + closing
- —
- Monthly P&I
- —
- Monthly cashflow
- —
- DSCR
- —
- Eligible?
- —
Short-term bridge; refi at stabilization.
Rent comps 40 comps
| Address | Beds | Baths | Sqft | Rent | $/sqft | DOM | Units | Dist |
|---|---|---|---|---|---|---|---|---|
| 6224 SW 139th Ave Miami, FL | 3.0 | 2.5 | 1308 | $3,100 | $2.37 | 26d | 1 | 0.06mi |
| 6350 SW 139th Ave Unit 6350 Miami, FL | 3.0 | 2.0 | 1308 | $2,900 | $2.22 | 26d | 1 | 0.14mi |
| 6350 SW 139th Ct Miami, FL | 2.0 | 2.5 | 1440 | $2,800 | $1.94 | 26d | 1 | 0.16mi |
| 14145 SW Kendale Lakes Cir Miami, FL | 2.0 | 2.5 | 1440 | $2,950 | $2.05 | 1d | 1 | 0.18mi |
| 14145 SW Kendale Lakes Cir Miami, FL | 2.0 | 2.5 | 1440 | $2,850 | $1.98 | 26d | 1 | 0.18mi |
| 6326 SW 139th Ct Unit 6326 Miami, FL | 3.0 | 2.0 | 1628 | $3,000 | $1.84 | 26d | 1 | 0.20mi |
| 14277 Kendale Lakes Cir Miami, FL | 3.0 | 2.5 | 1934 | $2,925 | $1.51 | 1d | 1 | 0.23mi |
| 13953 Kendale Lakes Cir Unit 608B Miami, FL | 3.0 | 2.5 | 1848 | $2,800 | $1.52 | 1d | 1 | 0.25mi |
| 13953 Kendale Lakes Cir Unit 608B Miami, FL | 3.0 | 2.5 | 1848 | $3,000 | $1.62 | 26d | 1 | 0.25mi |
| 14235 SW 57th Ln Miami, FL | 3.0 | 2.5 | 1300 | $2,799 | $2.15 | 26d | 1 | 0.30mi |
| 14205 SW 57th Ln Unit 6-A-6 Miami, FL | 3.0 | 2.5 | 1300 | $2,750 | $2.12 | 24d | 1 | 0.31mi |
| 6653 SW 140th Ave Unit 6653 Miami, FL | 3.0 | 2.5 | 1592 | $3,500 | $2.20 | 1d | 1 | 0.34mi |
| 14245 SW 57th Ln Unit 9-5 Miami, FL | 3.0 | 3.0 | 1561 | $3,250 | $2.08 | 26d | 1 | 0.35mi |
| 13700 SW 62nd St #204 Miami, FL | 3.0 | 2.0 | 1262 | $2,600 | $2.06 | 5d | 1 | 0.36mi |
| 13700 SW 62nd St Miami, FL | 3.0 | 2.0 | 1262 | $2,838 | $2.25 | 26d | 3 | 0.36mi |
| 5801 SW 144th Circle Pl Unit 5801 Miami, FL | 3.0 | 2.0 | 1337 | $3,000 | $2.24 | 7d | 1 | 0.39mi |
| 14272 SW 52nd St Miami, FL | 3.0 | 2.0 | 2164 | $1,250 | $0.58 | 23d | 1 | 0.50mi |
| 13520 SW 64th Ln Unit 13522 Miami, FL | 3.0 | 2.0 | 1227 | $3,200 | $2.61 | 5d | 1 | 0.58mi |
| 5274 SW 145th Ave Unit Na Miami, FL | 3.0 | 2.0 | 1547 | $3,200 | $2.07 | 10d | 1 | 0.62mi |
| 6526 Kendale Lakes Dr #1405 Miami, FL | 3.0 | 3.0 | 1770 | $2,950 | $1.67 | 4d | 1 | 0.67mi |
| 6526 Kendale Lakes Dr Miami, FL | 3.0 | 2.0 | 1770 | $3,150 | $1.78 | 1d | 1 | 0.67mi |
| 13404 SW 62nd St Unit 110L Miami, FL | 3.0 | 2.5 | 1360 | $2,950 | $2.17 | 26d | 1 | 0.68mi |
| 14770 SW 60th St Miami, FL | 3.0 | 2.0 | 1322 | $3,000 | $2.27 | 7d | 1 | 0.70mi |
| 5852 SW 147th Pl Miami, FL | 2.0 | 1.0 | 1605 | $1,800 | $1.12 | 26d | 1 | 0.72mi |
| 13330 SW 59th Ter Miami, FL | 3.0 | 2.0 | 1258 | $2,800 | $2.23 | 1d | 1 | 0.73mi |
| 13330 SW 59th Ter Miami, FL | 3.0 | 2.0 | 1258 | $2,800 | $2.23 | 7d | 1 | 0.73mi |
| 6841 SW 147th Ave Unit 2H Miami, FL | 3.0 | 2.0 | 1700 | $3,000 | $1.76 | 26d | 1 | 0.80mi |
| 6801 SW 147th Ave Unit 2D Miami, FL | 3.0 | 2.0 | 1700 | $2,700 | $1.59 | 5d | 1 | 0.80mi |
| 5931 SW 148th Pl Unit 1 Miami, FL | 1.0 | 1.0 | 1891 | $1,300 | $0.69 | 5d | 1 | 0.84mi |
| 6911 SW 147th Ave Miami, FL | 3.0 | 2.0 | 1700 | $2,600 | $1.53 | 26d | 1 | 0.84mi |
| 5725 SW 132nd Ct Miami, FL | 3.0 | 2.5 | 1560 | $3,250 | $2.08 | 26d | 1 | 0.90mi |
| 5725 SW 132nd Ct Unit 21-5 Miami, FL | 3.0 | 2.5 | 1560 | $3,200 | $2.05 | 1d | 1 | 0.90mi |
| 13780 SW 74th St Miami, FL | 3.0 | 2.0 | 1273 | $3,800 | $2.99 | 26d | 1 | 0.96mi |
| 14979 SW 63rd St Miami, FL | 3.0 | 2.0 | 1602 | $3,081 | $1.92 | 10d | 1 | 0.99mi |
| 14979 SW 63rd St Miami, FL | 3.0 | 2.0 | 1602 | $3,015 | $1.88 | 5d | 1 | 0.99mi |
| 6140 SW 129th Pl #2007 Miami, FL | 3.0 | 2.5 | 1355 | $2,600 | $1.92 | 17d | 1 | 1.03mi |
| 4530 SW 143rd Pl Miami, FL | 3.0 | 2.0 | 1346 | $3,450 | $2.56 | 5d | 1 | 1.04mi |
| 4530 SW 143rd Pl Miami, FL | 3.0 | 2.0 | 1346 | $3,450 | $2.56 | 16d | 1 | 1.04mi |
| 4526 SW 143rd Ct W Miami, FL | 3.0 | 2.0 | 1636 | $3,100 | $1.89 | 10d | 1 | 1.06mi |
| 4526 SW 143rd Ct W Miami, FL | 3.0 | 2.0 | 1636 | $3,100 | $1.89 | 5d | 1 | 1.06mi |
HOA detail condo
- Monthly dues
- $0 · $0/yr
- Assessments
- None detected in remarks — confirm with the listing agent.
Listing history 14 events
-
2026-06-16days on market $285,000 Active 29 DOM
-
2026-06-15days on market $285,000 Active 28 DOM
-
2026-06-13days on market $285,000 Active 26 DOM
-
2026-06-09days on market $285,000 Active 22 DOM
-
2026-06-08days on market $285,000 Active 21 DOM
-
2026-06-08days on market $285,000 Active 20 DOM
-
2026-06-04days on market $285,000 Active 17 DOM
-
2026-06-03days on market $285,000 Active 16 DOM
-
2026-06-02days on market $285,000 Active 15 DOM
-
2026-06-01days on market $285,000 Active 14 DOM
-
2026-05-31days on market $285,000 Active 13 DOM
-
2026-05-25historical $3,300
-
2026-05-19$285,000 Active
-
2026-03-14$3,300
ⓘ Source: listings_history table (triggers on properties + properties_extension) + one-shot
backfill from property_details.listing_events for pre-trigger history.
Nearby sold comps map
Loading sold comps map…
Walkable amenities ~0.75 mi
Loading nearby amenities…
Taxation est. · year 1
- Rental income
- $34,458
- − Mortgage interest
- −$15,964
- − Property taxes
- −$4,275
- − Insurance
- −$1,425
- − Repairs & maintenance
- −$2,757
- − Management
- −$2,757
- − HOA
- −$11,928
- − Depreciation
- −$8,291
- Taxable loss
- −$12,938
- Est. tax savings @ 24.0%
- +$3,105
- After-tax cash flow
- $-5,235/yr
For passive investors: Depreciation is non-cash, so a rental often shows a tax loss while cash-flowing — sheltering income. Rental losses are passive: they offset passive income freely, and up to $25,000/yr can offset ordinary (W-2) income if you actively participate and your MAGI is under $100k (phasing out to $0 by $150k); unused losses carry forward. On sale, claimed depreciation is recaptured at up to 25%, and gains may owe capital-gains tax (a 1031 exchange can defer both). Figures are a year-1 estimate at your 24.0% rate — not tax advice; consult a CPA.
Condition & rehab AI · 1 photo
This well-maintained and spacious condo in Kendall is ready for immediate occupancy and can be enhanced with minor updates to boost its value.
Value-add opportunities
- Both Painting — Fresh paint can enhance curb appeal and interior aesthetics
- Both Lighting — Upgrading lighting can improve the home's ambiance and safety
- Both Window treatments — New window treatments can add style and privacy
- Both Kitchen appliances — Modern appliances can increase the home's appeal and functionality
- Both Bathroom fixtures — Updated fixtures can enhance the bathroom's functionality and style
Renovation cost estimate screening
Value-add ROI direction
- Both Painting — Fresh paint can enhance curb appeal and interior aesthetics ↑
- Both Lighting — Upgrading lighting can improve the home's ambiance and safety ↑
- Both Window treatments — New window treatments can add style and privacy ↑
- Both Kitchen appliances — Modern appliances can increase the home's appeal and functionality ↑
- Both Bathroom fixtures — Updated fixtures can enhance the bathroom's functionality and style ↑
ⓘ Cost ranges are severity-bucket heuristics (US national rule-of-thumb). Get contractor quotes + a written scope before underwriting a rehab budget.
Schools (NCES district)
- District
- Miami-Dade
- NCES district ID
- 1200390
- Math proficiency
- 45% ▼ -16.00%
- Reading proficiency
- 54% ▼ -5.00%
- Median HH income
- $43,928
- Composite
- 41.76/100
- National rank
- #3397
- State rank
- #40 of 73 in FL
Livability — Kendale Lakes
- Score
- 77/100
- State rank
- #186
- US rank
- #2923
Category grades
Schools grade is shown separately in the Schools card above.
Census & demographics
- Census place
- Kendale Lakes, FL
- County
- Miami-Dade County · 2,697,751 people
- City population
- 33,811
- Metro
- Miami-Fort Lauderdale-Pompano Beach, FL
- Population (ZIP)
- 33,527
- Household income
- $70,218
- Rent vs Own
- Severe rent burden
- 1416.0
Population outlook (Miami-Dade County) Hauer SSP2
- Today (2025)
- 3,126,439 people
- By 2030
- 3,325,765 · +6.4%
- By 2040
- 3,697,561 · +18.3%
- By 2050
- 4,012,134 · +28.3%
- By 2075
- 4,605,612 · +47.3%
- By 2100
- 4,866,598 · +55.7%
Race, ethnicity, and origin ACS 2023
- Neighborhood character
- Predominantly Hispanic (84%)
- Race & ethnicity
- Hispanic / Latino 84% Two or more races 52% White 13% Black 1% Asian 1%
- Hispanic origin (detail)
- Mexican 1% Puerto Rican 2% Cuban 53% Dominican 1%
- Common ancestry
- Romanian 1%
- Foreign-born
- 63% · Canada, Jamaica
- Languages at home
- 15% English-only · Spanish 83% French/Haitian/Cajun 1% Other Indo-European 1%
Political lean MEDSL · Miami-Dade
- 2024 margin
- R (+11.4) · D 43.9% · R 55.4%
- 2008→2024 swing
- -27.6pp toward R · 2008: 16.1pp · 2024: -11.4pp
- All cycles
- 2024: R+11.4 2020: D+7.3 2016: D+29.6 2012: D+23.7 2008: D+16.1
Not yet ingested
- Civics
- —
Market trends
- HPI YoY
- ▼ -331.51%
- Current HPI
- 385.8798
- Rent YoY
- ▼ -0.10%
- Metro
- Miami-Fort Lauderdale-Pompano Beach, FL
- State GDP YoY
- ▲ 3.28%
- F500 in state
- 36
Industry mix (Fortune 500 HQ in FL)
| Industry | F500 HQs | Revenue |
|---|---|---|
| Industrial Technology | 2 | $29B |
|
||
| Insurance | 2 | $17B |
|
||
| Retail | 1 | $60B |
|
||
| Technology Distribution | 1 | $58B |
|
||
| Homebuilding | 1 | $35B |
|
||
| Technology Manufacturing | 1 | $35B |
|
||
Price history
+0.0% since first listed3 events — show timeline
- 2026-05-25 Rental Removed $3,300 SHOWMOJO
- 2026-05-19 Listed $285,000 FSBO.com
- 2026-03-14 Listed for Rent $3,300 SHOWMOJO
Cash-flow waterfall
monthlySold comps — $/sqft
last 12 mo · ≤1 miLoading sold comps…