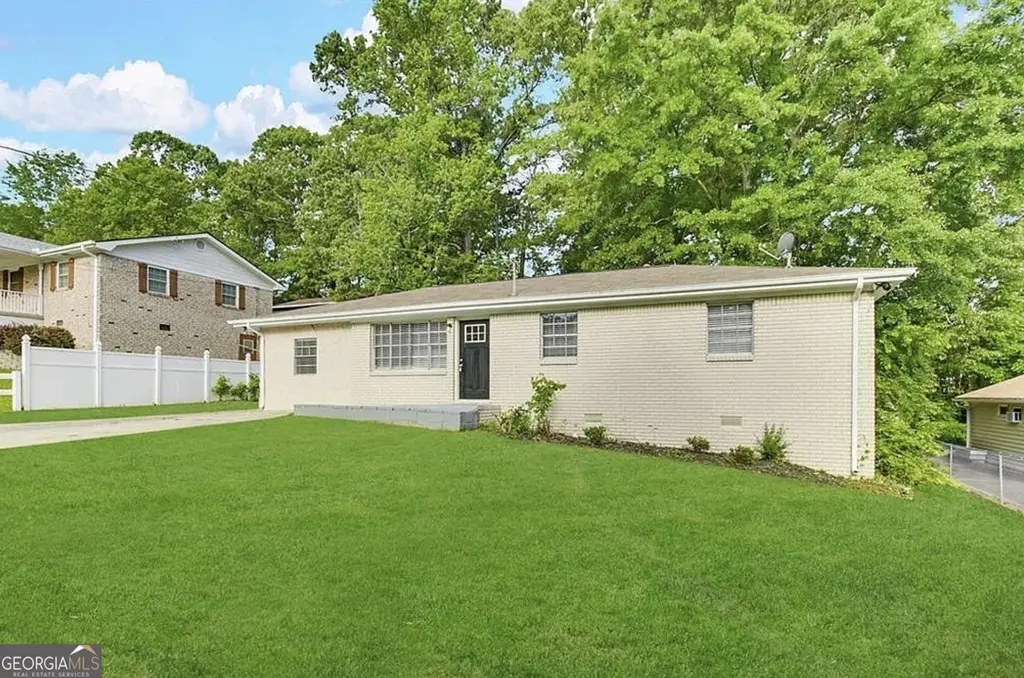
6309 Wellington Way · Austell, GA
Flood risk 1/10 · Minimal
- FEMA flood zone
- X (unshaded)
- Chance of flooding over 30 yrs
- 0.0%
- Est. flood insurance / yr
- $507 – $1,088
Fire risk 1/10 · Minimal
- Est. fire insurance / yr
- $963 – $1,789
Heat risk 5/10 · Moderate
- Hot days now (above 103°F)
- 7 days/yr
- Hot days in 30 yrs
- 19 days/yr
Wind risk 4/10 · Minor
- Chance of severe wind over 30 yrs
- 24.0%
Air-quality risk 4/10 · Minor
- Unhealthy air days now
- 4 days/yr
- Unhealthy air days in 30 yrs
- 5 days/yr
Risk factors via First Street. Map © Google.
Why this score? — see what drove the D grade
The composite is a weighted blend of 9 inputs, each scored 0–100. Each bar is that input's sub-score; the figure is the points it added to the 100-point composite (weight × sub-score).
- ARV discount +14.4/15.0
- Cash flow +10.5/30.0
- Schools +3.8/10.0
- Livability +3.4/5.0
- DSCR +3.0/10.0
- Rent growth +2.8/5.0
- Condition / age +2.5/5.0
- 1% rule +2.4/10.0
- Appreciation +0.0/10.0
$247,000
🖨 Deal sheet (PDF) 📄 Offer letter ✓ Due diligence
Listing remarks MLS
A beautifully renovated 4-bedroom, 1-bathroom ranch home. This home features stylish updates including stainless steel kitchen appliances, granite countertops, and updated flooring throughout. Situated on a large level lot. Conveniently located near shopping, dining, and more! Do not miss this great opportunity!
Key facts
- Large level lot
- Updated flooring
- Granite countertops
Tags
Neighborhood map
What this means for you Summary
Snapshot
- This is a 3-bed/1.0-bath single-family listed at $247k.
Deal economics
- At list price, monthly cash flow is $-127 ($-2k/yr) — negative.
- To cash-flow at today's rent, offer at most $225k (9.1% below list).
- To meet the 1% rule (rent ≥ 1% of price), the offer needs to be $182k (26.3% below list).
- Recommended offer: $182k (26.3% below list) — sets the bar for 1% rule.
- Cap rate 5.7% vs local median 4.7% in Austell — meaningfully above typical; check what's discounted (condition, days-on-market, listing class) to confirm the premium yield is real.
Location & tenants
- Location reads 67/100 on livability (#175 in GA) — a middle-class / working-renter tenant base. Strengths: cost of living A+, housing A+; Watch: employment D+, amenities F, commute F.
- Cobb County (suburban): math 39% / reading 45% proficiency, ranked #25 of 174 in GA (top 14%) — families likely to look elsewhere, expect single-tenant / working-renter base with shorter leases.
- Zoned schools: Hendricks Elementary School (math 19% / reading 27%, grade F, #797 of 1,228 statewide, top 65%, 502 students, 74% FRL); Garrett Middle School (math 15% / reading 21%, grade F, #375 of 470 statewide, top 80%, 906 students, 85% FRL); South Cobb High School (math 21% / reading 20%, grade F, #231 of 424 statewide, top 54%, 2,127 students, 67% FRL) — zoned schools average 75% FRL vs 39% district-wide (36 pts higher); higher-poverty schools than district average — tighter screening recommended.
- Zoned-school proficiency averages 20% at this address vs 42% district-wide (-22 pts) — the specific schools serving this property underperform the Cobb County average; the district grade overstates school quality for this exact location.
- Market conditions: Rents rising (+1.3%/yr); 187 active listings in the ZIP; 11 comparable units currently listed for rent nearby; rentals at typical pace (median 26d on market — plan ~3-4 weeks tenant-placement turnaround); 1,625 units permitted in Cobb County in 2024 (389 in 5+ unit buildings).
- This rent runs 32% of the median local income ($69k/yr) — at the standard rent-burdened threshold; future hikes will face affordability resistance.
Forward outlook
- Local home prices are declining (-3.0%/yr); year-one equity from $2k of loan paydown is wiped out by about $7k of value loss. Plan a longer hold.
- Cobb County population projected at +33% by 2050 — long-run rental-demand tailwind backs the buy-and-hold thesis.
Negotiation context
- It's been on market 408 days — a 12% lower offer ($217k) is reasonable based on typical stale-listing flexibility.
- 4 sale attempts since 20y ago with the ask held roughly flat each time — persistent listings suggest the price (not the market) is what's stuck; bring a comps-based counter.
- Current owner paid $121k; list at $247k implies a 104% gain — meaningful room to come down on a strong offer.
Risks & watch-outs
- Climate carrying-cost: extreme-heat days projected 7→19/yr by 2055 (HVAC capex compounding) — expect insurance premiums to compound above CPI over the hold.
Questions for the listing agent
- What do current leases actually rent for vs. the listed asking? Can we see a recent rent roll and the last 12 months of T-12 income?
- It's been on market 408 days. Have you received any prior offers? Is the seller open to a 26% concession, seller financing, or rate buy-down credit?
- Built in 1970 — when were the roof, HVAC, electrical panel, plumbing, and water heater last replaced?
- Why hasn't it sold? Are there any deal-killer items the seller is aware of (foundation, flood, title, zoning, code violations)?
- Is there a deadline driving the sale (1031 exchange, divorce, estate, relocation)? That informs how much negotiation room exists.
- Schools are D-rated, which usually means shorter tenancies and higher turnover. Who's the typical renter profile here, and what's been the actual vacancy rate?
- The area grade is low — what's the realistic commute time and amenity access for the typical tenant pool here? Any planned neighborhood developments (good or bad) we should know about?
- What's the average days-on-market for RENTAL listings here right now (not sales)? A rising rental-DOM trend means longer vacancies and softer asking-rent achievability than the comps imply.
- What's the recent tenant-quality profile in this submarket — average credit score on applications, eviction rate, late-payment / NSF rate, and stable-employment percentage? A property-management company in the area should have these aggregated.
- How much new for-sale + rental construction is in the pipeline within 1–3 miles? Heavy new supply typically softens prices + rents 12–24 months out; constrained supply supports both.
Investment metrics
- 1% rule
- 0.74% ✗
- Cap rate
- 5.68%
- Cash-on-cash
- -2.20%
- DSCR
- 0.90
- GRM
- 11.3
CMA / ARV
- ARV (median comp)
- $291,432
- List price
- $247,000
- Delta
- -15.25%
- Verdict
- UNDERPRICED
- Comps
- 20 within 1.0 mi
Show comp detail 12 sales within ~0.75 mi
| Address | Dist | Beds/Ba | Sqft | Sold | Price | $/sf | Match |
|---|---|---|---|---|---|---|---|
| 6402 Kensington Ct | 0.06mi | 4/2.0 (+1) | 1,320 (-2%) | 10mo | $296,000 | $224 | 76 |
| 6163 Temple St | 0.33mi | 3/1.0 | 1,272 (-6%) | 7mo | $285,000 | $224 | 69 |
| 3315 Brookfield Dr | 0.39mi | 4/2.5 (+1) | 1,326 (-2%) | 10mo | $295,000 | $222 | 59 |
| 6471 Ansley Blvd | 0.75mi | 3/1.0 | 1,350 (-0%) | 7mo | $220,000 | $163 | 59 |
| 3400 Scott Dr | 0.48mi | 3/1.0 | 1,225 (-9%) | 8mo | $230,000 | $188 | 55 |
| 5851 Miller Rd | 0.47mi | 3/1.0 | 1,308 (-3%) | 22mo | $261,000 | $200 | 55 |
| 5890 Betty St | 0.41mi | 3/1.5 | 1,408 (+4%) | 22mo | $310,000 | $220 | 54 |
| 6364 Arthur Dr | 0.67mi | 3/1.0 | 1,219 (-10%) | 8mo | $225,000 | $185 | 45 |
| 6000 Water Oaks Dr | 0.39mi | 3/2.0 | 1,510 (+12%) | 17mo | $235,000 | $156 | 44 |
| 6197 Union Grove Rd | 0.67mi | 3/3.0 | 1,477 (+9%) | 3mo | $245,000 | $166 | 43 |
| 6411 Temple St | 0.66mi | 3/2.0 | 1,536 (+14%) | 1mo | $260,000 | $169 | 42 |
| 6307 Ansley Blvd | 0.51mi | 4/2.0 (+1) | 1,172 (-13%) | 18mo | $199,900 | $171 | 30 |
Match score weights: distance 35% · size 25% · config 20% · recency 20%. Top-matched comps best support the ARV.
Projected returns pro-forma
-3.0% appreciation · 1.3% rent growth · sell at horizon
- IRR
- -21.7%
- Equity multiple
- 0.26×
- Total profit
- $-51,226
- Equity at exit
- $36,829
- IRR
- -19.8%
- Equity multiple
- 0.03×
- Total profit
- $-67,394
- Equity at exit
- $21,356
Cash invested: $69,160 (down + closing). Projections, not guarantees.
Landlord ↔ Tenant lean methodology
- Overall (STATE)
- 90 Strongly Landlord-Friendly
- State Georgia
- 90 Strongly Landlord-Friendly · R+3
- County
- — inherits STATE
- City
- — inherits STATE
ZIP-level market 30106
- Home prices YoY
- -33.4%
- Rents YoY
- 1.3%
- Active inventory
- 187
- Price-to-rent
- 11.3×
Monthly cashflow live
- Estimated rent
- $1,820 high interval (Pro) →
- Mortgage (P&I)
- −$1,295
- Tax from tax record
- −$166 /mo · $1,994/yr
- Insurance
- −$103
- HOA
- −$0
- Vacancy / Maint / Mgmt
- −$382
- Net cashflow
- $-127
Break-even live
Sensitivity live
| Price | -10% $13 | -5% $-57 | +0% $-127 | +5% $-197 | +10% $-267 |
|---|---|---|---|---|---|
| Rent | -10% $-271 | -5% $-199 | +0% $-127 | +5% $-55 | +10% $17 |
| Rate | -1.0pp $-2 | -0.5pp $-64 | base $-127 | +0.5pp $-191 | +1.0pp $-256 |
UW: 25.0% down · 7.5% · 30yr · 1.5% tax · 5.0% vac · 8.0% maint · 8.0% mgmt
Financing live
Cash to close
- Down payment
- $61,750
- Closing costs
- $7,410
- Reserves months
- —
- Total cash needed
- —
Loan-product check · same deal, 3 products live
Conventional
25% down · 7.5% · 30yr
- Down + closing
- —
- Monthly P&I
- —
- Monthly cashflow
- —
- DSCR
- —
- Eligible?
- —
Personal DTI + credit; lowest rate.
DSCR
20% down · 8.5% · 30yr
- Down + closing
- —
- Monthly P&I
- —
- Monthly cashflow
- —
- DSCR
- —
- Eligible?
- —
No personal income docs; deal must DSCR.
Hard money
10% down · 12.0% · 12mo
- Down + closing
- —
- Monthly P&I
- —
- Monthly cashflow
- —
- DSCR
- —
- Eligible?
- —
Short-term bridge; refi at stabilization.
Rent comps 11 comps
| Address | Beds | Baths | Sqft | Rent | $/sqft | DOM | Units | Dist |
|---|---|---|---|---|---|---|---|---|
| 6403 Kensington Ct Austell, GA | 4.0 | 2.0 | 1352 | $1,674 | $1.24 | 26d | 1 | 0.07mi |
| 3666 Glenda St Lithia Springs, GA | 3.0 | 2.0 | 980 | $1,200 | $1.22 | 26d | 1 | 0.30mi |
| 5955 Water Oaks Dr Austell, GA | 4.0 | 2.0 | 1490 | $2,176 | $1.46 | 14d | 1 | 0.39mi |
| 3670 Goodwin Rd Austell, GA | 3.0 | 1.0 | 1025 | $1,650 | $1.61 | 20d | 1 | 0.53mi |
| 3034 Millstone Ct Austell, GA | 4.0 | 2.0 | 1430 | $1,825 | $1.28 | 24d | 1 | 0.99mi |
| 3034 Millstone Ct Austell, GA | 4.0 | 2.0 | 1430 | $1,825 | $1.28 | 26d | 1 | 0.99mi |
| 3946 Creel Dr Lithia Springs, GA | 3.0 | 1.5 | 1800 | $1,595 | $0.89 | 7d | 1 | 0.99mi |
| 5989 Bowden St Austell, GA | 4.0 | 3.0 | 1388 | $3,965 | $2.86 | 45d | 1 | 1.09mi |
| 5550 Pemrock Ct Powder Springs, GA | 3.0 | 3.0 | 1613 | $2,135 | $1.32 | 26d | 1 | 1.09mi |
| 6739 S Sweetwater Rd Lithia Springs, GA | 2.0 | 1.0 | 1442 | $1,450 | $1.01 | 46d | 1 | 1.18mi |
| 6698 Baker Dr Lithia Springs, GA | 3.0 | 2.0 | 1308 | $1,800 | $1.38 | 45d | 1 | 1.19mi |
Listing history 28 events
-
2026-06-21days on market $247,000 Active 408 DOM
-
2026-06-18days on market $247,000 Active 405 DOM
-
2026-06-17days on market $247,000 Active 404 DOM
-
2026-06-16days on market $247,000 Active 403 DOM
-
2026-06-15days on market $247,000 Active 402 DOM
-
2026-06-13days on market $247,000 Active 400 DOM
-
2026-06-13days on market $247,000 Active 399 DOM
-
2026-06-09days on market $247,000 Active 396 DOM
-
2026-06-08days on market $247,000 Active 395 DOM
-
2026-06-07days on market $247,000 Active 394 DOM
-
2026-06-04days on market $247,000 Active 391 DOM
-
2026-06-03days on market $247,000 Active 390 DOM
-
2026-06-02days on market $247,000 Active 389 DOM
-
2026-06-01days on market $247,000 Active 388 DOM
-
2026-05-31days on market $247,000 Active 387 DOM
-
2025-05-09$247,000 New 313-char remark
Show marketing remark (313 chars)
A beautifully renovated 4-bedroom, 1-bathroom ranch home. This home features stylish updates including stainless steel kitchen appliances, granite countertops, and updated flooring throughout. Situated on a large level lot. Conveniently located near shopping, dining, and more! Do not miss this great opportunity!
-
2019-05-31soldstatus $121,000 Closed 282-char remark
Show marketing remark (282 chars)
CORPORATE SELLER, NO SELLER DISCLOSURE AVAILABLE. TENANT OCCUPIED, DO NOT DISTURB. This brick ranch home has 4 bedrooms, 1 full bath, spacious kitchen with plenty of storage, hardwood/tile/carpet throughout, walk in closet, ceiling fans, over sized covered patio in fenced backyard.
-
2019-05-31soldstatus $121,000
Show marketing remark (282 chars)
CORPORATE SELLER, NO SELLER DISCLOSURE AVAILABLE. TENANT OCCUPIED, DO NOT DISTURB. This brick ranch home has 4 bedrooms, 1 full bath, spacious kitchen with plenty of storage, hardwood/tile/carpet throughout, walk in closet, ceiling fans, over sized covered patio in fenced backyard.
-
2019-04-29status Pending 282-char remark
Show marketing remark (282 chars)
CORPORATE SELLER, NO SELLER DISCLOSURE AVAILABLE. TENANT OCCUPIED, DO NOT DISTURB. This brick ranch home has 4 bedrooms, 1 full bath, spacious kitchen with plenty of storage, hardwood/tile/carpet throughout, walk in closet, ceiling fans, over sized covered patio in fenced backyard.
-
2019-04-26$121,000 Active 282-char remark
Show marketing remark (282 chars)
CORPORATE SELLER, NO SELLER DISCLOSURE AVAILABLE. TENANT OCCUPIED, DO NOT DISTURB. This brick ranch home has 4 bedrooms, 1 full bath, spacious kitchen with plenty of storage, hardwood/tile/carpet throughout, walk in closet, ceiling fans, over sized covered patio in fenced backyard.
-
2019-04-22$121,000
-
2018-01-19soldstatus $711,000
-
2007-02-26soldstatus $84,900
-
2006-10-03soldstatus $100,830
-
2006-09-27$84,900
-
2002-08-08soldstatus $104,000
-
1997-04-01soldstatus $75,000
-
1986-07-28soldstatus $34,050
ⓘ Source: listings_history table (triggers on properties + properties_extension) + one-shot
backfill from property_details.listing_events for pre-trigger history.
Tax reassessment forecast GA · Resets to sale price
- Current annual tax
- $1,994 · $166/mo
- Projected year-2 tax
- $2,272 · $189/mo
- Expected delta
- +$279/yr (+$23/mo · 14.0%)
ⓘ Screening estimate from a state-policy table — verify with the county assessor before closing.
Climate risk First Street
- Flood 1/10 Low FEMA zone X (unshaded) · 0% chance over 30 yrs
- Wildfire 1/10 Low
- Heat 5/10 Major 7 d/yr ≥103°F today · 19 d/yr by 30 yrs out
- Wind 4/10 Moderate 24% chance of damaging wind over 30 yrs
- Air quality 4/10 Moderate 4 unhealthy d/yr today · 5 by 30 yrs out
Nearby sold comps map
Loading sold comps map…
Walkable amenities ~0.75 mi
Loading nearby amenities…
Taxation est. · year 1
- Rental income
- $21,835
- − Mortgage interest
- −$13,836
- − Property taxes
- −$1,994
- − Insurance
- −$1,235
- − Repairs & maintenance
- −$1,747
- − Management
- −$1,747
- − Depreciation
- −$7,185
- Taxable loss
- −$5,909
- Est. tax savings @ 24.0%
- +$1,418
- After-tax cash flow
- $-104/yr
For passive investors: Depreciation is non-cash, so a rental often shows a tax loss while cash-flowing — sheltering income. Rental losses are passive: they offset passive income freely, and up to $25,000/yr can offset ordinary (W-2) income if you actively participate and your MAGI is under $100k (phasing out to $0 by $150k); unused losses carry forward. On sale, claimed depreciation is recaptured at up to 25%, and gains may owe capital-gains tax (a 1031 exchange can defer both). Figures are a year-1 estimate at your 24.0% rate — not tax advice; consult a CPA.
Schools (NCES district)
- District
- Cobb County
- NCES district ID
- 1301290
- Math proficiency
- 39% ▼ -15.00%
- Reading proficiency
- 45% ▼ -10.00%
- Median HH income
- $68,845
- Composite
- 37.93/100
- National rank
- #4308
- State rank
- #25 of 174 in GA
Livability — Austell
- Score
- 67/100
- State rank
- #175
- US rank
- #11059
Category grades
Schools grade is shown separately in the Schools card above.
Census & demographics
- Census place
- Austell, GA
- County
- Cobb County · 777,758 people
- City population
- 49,719
- Metro
- Atlanta-Sandy Springs-Alpharetta, GA
- Population (ZIP)
- 23,107
- Household income
- $68,881
- Rent vs Own
- Severe rent burden
- 907.0
Population outlook (Cobb County) Hauer SSP2
- Today (2025)
- 868,385 people
- By 2030
- 929,614 · +7.1%
- By 2040
- 1,047,533 · +20.6%
- By 2050
- 1,155,537 · +33.1%
- By 2075
- 1,405,030 · +61.8%
- By 2100
- 1,555,058 · +79.1%
Race, ethnicity, and origin ACS 2023
- Neighborhood character
- Diverse neighborhood (Simpson 0.62)
- Race & ethnicity
- Black 54% White 22% Hispanic / Latino 20% Two or more races 8% Asian 1%
- Hispanic origin (detail)
- Mexican 9% Puerto Rican 6%
- Common ancestry
- Italian 2% Hispanic 1% Romanian 1%
- Foreign-born
- 14% · Canada, Jamaica, Vietnam
- Languages at home
- 79% English-only · Spanish 16% Other Indo-European 1% French/Haitian/Cajun 1%
Political lean MEDSL · Cobb
- 2024 margin
- D (+14.9) · D 56.9% · R 42.0% · Other 1.1%
- 2008→2024 swing
- +24.3pp toward D · 2008: -9.4pp · 2024: 14.9pp
- All cycles
- 2024: D+14.9 2020: D+14.3 2016: D+2.1 2012: R+12.6 2008: R+9.4
Not yet ingested
- Civics
- —
Market trends
- HPI YoY
- ▼ -128.55%
- Current HPI
- 256.6988
- Rent YoY
- ▲ 1.30%
- Metro
- Atlanta-Sandy Springs-Alpharetta, GA
- State GDP YoY
- ▲ 2.66%
- F500 in state
- 28
Industry mix (Fortune 500 HQ in GA)
| Industry | F500 HQs | Revenue |
|---|---|---|
| Paper / Packaging | 2 | $29B |
|
||
| Retail | 1 | $160B |
|
||
| Transportation / Logistics | 1 | $91B |
|
||
| Airlines | 1 | $62B |
|
||
| Consumer Goods | 1 | $47B |
|
||
| Utilities | 1 | $25B |
|
||
Price history
+625.4% since first listed13 events — show timeline
- 2025-05-09 Listed $247,000 GAMLS
- 2019-05-31 Sold (MLS) $121,000 GAMLS
- 2019-05-31 Sold (MLS) $121,000 FMLS
- 2019-04-29 Pending — FMLS
- 2019-04-26 Listed $121,000 FMLS
- 2019-04-22 Listed $121,000 GAMLS
- 2018-01-19 Sold (Public Records) $711,000 Public Records
- 2007-02-26 Sold (MLS) $84,900 FMLS
- 2006-10-03 Sold (Public Records) $100,830 Public Records
- 2006-09-27 Listed $84,900 FMLS
- 2002-08-08 Sold (Public Records) $104,000 Public Records
- 1997-04-01 Sold (Public Records) $75,000 Public Records
- 1986-07-28 Sold (Public Records) $34,050 Public Records
Property tax history
+3.6%/yrLatest (2025): $1,994 · +0.0% YoY. Source: county tax records.
Cash-flow waterfall
monthlySold comps — $/sqft
last 12 mo · ≤1 miLoading sold comps…