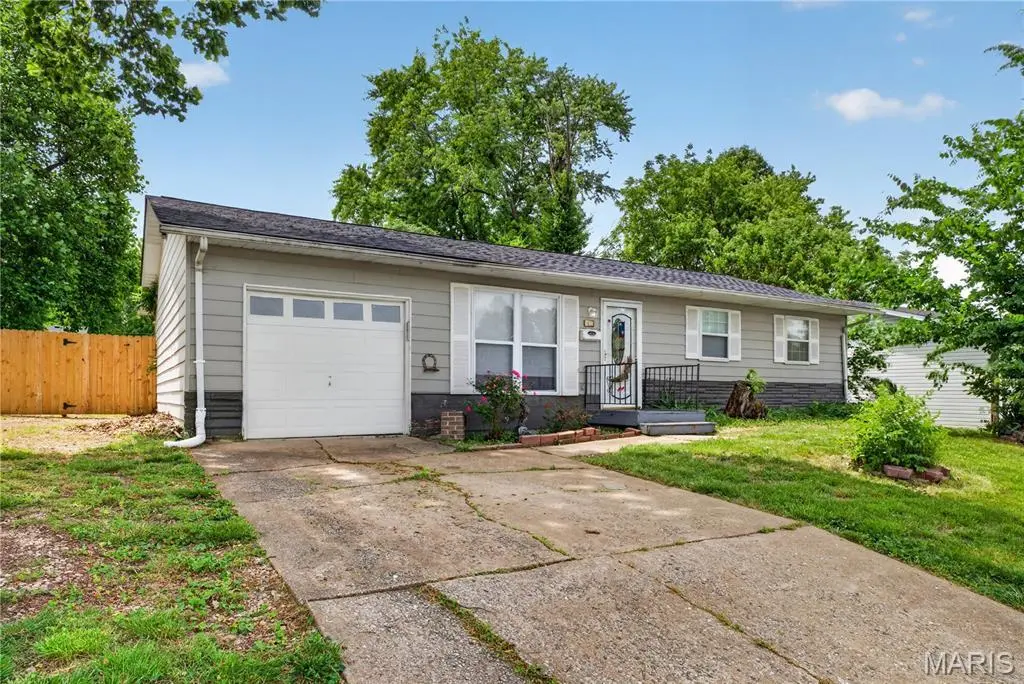
807 Estate Dr · O'Fallon, IL
Flood risk 1/10 · Minimal
- FEMA flood zone
- X
- Chance of flooding over 30 yrs
- 0.0%
- Est. flood insurance / yr
- $507 – $1,088
Fire risk 1/10 · Minimal
- Est. fire insurance / yr
- $804 – $1,492
Heat risk 5/10 · Moderate
- Hot days now (above 106°F)
- 7 days/yr
- Hot days in 30 yrs
- 21 days/yr
Wind risk 2/10 · Minimal
- Chance of severe wind over 30 yrs
- 1.0%
Air-quality risk 3/10 · Minor
- Unhealthy air days now
- 3 days/yr
- Unhealthy air days in 30 yrs
- 4 days/yr
Risk factors via First Street. Map © Google.
Why this score? — see what drove the C grade
The composite is a weighted blend of 9 inputs, each scored 0–100. Each bar is that input's sub-score; the figure is the points it added to the 100-point composite (weight × sub-score).
- Cash flow +20.3/30.0
- ARV discount +15.0/15.0
- DSCR +6.4/10.0
- 1% rule +5.4/10.0
- Rent growth +4.2/5.0
- Schools +3.4/10.0
- Livability +2.5/5.0
- Condition / age +2.5/5.0
- Appreciation +0.0/10.0
$140,000
🖨 Deal sheet 📄 Offer letter ✓ Due diligence
Listing remarks MLS
WOW what a find! Featuring 3 bedrooms, 1 1/2 bathroom with 1 car attached and privacy fenced lot. Boasting tons of updates such as newer flooring in the living room and kitchen with open concept entertaining floor plan. This home features all the conveniences of O'Fallon with a super affordable price!
Key facts
- Spacious level lot
- Open layout
- Center island
Tags
Property features AI
Finance
- Financial info: Lease not considered; No second mortgage indicated
Exterior
- Parking: Attached garage (1 car)
- Utilities: Public water; Public sewer; Electric service by Ameren; Electricity connected; Natural gas connected; Sewer connected; Water connected
- Home design: Single-family residence; One level
- Construction: Vinyl siding; Architectural shingle roof
- Exterior features: Level lot; Gazebo
Interior
- Kitchen: Dishwasher; Disposal; Microwave; Electric oven; Electric range
- Bedrooms: 3 bedrooms (all on the main level)
- Bathrooms: 1 full bathroom
- Heating & cooling: Forced air heating (natural gas); Central air conditioning (electric)
- Interior features: Kitchen island; Kitchen/dining room combo; Open floorplan
- Laundry & utility: Gas water heater
Neighborhood map
What this means for you Summary
Snapshot
- This is a 3-bed/2.0-bath single-family listed at $140k.
Deal economics
- At list price, monthly cash flow is $179 ($2k/yr) — positive.
- The deal already cash-flows at list — no discount required.
- Meets the 1% rule at list price ($1k rent vs $140k).
- Recommended offer: $138k (1.5% below list) — sets the bar for market timing.
- Cap rate 7.8% vs local median 2.8% in O'Fallon — top-decile yield for the area; either an underpriced asset or a hidden risk that comps aren't pricing in. Stress-test before assuming the spread holds.
Location & tenants
- Location reads: area grade C — affects rentability + tenant quality, not the cash-flow math above.
- O Fallon Twp Hsd 203 (suburban): math 32% / reading 40% proficiency, ranked #145 of 620 in IL (top 23%) — families likely to look elsewhere, expect single-tenant / working-renter base with shorter leases.
- Market conditions: Rents rising fast (+6.6%/yr); 197 active listings in the ZIP; 14 comparable units currently listed for rent nearby; rentals leasing fast (median 2d on market — plan ~1-2 weeks tenant-placement turnaround); solid renter incomes; 783 units permitted in St. Clair County in 2024 (378 in 5+ unit buildings).
- This rent is only 17% of the median local income ($104k/yr) — well below the 30% rent-burden line; pricing power to push rent on renewal without tenant pushback.
Forward outlook
- Local home prices are declining (-3.0%/yr); year-one equity from $968 of loan paydown is wiped out by about $4k of value loss. Plan a longer hold.
- St. Clair County population projected at -23% by 2050 — secular population decline; favor cash flow + early exit over multi-decade hold.
- At projected returns (-3.0% appreciation + 6.6% rent growth), your $39k cash investment doubles in ~10 years — after that, you're playing with house money.
Negotiation context
- It's been on market 20 days — a 2% lower offer ($138k) is reasonable based on typical stale-listing flexibility.
- 6 sale attempts since 7y ago with the ask held roughly flat each time — persistent listings suggest the price (not the market) is what's stuck; bring a comps-based counter.
- Current owner paid $96k; 46% above their basis — modest negotiation headroom, anchor on the comps not their cost.
Risks & watch-outs
- Climate carrying-cost: extreme-heat days projected 7→21/yr by 2055 (HVAC capex compounding) — expect insurance premiums to compound above CPI over the hold.
Questions for the listing agent
- Built in 1976 — when were the roof, HVAC, electrical panel, plumbing, and water heater last replaced?
- Is there a deadline driving the sale (1031 exchange, divorce, estate, relocation)? That informs how much negotiation room exists.
- What's the average days-on-market for RENTAL listings here right now (not sales)? A rising rental-DOM trend means longer vacancies and softer asking-rent achievability than the comps imply.
- What's the recent tenant-quality profile in this submarket — average credit score on applications, eviction rate, late-payment / NSF rate, and stable-employment percentage? A property-management company in the area should have these aggregated.
- How much new for-sale + rental construction is in the pipeline within 1–3 miles? Heavy new supply typically softens prices + rents 12–24 months out; constrained supply supports both.
Investment metrics
- 1% rule
- 1.04% ✓
- Cap rate
- 7.83%
- Cash-on-cash
- 5.49%
- DSCR
- 1.24
- GRM
- 8.0
CMA / ARV
- ARV (on-the-fly)
- $176,904
- Comps found
- 12
Show comp detail 12 sales within ~0.75 mi
| Address | Dist | Beds/Ba | Sqft | Sold | Price | $/sf | Match |
|---|---|---|---|---|---|---|---|
| 803 Estate Dr | 0.02mi | 3/2.0 | 1,062 (+14%) | 13mo | $147,000 | $138 | 66 |
| 403 E 4th St | 0.44mi | 2/1.0 (-1) | 936 (0%) | 15mo | $154,900 | $165 | 58 |
| 104 W Jackson St | 0.75mi | 3/1.0 | 900 (-4%) | 1mo | $182,500 | $203 | 54 |
| 406 E 3rd St | 0.37mi | 2/1.0 (-1) | 960 (+3%) | 19mo | $185,000 | $193 | 54 |
| 512 E Adams St | 0.24mi | 2/1.0 (-1) | 1,020 (+9%) | 15mo | $189,900 | $186 | 52 |
| 408 E Washington St | 0.34mi | 2/1.0 (-1) | 1,072 (+14%) | 2mo | $189,000 | $176 | 50 |
| 305 S Augusta St | 0.33mi | 2/1.0 (-1) | 875 (-6%) | 20mo | $165,000 | $189 | 48 |
| 414 E Washington St | 0.31mi | 2/1.0 (-1) | 865 (-8%) | 24mo | $170,000 | $197 | 44 |
| 217 E Fourth St | 0.53mi | 2/1.5 (-1) | 1,024 (+9%) | 11mo | $235,000 | $229 | 43 |
| 201 W Washington St | 0.70mi | 3/2.0 | 1,076 (+15%) | 1mo | $250,000 | $232 | 42 |
| 704 S Hilgard St | 0.60mi | 2/1.0 (-1) | 975 (+4%) | 18mo | $165,000 | $169 | 41 |
| 706 S Vine St | 0.71mi | 2/1.0 (-1) | 1,027 (+10%) | 8mo | $174,900 | $170 | 35 |
Match score weights: distance 35% · size 25% · config 20% · recency 20%. Top-matched comps best support the ARV.
Projected returns pro-forma
-3.0% appreciation · 6.64% rent growth · sell at horizon
- IRR
- -3.7%
- Equity multiple
- 0.85×
- Total profit
- $-5,684
- Equity at exit
- $20,874
- IRR
- 9.7%
- Equity multiple
- 1.88×
- Total profit
- $34,414
- Equity at exit
- $12,105
Cash invested: $39,200 (down + closing). Projections, not guarantees.
Landlord ↔ Tenant lean methodology
- Overall (STATE)
- 43 Moderately Tenant-Leaning
- State Illinois
- 43 Moderately Tenant-Leaning · D+7
- County
- — inherits STATE
- City
- — inherits STATE
ZIP-level market 62269
- Home prices YoY
- -29.5%
- Rents YoY
- 6.6%
- Active inventory
- 197
- Price-to-rent
- 8.0×
Monthly cashflow live
- Estimated rent
- $1,462 high interval (Pro) →
- Mortgage (P&I)
- −$734
- Tax from tax record
- −$183 /mo · $2,194/yr
- Insurance
- −$58
- HOA
- −$0
- Vacancy / Maint / Mgmt
- −$307
- Net cashflow
- $179
Break-even live
UW: 25.0% down · 7.5% · 30yr · 1.5% tax · 5.0% vac · 8.0% maint · 8.0% mgmt
Financing live
Cash to close
- Down payment
- $35,000
- Closing costs
- $4,200
- Reserves months
- —
- Total cash needed
- —
Loan-product check · same deal, 3 products live
Conventional
25% down · 7.5% · 30yr
- Down + closing
- —
- Monthly P&I
- —
- Monthly cashflow
- —
- DSCR
- —
- Eligible?
- —
Personal DTI + credit; lowest rate.
DSCR
20% down · 8.5% · 30yr
- Down + closing
- —
- Monthly P&I
- —
- Monthly cashflow
- —
- DSCR
- —
- Eligible?
- —
No personal income docs; deal must DSCR.
Hard money
10% down · 12.0% · 12mo
- Down + closing
- —
- Monthly P&I
- —
- Monthly cashflow
- —
- DSCR
- —
- Eligible?
- —
Short-term bridge; refi at stabilization.
Rent comps 14 comps
| Address | Beds | Baths | Sqft | Rent | $/sqft | DOM | Units | Dist |
|---|---|---|---|---|---|---|---|---|
| 106 Lee Dr Unit 3 O'Fallon, IL | 2.0 | 1.0 | 600 | $1,025 | $1.71 | 1d | 1 | 0.07mi |
| 103 E 7th St O'Fallon, IL | 2.0 | 1.0 | 700 | $1,025 | $1.46 | 1d | 1 | 0.77mi |
| 823 N Cherry St Unit 1 O'Fallon, IL | 2.0 | 1.5 | 1115 | $1,400 | $1.26 | 1d | 1 | 0.98mi |
| 312 Joy Dr O Fallon, IL | 2.0 | 1.0 | 1052 | $1,395 | $1.33 | 1d | 1 | 1.03mi |
| 507 W 4th St O Fallon, IL | 2.0 | 1.0 | 1073 | $1,625 | $1.51 | 3d | 1 | 1.10mi |
| 418 Donna Dr O Fallon, IL | 2.0 | 1.0 | 1100 | $1,100 | $1.00 | 7d | 1 | 1.26mi |
| 418 Donna Dr O Fallon, IL | 2.0 | 1.0 | 1100 | $1,100 | $1.00 | 1d | 1 | 1.26mi |
| 805 Juniper Dr O Fallon, IL | 3.0 | 1.0 | 864 | $1,595 | $1.85 | 7d | 1 | 1.32mi |
| 805 Juniper Dr O Fallon, IL | 3.0 | 1.0 | 864 | $1,595 | $1.85 | 1d | 1 | 1.32mi |
| 1523 English Pne Belleville, IL | 2.0 | 3.0 | 1050 | $2,195 | $2.09 | 2d | 1 | 1.42mi |
| 1523 English Pne Belleville, IL | 3.0 | 2.0 | 1050 | $2,195 | $2.09 | 4d | 1 | 1.42mi |
| 1523 English Pne Belleville, IL | 3.0 | 2.0 | 1050 | $2,095 | $2.00 | 1d | 1 | 1.42mi |
| 109 Sugar Pine Ln O Fallon, IL | 2.0 | 1.0 | 980 | $1,095 | $1.12 | 1d | 1 | 1.44mi |
| 129 Sugar Pine Ln O'Fallon, IL | 2.0 | 1.0 | 875 | $750 | $0.86 | 1d | 1 | 1.48mi |
Listing history 13 events
-
2026-06-18days on market $140,000 Active 20 DOM
-
2026-06-17days on market $140,000 Active 19 DOM
-
2026-06-16days on market $140,000 Active 18 DOM
-
2026-06-15days on market $140,000 Active 17 DOM
-
2026-06-13days on market $140,000 Active 15 DOM
-
2026-06-13days on market $140,000 Active 14 DOM
-
2026-06-09days on market $140,000 Active 11 DOM
-
2026-06-08days on market $140,000 Active 10 DOM
-
2026-06-07days on market $140,000 Active 9 DOM
-
2026-06-03days on market $140,000 Active 5 DOM
-
2026-06-02days on market $140,000 Active 4 DOM
-
2026-06-01days on market $140,000 Active 3 DOM
-
2026-05-31days on market $140,000 Active 2 DOM
ⓘ Source: listings_history table (triggers on properties + properties_extension) + one-shot
backfill from property_details.listing_events for pre-trigger history.
Tax reassessment forecast IL · Partial reset (capped growth)
- Current annual tax
- $2,194 · $183/mo
- Projected year-2 tax
- $2,686 · $224/mo
- Expected delta
- +$492/yr (+$41/mo · 22.4%)
ⓘ Screening estimate from a state-policy table — verify with the county assessor before closing.
Climate risk First Street
- Flood 1/10 Low FEMA zone X · 0% chance over 30 yrs
- Wildfire 1/10 Low
- Heat 5/10 Major 7 d/yr ≥106°F today · 21 d/yr by 30 yrs out
- Wind 2/10 Low 100% chance of damaging wind over 30 yrs
- Air quality 3/10 Moderate 3 unhealthy d/yr today · 4 by 30 yrs out
Nearby sold comps map
Loading sold comps map…
Walkable amenities ~0.75 mi
Loading nearby amenities…
Taxation est. · year 1
- Rental income
- $17,540
- − Mortgage interest
- −$7,842
- − Property taxes
- −$2,194
- − Insurance
- −$700
- − Repairs & maintenance
- −$1,403
- − Management
- −$1,403
- − Depreciation
- −$4,073
- Taxable loss
- −$75
- Est. tax savings @ 24.0%
- +$18
- After-tax cash flow
- $2,171/yr
For passive investors: Depreciation is non-cash, so a rental often shows a tax loss while cash-flowing — sheltering income. Rental losses are passive: they offset passive income freely, and up to $25,000/yr can offset ordinary (W-2) income if you actively participate and your MAGI is under $100k (phasing out to $0 by $150k); unused losses carry forward. On sale, claimed depreciation is recaptured at up to 25%, and gains may owe capital-gains tax (a 1031 exchange can defer both). Figures are a year-1 estimate at your 24.0% rate — not tax advice; consult a CPA.
Schools (NCES district)
- District
- O Fallon Twp Hsd 203
- NCES district ID
- 1729790
- Math proficiency
- 32% ▼ -22.00%
- Reading proficiency
- 40% ▼ -13.00%
- Median HH income
- $82,945
- Composite
- 34.3/100
- National rank
- #5240
- State rank
- #145 of 620 in IL
Livability — O'Fallon
No livability data for this city. (Only ~50 U.S. cities are tracked.)
Census & demographics
- Census place
- O'Fallon, IL
- County
- Saint Clair County · 169,691 people
- City population
- 35,536
- Metro
- St. Louis, MO-IL
- Population (ZIP)
- 35,923
- Household income
- $103,818
- Rent vs Own
- Severe rent burden
- 1233.0
Population outlook (St. Clair County) Hauer SSP2
- Today (2025)
- 250,366 people
- By 2030
- 240,511 · -3.9%
- By 2040
- 217,391 · -13.2%
- By 2050
- 192,699 · -23.0%
- By 2075
- 140,637 · -43.8%
- By 2100
- 100,499 · -59.9%
Race, ethnicity, and origin ACS 2023
- Neighborhood character
- Predominantly White (71%)
- Race & ethnicity
- White 71% Black 13% Two or more races 10% Hispanic / Latino 6% Asian 3%
- Hispanic origin (detail)
- Mexican 4%
- Common ancestry
- Romanian 4% Lithuanian 3% Slovak 2%
- Foreign-born
- 4% · Canada, South Korea
- Languages at home
- 93% English-only · Spanish 4% Arabic 1% Other Indo-European 1%
Political lean MEDSL · St. Clair
- 2024 margin
- Lean D (+7.9) · D 53.0% · R 45.1% · Other 1.8%
- 2008→2024 swing
- -14.6pp toward R · 2008: 22.4pp · 2024: 7.9pp
- All cycles
- 2024: D+7.9 2020: D+8.7 2016: D+5.6 2012: D+14.5 2008: D+22.4
Not yet ingested
- Civics
- —
Market trends
- HPI YoY
- ▼ -74.35%
- Current HPI
- 177.759
- Rent YoY
- ▲ 6.64%
- Metro
- St. Louis, MO-IL
- State GDP YoY
- ▲ 1.59%
- F500 in state
- 60
Industry mix (Fortune 500 HQ in IL)
| Industry | F500 HQs | Revenue |
|---|---|---|
| Insurance | 4 | $201B |
|
||
| Consumer Goods | 4 | $87B |
|
||
| Industrial Machinery | 3 | $64B |
|
||
| Healthcare | 2 | $55B |
|
||
| Retail / Pharmacy | 1 | $148B |
|
||
| Agriculture / Food | 1 | $86B |
|
||
Price history
+197.9% since first listed18 events — show timeline
- 2026-05-29 Listed $140,000 MARIS as Distributed by MLS Grid
- 2025-12-02 Rental Removed $1,695 MARIS
- 2025-10-07 Listed for Rent $1,695 MARIS
- 2025-10-07 Rental Removed $1,695 TENANTTURNER2
- 2025-10-04 Listed for Rent $1,695 TENANTTURNER2
- 2025-07-09 Relisted — MARIS as Distributed by MLS Grid
- 2025-06-12 Contingent — MARIS as Distributed by MLS Grid
- 2025-05-29 Price Changed $130,000 MARIS as Distributed by MLS Grid
- 2025-05-13 Price Changed $145,000 MARIS as Distributed by MLS Grid
- 2025-04-09 Listed $150,000 MARIS as Distributed by MLS Grid
- 2025-01-27 Sold (Public Records) $96,000 Public Records
- 2019-10-03 Sold (Public Records) $74,500 Public Records
- 2019-09-13 Sold (MLS) — MARIS as Distributed by MLS Grid
- 2019-09-03 Contingent — MARIS as Distributed by MLS Grid
- 2019-08-09 Listed $76,975 MARIS as Distributed by MLS Grid
- 2017-01-18 Sold (Public Records) $69,500 Public Records
- 1995-09-21 Sold (Public Records) $47,000 Public Records
- 1995-09-21 Sold (Public Records) $47,000 Public Records
Property tax history
+3.5%/yrLatest (2024): $2,194 · +11.2% YoY. Source: county tax records.
Cash-flow waterfall
monthlySold comps — $/sqft
last 12 mo · ≤1 miLoading sold comps…