 Multi-family
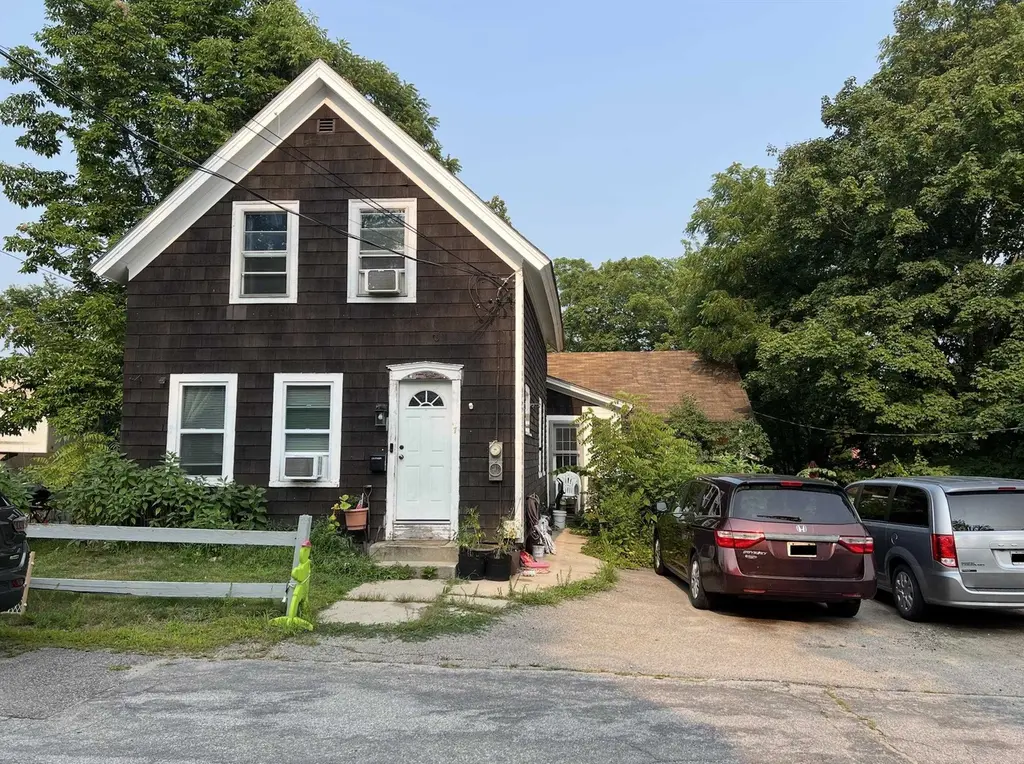
7 & 9 Glen St · Farmington, NH
Flood risk No data
- FEMA flood zone
- —
- Chance of flooding over 30 yrs
- —
- Est. flood insurance / yr
- —
Fire risk No data
- Est. fire insurance / yr
- —
Heat risk No data
- Hot days now (above threshold)
- —
- Hot days in 30 yrs
- —
Wind risk No data
- Chance of severe wind over 30 yrs
- —
Air-quality risk No data
- Unhealthy air days now
- —
- Unhealthy air days in 30 yrs
- —
Risk factors via First Street. Map © Google.
Why this score? — see what drove the B grade
The composite is a weighted blend of 9 inputs, each scored 0–100. Each bar is that input's sub-score; the figure is the points it added to the 100-point composite (weight × sub-score).
- Cash flow +29.3/30.0
- ARV discount +15.0/15.0
- DSCR +10.0/10.0
- 1% rule +8.2/10.0
- Livability +3.2/5.0
- Rent growth +2.5/5.0
- Schools +2.5/10.0
- Condition / age +2.2/5.0
- Appreciation +0.0/10.0
$336,000
🖨 Deal sheet 📄 Offer letter ✓ Due diligence
Multi-family units
County records classify this as Multi-Family (2-4 Unit). Listing-text estimate: 1 unit. estimate disagrees with records
Listing remarks
Introducing a prime investment opportunity in Farmington, NH! This property, located at 7 Glen Street, presents a 3,989 SF building consisting of 2 units, perfectly suited for the multifamily/low-rise/garden investor. With a zoning designation of UR Urban Res. and boasting 100% occupancy, this property offers a lucrative investment prospect. Situated in the desirable Farmington area, this meticulously maintained property promises a strong return on investment. Don't miss out on the potential of this well positioned asset in a high-demand market. All showings and visits must be accompanied by agent.
Key facts
- High demand market
- Multifamily units
- 0.25 acre lot
Tags
Property features AI
Exterior
- Parking: Paved driveway
- Utilities: Public sewer; Public water; Telephone available; Cable internet available; Circuit breaker electrical service
- Home design: Cape / New Englander style; Existing construction; Brown exterior color
- Construction: Wood frame construction with clapboard/wood exterior; Asphalt shingle roof; Built in 1893
- Exterior features: Paved driveway; Paved road frontage
Interior
- Bedrooms: One 2-bedroom unit; One 3+ bedroom unit
- Bathrooms: Two full bathrooms (total in property)
- Heating & cooling: Hot water heating; Oil heating; No central cooling
- Interior features: Walkout unfinished basement; Unfinished basement
Neighborhood map
What this means for you Summary
Snapshot
- This is a ?-bed/2.0-bath multifamily listed at $336k. Condition is rated fair.
Deal economics
- At list price, monthly cash flow is $1k ($14k/yr) — positive.
- The deal already cash-flows at list — no discount required.
- Meets the 1% rule at list price ($4k rent vs $336k).
- Recommended offer: $331k (1.5% below list) — sets the bar for market timing.
- Cap rate 10.5% vs local median 3.3% in Farmington — top-decile yield for the area; either an underpriced asset or a hidden risk that comps aren't pricing in. Stress-test before assuming the spread holds.
Location & tenants
- Location reads 64/100 on livability (#79 in NH) — a middle-class / working-renter tenant base. Strengths: cost of living A+, crime A, housing A-; Watch: health & safety C-, schools D, amenities F.
- Farmington School District (rural): math 20% / reading 36% proficiency, ranked #86 of 98 in NH (top 88%) — low school quality limits family demand, transient renter base, plan for 1-2y turnover.
- Market conditions: 35 active listings in the ZIP; 951 units permitted in Strafford County in 2024 (551 in 5+ unit buildings).
- At $4,428/mo this rent would consume 79% of the median local household income ($67k/yr) (locally 201% of renters already pay >50% of income on rent) — very limited rent-growth headroom before tenants either downsize or default.
Forward outlook
- Local home prices are declining (-3.0%/yr); year-one equity from $2k of loan paydown is wiped out by about $10k of value loss. Plan a longer hold.
- Strafford County population projected at +7% by 2050 — modest demand growth; plan on rents tracking national, not racing it.
- At projected returns (-3.0% appreciation + 3.0% rent growth), your $94k cash investment doubles in ~8 years — after that, you're playing with house money.
Negotiation context
- It's been on market 30 days — a 2% lower offer ($331k) is reasonable based on typical stale-listing flexibility.
Risks & watch-outs
- Watch-outs: built in 1893 — expect roof / HVAC / electrical / plumbing capex.
Questions for the listing agent
- Have any recent inspections been done? Can we get a copy of the seller's disclosures and any deferred-maintenance estimates?
- Built in 1893 — when were the roof, HVAC, electrical panel, plumbing, and water heater last replaced?
- Is there a deadline driving the sale (1031 exchange, divorce, estate, relocation)? That informs how much negotiation room exists.
- Schools are D-rated, which usually means shorter tenancies and higher turnover. Who's the typical renter profile here, and what's been the actual vacancy rate?
- What's the average days-on-market for RENTAL listings here right now (not sales)? A rising rental-DOM trend means longer vacancies and softer asking-rent achievability than the comps imply.
- What's the recent tenant-quality profile in this submarket — average credit score on applications, eviction rate, late-payment / NSF rate, and stable-employment percentage? A property-management company in the area should have these aggregated.
- How much new apartment / multifamily construction is in the pipeline within 1–3 miles? Heavy new supply (>2% of stock underway) typically softens rents 12–24 months out; light construction supports rent growth.
Investment metrics
- 1% rule
- 1.32% ✓
- Cap rate
- 10.49%
- Cash-on-cash
- 15.00%
- DSCR
- 1.67
- GRM
- 6.3
CMA / ARV
- ARV (on-the-fly)
- $443,072
- Comps found
- 4
Show comp detail 4 sales within ~0.75 mi
| Address | Dist | Beds/Ba | Sqft | Sold | Price | $/sf | Match |
|---|---|---|---|---|---|---|---|
| 12 Church St | 0.29mi | 7/3.0 | 2,370 (-2%) | 20mo | $430,000 | $181 | 63 |
| 30 Central St | 0.35mi | 4/2.0 | 2,232 (-7%) | 17mo | $354,900 | $159 | 57 |
| 37 Grove St | 0.33mi | —/3.0 | 2,740 (+14%) | 7mo | $505,000 | $184 | 52 |
| 9 Water St | 0.40mi | 5/2.0 | 2,100 (-13%) | 14mo | $511,000 | $243 | 48 |
Match score weights: distance 35% · size 25% · config 20% · recency 20%. Top-matched comps best support the ARV.
Projected returns pro-forma
-3.0% appreciation · 3.0% rent growth · sell at horizon
- IRR
- 5.6%
- Equity multiple
- 1.22×
- Total profit
- $20,527
- Equity at exit
- $50,099
- IRR
- 15.0%
- Equity multiple
- 2.22×
- Total profit
- $114,600
- Equity at exit
- $29,051
Cash invested: $94,080 (down + closing). Projections, not guarantees.
Landlord ↔ Tenant lean methodology
- Overall (STATE)
- 56 Moderately Landlord-Leaning
- State New Hampshire
- 56 Moderately Landlord-Leaning · D+1
- County
- — inherits STATE
- City
- — inherits STATE
ZIP-level market 03835
- Home prices YoY
- -19.1%
- Active inventory
- 35
- Price-to-rent
- 12.6×
Monthly cashflow live
- Estimated rent
- $4,428 high interval (Pro) →
- Mortgage (P&I)
- −$1,762
- Tax est. 1.5%
- −$420 /mo · $5,040/yr
- Insurance
- −$140
- HOA
- −$0
- Vacancy / Maint / Mgmt
- −$930
- Net cashflow
- $1,176
Break-even live
2-unit breakdown (identical units grouped — click to expand)
| Units | Beds | Baths | Est. rent |
|---|---|---|---|
| 2× units | 3 | 1.5 | $4,428 |
| #1 | 3 | 1.5 | $2,214 |
| #2 | 3 | 1.5 | $2,214 |
| Total (2 units) | $4,428 | ||
UW: 25.0% down · 7.5% · 30yr · 1.5% tax · 5.0% vac · 8.0% maint · 8.0% mgmt
Financing live
Cash to close
- Down payment
- $84,000
- Closing costs
- $10,080
- Reserves months
- —
- Total cash needed
- —
Loan-product check · same deal, 3 products live
Conventional
25% down · 7.5% · 30yr
- Down + closing
- —
- Monthly P&I
- —
- Monthly cashflow
- —
- DSCR
- —
- Eligible?
- —
Personal DTI + credit; lowest rate.
DSCR
20% down · 8.5% · 30yr
- Down + closing
- —
- Monthly P&I
- —
- Monthly cashflow
- —
- DSCR
- —
- Eligible?
- —
No personal income docs; deal must DSCR.
Hard money
10% down · 12.0% · 12mo
- Down + closing
- —
- Monthly P&I
- —
- Monthly cashflow
- —
- DSCR
- —
- Eligible?
- —
Short-term bridge; refi at stabilization.
Listing history 4 events
-
2026-05-01status Pending
-
2026-04-01$336,000 Active
-
2026-03-30price $336,000
-
2025-10-22price $369,000
ⓘ Source: listings_history table (triggers on properties + properties_extension) + one-shot
backfill from property_details.listing_events for pre-trigger history.
Nearby sold comps map
Loading sold comps map…
Walkable amenities ~0.75 mi
Loading nearby amenities…
Taxation est. · year 1
- Rental income
- $53,136
- − Mortgage interest
- −$18,821
- − Property taxes
- −$5,040
- − Insurance
- −$1,680
- − Repairs & maintenance
- −$4,251
- − Management
- −$4,251
- − Depreciation
- −$9,775
- Taxable income
- $9,318
- Est. tax owed @ 24.0%
- −$2,236
- After-tax cash flow
- $11,877/yr
For passive investors: Depreciation is non-cash, so a rental often shows a tax loss while cash-flowing — sheltering income. Rental losses are passive: they offset passive income freely, and up to $25,000/yr can offset ordinary (W-2) income if you actively participate and your MAGI is under $100k (phasing out to $0 by $150k); unused losses carry forward. On sale, claimed depreciation is recaptured at up to 25%, and gains may owe capital-gains tax (a 1031 exchange can defer both). Figures are a year-1 estimate at your 24.0% rate — not tax advice; consult a CPA.
Condition & rehab AI · 13 photos
This property requires moderate renovations to update the kitchen and bathrooms, repair the roof, and improve the overall appearance. It has potential for significant value increase with these updates.
Repairs flagged
- Moderate kitchen cabinets — dated and worn
- Moderate bathroom fixtures — basic and dated
- Moderate roof shingles — visible wear
Value-add opportunities
- Both update kitchen cabinets and appliances — modernizing kitchen will appeal to both buyers and renters
- Both replace bathroom fixtures — modernizing bathrooms will appeal to both buyers and renters
- Both repair and re-shingle roof — improving roof will increase property value and reduce maintenance costs
Renovation cost estimate screening
| Repair item | Severity | Est. cost |
|---|---|---|
| kitchen cabinets · dated and worn | Moderate | $3,000–15,000 |
| bathroom fixtures · basic and dated | Moderate | $3,000–15,000 |
| roof shingles · visible wear | Moderate | $3,000–15,000 |
| Total estimated repair cost · 3 items | $9,000–45,000 |
Value-add ROI direction
- Both update kitchen cabinets and appliances — modernizing kitchen will appeal to both buyers and renters ↑
- Both replace bathroom fixtures — modernizing bathrooms will appeal to both buyers and renters ↑
- Both repair and re-shingle roof — improving roof will increase property value and reduce maintenance costs ↑
ⓘ Cost ranges are severity-bucket heuristics (US national rule-of-thumb). Get contractor quotes + a written scope before underwriting a rehab budget.
Schools (NCES district)
- District
- Farmington School District
- NCES district ID
- 3303000
- Math proficiency
- 20% ▼ -8.00%
- Reading proficiency
- 36% ▼ -4.00%
- Median HH income
- $52,860
- Composite
- 24.76/100
- National rank
- #7602
- State rank
- #86 of 98 in NH
Livability — Farmington
- Score
- 64/100
- State rank
- #79
- US rank
- #13784
Category grades
Schools grade is shown separately in the Schools card above.
Census & demographics
- Census place
- Farmington, NH
- County
- Strafford County · 75,181 people
- City population
- 6,804
- Metro
- Boston-Cambridge-Newton, MA-NH
- Population (ZIP)
- 6,804
- Household income
- $66,982
- Rent vs Own
- Severe rent burden
- 201.0
Population outlook (Strafford County) Hauer SSP2
- Today (2025)
- 132,503 people
- By 2030
- 135,377 · +2.2%
- By 2040
- 139,609 · +5.4%
- By 2050
- 141,803 · +7.0%
- By 2075
- 149,280 · +12.7%
- By 2100
- 148,667 · +12.2%
Race, ethnicity, and origin ACS 2023
- Neighborhood character
- Predominantly White (92%)
- Race & ethnicity
- White 92% Two or more races 3% Asian 3% Black 1%
- Common ancestry
- Lithuanian 14% Italian 3% Romanian 2%
- Foreign-born
- 4% · Canada
Political lean MEDSL · Strafford
- 2024 margin
- D (+12.1) · D 55.5% · R 43.5% · Other 1.0%
- 2008→2024 swing
- -8.3pp toward R · 2008: 20.4pp · 2024: 12.1pp
- All cycles
- 2024: D+12.1 2020: D+15.2 2016: D+8.6 2012: D+14.5 2008: D+20.4
Not yet ingested
- Civics
- —
Market trends
- HPI YoY
- ▼ -55.63%
- Current HPI
- 235.4884
- Rent YoY
- —
- Metro
- Boston-Cambridge-Newton, MA-NH
- State GDP YoY
- —
- F500 in state
- 0
Price history
-8.9% since first listed4 events — show timeline
- 2026-05-01 Pending — PrimeMLS
- 2026-04-01 Listed $336,000 PrimeMLS
- 2026-03-30 Price Changed $336,000 PrimeMLS
- 2025-10-22 Price Changed $369,000 PrimeMLS
Cash-flow waterfall
monthlySold comps — $/sqft
last 12 mo · ≤1 miLoading sold comps…