 🌊 Lakefront
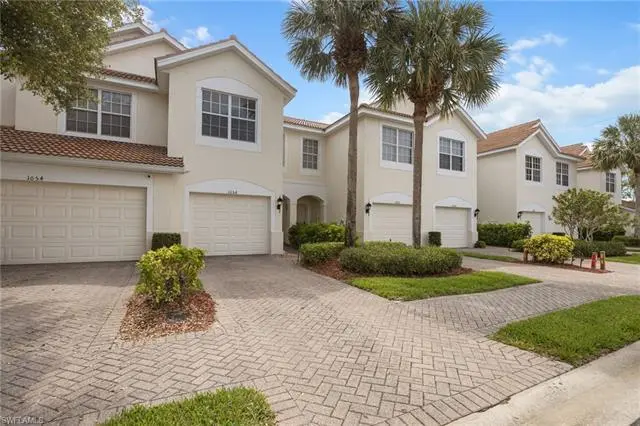
1058 Albany Ct · Naples, FL
Flood risk 1/10 · Minimal
- FEMA flood zone
- X (unshaded)
- Chance of flooding over 30 yrs
- 0.0%
- Est. flood insurance / yr
- $507 – $1,088
Fire risk 1/10 · Minimal
- Est. fire insurance / yr
- $947 – $1,759
Heat risk 9/10 · Severe
- Hot days now (above 107°F)
- 5 days/yr
- Hot days in 30 yrs
- 19 days/yr
Wind risk 10/10 · Severe
- Chance of severe wind over 30 yrs
- 99.0%
Air-quality risk 2/10 · Minimal
- Unhealthy air days now
- 2 days/yr
- Unhealthy air days in 30 yrs
- 2 days/yr
Risk factors via First Street. Map © Google.
Why this score? — see what drove the D grade
The composite is a weighted blend of 9 inputs, each scored 0–100. Each bar is that input's sub-score; the figure is the points it added to the 100-point composite (weight × sub-score).
- Cash flow +12.3/30.0
- ARV discount +7.5/15.0
- 1% rule +5.1/10.0
- Schools +5.0/10.0
- Livability +4.0/5.0
- Condition / age +4.0/5.0
- DSCR +3.7/10.0
- Rent growth +2.7/5.0
- Appreciation +0.0/10.0
$390,000
🖨 Deal sheet (PDF) 📄 Offer letter ✓ Due diligence
Listing remarks
Freshly updated and move-in ready, this three-bedroom, two-and-a-half-bath townhouse in Stratford Place offers a stylish blend of comfort, functionality and modern finishes in a highly convenient Naples location just off Pine Ridge Road. Inside, the home feels bright and cohesive with a fresh repaint and luxury vinyl flooring carried throughout the entire property, creating a clean, low-maintenance look from the main living areas to the upstairs bedrooms. The kitchen serves as the centerpiece of the home, featuring quartz countertops, a spacious island with added storage, stainless steel appliances, generous cabinetry, and a large stainless sink with water filtration. The main-level half ba
Key facts
- Spacious island
- Marble flooring
- Quartz countertops
Tags
Property features AI
Finance
- Other: Part of an 80-unit complex with 4 units per building and 2 floors; Unit located in sub-condo Pinehurst; Deeded restrictions; Central irrigation
- HOA & community: Mandatory HOA; Quarterly master HOA fee; Master HOA fee (quarterly) totaling $1,456; Annual recurring HOA fees totaling $5,824; Professional management; HOA maintenance covers cable, internet/WiFi, irrigation water, lawn/land maintenance, legal/accounting, manager, exterior pest control, recreation facilities, and reserves; Community amenities include basketball court, bike and jog path, community pool and spa/hot tub
Exterior
- Parking: Attached garage with 1 garage space
- Security: Gated community
- Utilities: Central water; Central sewer; Cable available
- Home design: Attached villa (2-story); Rear exposure facing east; Residential property in Stratford Place (unit 197)
- Construction: Concrete block construction; Stucco exterior; Tile roof; Built in 2005
- Exterior features: Patio; Pond with water feature; Lake/water view; Sliding windows; Shutters
Interior
- Kitchen: Kitchen island; Pantry; Electric cooktop; Dishwasher; Disposal; Refrigerator/freezer
- Bedrooms: 3 bedrooms
- Flooring: Marble; Tile; Vinyl
- Bathrooms: 2 full bathrooms; 1 half bathroom; Master bathroom with dual sinks and shower (no tub)
- Heating & cooling: Central electric heat; Central electric cooling
- Interior features: Fire sprinkler system; Smoke detectors; Walk-in closet; Island and pantry in kitchen; Dining (family); Guest bath and guest room; Screened lanai/porch; Furnished
- Laundry & utility: Laundry in residence; Washer and dryer; Auto garage door
Neighborhood map
What this means for you Summary
Snapshot
- This is a 3-bed/2.5-bath single-family listed at $390k. Condition is rated good.
Deal economics
- At list price, monthly cash flow is $-70 ($-836/yr) — negative.
- To cash-flow at today's rent, offer at most $380k (2.6% below list).
- Meets the 1% rule at list price ($4k rent vs $390k).
- Recommended offer: $380k (2.6% below list) — sets the bar for cash-flow.
Location & tenants
- Location reads 80/100 on livability (#126 in FL, #1,903 nationally) — a professional / high-income tenant draw. Strengths: crime A+, amenities A+, employment A+; Watch: commute D+, cost of living F.
- Collier (suburban): math 60% / reading 56% proficiency, ranked #16 of 73 in FL (top 22%) — acceptable for families but not a draw, mixed tenant base, ~2y average lease.
- Zoned schools: Osceola Elementary School (math 78% / reading 74%, grade A, #198 of 2,144 statewide, top 10%, 621 students, 32% FRL); Pine Ridge Middle School (math 74% / reading 70%, grade A, #52 of 571 statewide, top 10%, 832 students, 31% FRL); Barron Collier High School (math 62% / reading 68%, grade B, #76 of 667 statewide, top 11%, 1,650 students, 26% FRL) — zoned schools average 30% FRL vs 55% district-wide (25 pts lower); this property's tenant base skews higher-income than the district average.
- Zoned-school proficiency averages 71% at this address vs 58% district-wide (+13 pts) — the actual schools serving this property are materially stronger than the Collier average implies; a family-tenant draw the district grade alone would hide.
- Market conditions: Rents flat; 334 active listings in the ZIP; 40 comparable units currently listed for rent nearby; rentals at typical pace (median 26d on market — plan ~3-4 weeks tenant-placement turnaround); solid renter incomes; 3,520 units permitted in Collier County in 2024 (959 in 5+ unit buildings).
- At $3,937/mo this rent would consume 51% of the median local household income ($92k/yr) (locally 780% of renters already pay >50% of income on rent) — very limited rent-growth headroom before tenants either downsize or default.
Forward outlook
- Local home prices are declining (-3.0%/yr); year-one equity from $3k of loan paydown is wiped out by about $12k of value loss. Plan a longer hold.
- Collier County population projected at +30% by 2050 — long-run rental-demand tailwind backs the buy-and-hold thesis.
Negotiation context
- Only 9 days on market — expect competitive offers; lowballing is unlikely to land.
Risks & watch-outs
- Climate carrying-cost: severe wind risk, 99% chance of damaging wind over 30y; extreme-heat days projected 5→19/yr by 2055 (HVAC capex compounding) — expect insurance premiums to compound above CPI over the hold.
Questions for the listing agent
- What do current leases actually rent for vs. the listed asking? Can we see a recent rent roll and the last 12 months of T-12 income?
- What does the HOA fee cover, when was the last increase, and are there any pending special assessments or reserve-fund shortfalls?
- Is there a deadline driving the sale (1031 exchange, divorce, estate, relocation)? That informs how much negotiation room exists.
- Schools are B-rated — typically a magnet for longer-tenancy family renters. What's the average tenant stay here, and is there a school-zone premium baked into asking?
- The area grade is low — what's the realistic commute time and amenity access for the typical tenant pool here? Any planned neighborhood developments (good or bad) we should know about?
- This sits on a lake — are riparian / water-frontage rights deeded with the parcel? Any dock permits, shoreline easements, or HOA water-use restrictions?
- What's the documented flood / surge / shoreline-erosion history here (FEMA AND non-FEMA — e.g., storm surge, creek backup, septic-field saturation)?
- Any water-quality or seasonal algae-bloom issues that affect tenant satisfaction or short-term-rental demand?
- What's the average days-on-market for RENTAL listings here right now (not sales)? A rising rental-DOM trend means longer vacancies and softer asking-rent achievability than the comps imply.
- What's the recent tenant-quality profile in this submarket — average credit score on applications, eviction rate, late-payment / NSF rate, and stable-employment percentage? A property-management company in the area should have these aggregated.
- How much new for-sale + rental construction is in the pipeline within 1–3 miles? Heavy new supply typically softens prices + rents 12–24 months out; constrained supply supports both.
Investment metrics
- 1% rule
- 1.01% ✓
- Cap rate
- 6.08%
- Cash-on-cash
- -0.77%
- DSCR
- 0.97
- GRM
- 8.3
CMA / ARV
- ARV (on-the-fly)
- $1,049,436
- Comps found
- 1
Show comp detail 1 sale within ~0.75 mi
| Address | Dist | Beds/Ba | Sqft | Sold | Price | $/sf | Match |
|---|---|---|---|---|---|---|---|
| 5820 Lancewood Way | 0.89mi | 3/3.0 | 1,422 (-10%) | 3mo | $700,000 | $492 | 44 |
Match score weights: distance 35% · size 25% · config 20% · recency 20%. Top-matched comps best support the ARV.
Projected returns pro-forma
-3.0% appreciation · 0.85% rent growth · sell at horizon
- IRR
- -20.3%
- Equity multiple
- 0.31×
- Total profit
- $-75,615
- Equity at exit
- $58,150
- IRR
- -20.1%
- Equity multiple
- 0.06×
- Total profit
- $-102,880
- Equity at exit
- $33,720
Cash invested: $109,200 (down + closing). Projections, not guarantees.
Landlord ↔ Tenant lean methodology
- Overall (STATE)
- 87 Strongly Landlord-Friendly
- State Florida
- 87 Strongly Landlord-Friendly · R+3
- County
- — inherits STATE
- City
- — inherits STATE
ZIP-level market 34105
- Home prices YoY
- -30.5%
- Rents YoY
- 0.8%
- Active inventory
- 334
- Price-to-rent
- 8.3×
Monthly cashflow live
- Estimated rent
- $3,937 high interval (Pro) →
- Mortgage (P&I)
- −$2,045
- Tax est. 1.5%
- −$488 /mo · $5,850/yr
- Insurance
- −$162
- HOA
- −$485
- Vacancy / Maint / Mgmt
- −$827
- Net cashflow
- $-70
Break-even live
Sensitivity live
| Price | -10% $200 | -5% $65 | +0% $-70 | +5% $-204 | +10% $-339 |
|---|---|---|---|---|---|
| Rent | -10% $-381 | -5% $-225 | +0% $-70 | +5% $86 | +10% $241 |
| Rate | -1.0pp $127 | -0.5pp $30 | base $-70 | +0.5pp $-171 | +1.0pp $-274 |
UW: 25.0% down · 7.5% · 30yr · 1.5% tax · 5.0% vac · 8.0% maint · 8.0% mgmt
Financing live
Cash to close
- Down payment
- $97,500
- Closing costs
- $11,700
- Reserves months
- —
- Total cash needed
- —
Loan-product check · same deal, 3 products live
Conventional
25% down · 7.5% · 30yr
- Down + closing
- —
- Monthly P&I
- —
- Monthly cashflow
- —
- DSCR
- —
- Eligible?
- —
Personal DTI + credit; lowest rate.
DSCR
20% down · 8.5% · 30yr
- Down + closing
- —
- Monthly P&I
- —
- Monthly cashflow
- —
- DSCR
- —
- Eligible?
- —
No personal income docs; deal must DSCR.
Hard money
10% down · 12.0% · 12mo
- Down + closing
- —
- Monthly P&I
- —
- Monthly cashflow
- —
- DSCR
- —
- Eligible?
- —
Short-term bridge; refi at stabilization.
Rent comps 40 comps
| Address | Beds | Baths | Sqft | Rent | $/sqft | DOM | Units | Dist |
|---|---|---|---|---|---|---|---|---|
| 836 Hampton Cir #171 Naples, FL | 3.0 | 2.5 | 1580 | $5,000 | $3.16 | 23d | 1 | 0.13mi |
| 836 Hampton Cir #171 Naples, FL | 3.0 | 2.5 | 1580 | $5,000 | $3.16 | 25d | 1 | 0.13mi |
| 1299 Verde Dr Unit 1503 Naples, FL | 3.0 | 2.0 | 1744 | $4,200 | $2.41 | 15d | 1 | 0.29mi |
| 1303 Verde Dr Unit 1603 Naples, FL | 3.0 | 2.0 | 1877 | $2,500 | $1.33 | 15d | 1 | 0.31mi |
| 1256 Carpazi Ct #502 Naples, FL | 3.0 | 2.0 | 1744 | $2,495 | $1.43 | 25d | 1 | 0.35mi |
| 1256 Carpazi Ct Unit 502 Naples, FL | 3.0 | 2.0 | 1744 | $2,495 | $1.43 | 15d | 1 | 0.35mi |
| 1205 Reserve Way #302 Naples, FL | 3.0 | 2.0 | 1239 | $2,300 | $1.86 | 15d | 1 | 0.44mi |
| 12839 Carrington Cir Unit 8-102 Naples, FL | 3.0 | 2.0 | 2063 | $6,500 | $3.15 | 25d | 1 | 0.44mi |
| 1115 Reserve Ct Unit 2 Naples, FL | 2.0 | 2.0 | 1100 | $1,800 | $1.64 | 15d | 1 | 0.47mi |
| 1105 Reserve Ct #307 Naples, FL | 3.0 | 2.0 | 1239 | $1,995 | $1.61 | 15d | 1 | 0.48mi |
| 1105 Reserve Ct #206 Naples, FL | 2.0 | 2.0 | 1100 | $2,000 | $1.82 | 15d | 1 | 0.48mi |
| 1220 Reserve Way #305 Naples, FL | 2.0 | 2.0 | 1059 | $1,950 | $1.84 | 25d | 1 | 0.48mi |
| 1190 Reserve Way #304 Naples, FL | 2.0 | 2.0 | 1059 | $2,900 | $2.74 | 25d | 1 | 0.53mi |
| 1180 Reserve Way Naples, FL | 1.0–2.0 | 1.0–2.0 | 954 | $2,000 | $2.10 | 25d | 2 | 0.53mi |
| 1180 Reserve Way Naples, FL | 1.0–2.0 | 1.0–2.0 | 912 | $1,990 | $2.18 | 15d | 3 | 0.53mi |
| 6542 Marbella Dr Naples, FL | 3.0 | 2.5 | 2144 | $6,250 | $2.92 | 25d | 1 | 0.57mi |
| 13078 Pembroke Dr Naples, FL | 3.0 | 2.5 | 2024 | $6,500 | $3.21 | 25d | 1 | 0.62mi |
| 12914 Brynwood Preserve Ln Naples, FL | 2.0 | 2.0 | 1720 | $7,000 | $4.07 | 25d | 1 | 0.66mi |
| 12902 Brynwood Preserve Ln Naples, FL | 3.0 | 3.0 | 2100 | $7,500 | $3.57 | 25d | 1 | 0.69mi |
| 12832 Brynwood Way Naples, FL | 3.0 | 2.0 | 1714 | $5,250 | $3.06 | 15d | 1 | 0.73mi |
| 3105 La Costa Cir Naples, FL | 1.0–3.0 | 1.0–2.0 | 1050 | $2,235 | $2.13 | 15d | 20 | 1.06mi |
| 104 Siena Way #1407 Naples, FL | 2.0 | 2.0 | 1450 | $7,000 | $4.83 | 25d | 1 | 1.08mi |
| 106 Siena Way #1508 Naples, FL | 2.0 | 2.0 | 1414 | $4,500 | $3.18 | 25d | 1 | 1.09mi |
| 103 Tuscana Ct #1107 Naples, FL | 2.0 | 2.0 | 1412 | $5,000 | $3.54 | 25d | 1 | 1.12mi |
| 6025 Chardonnay Ln Unit 1Unit 102 Naples, FL | 2.0 | 2.0 | 1414 | $2,195 | $1.55 | 25d | 1 | 1.15mi |
| 102 Tuscana Ct #901 Naples, FL | 2.0 | 2.0 | 1631 | $2,300 | $1.41 | 25d | 1 | 1.15mi |
| 155 Vintage Cir #103 Naples, FL | 2.0 | 2.0 | 1500 | $5,000 | $3.33 | 15d | 1 | 1.16mi |
| 172 Vintage Cir #202 Naples, FL | 3.0 | 2.0 | 1774 | $5,195 | $2.93 | 15d | 1 | 1.17mi |
| 230 Vintage Cir Unit A-404 Naples, FL | 2.0 | 2.0 | 1290 | $5,000 | $3.88 | 15d | 1 | 1.19mi |
| 3099 Lancaster Dr Unit 7-701 Naples, FL | 2.0 | 2.0 | 2160 | $10,000 | $4.63 | 25d | 1 | 1.21mi |
| 210 Vintage Cir Unit C401 Naples, FL | 3.0 | 2.0 | 1520 | $6,500 | $4.28 | 15d | 1 | 1.23mi |
| 200 Vintage Cir Unit D304 Naples, FL | 3.0 | 2.0 | 1492 | $2,800 | $1.88 | 15d | 1 | 1.26mi |
| 3255 Tamara Dr #4 Naples, FL | 3.0 | 2.5 | 1437 | $2,500 | $1.74 | 15d | 1 | 1.28mi |
| 152 Napa Ridge Way Naples, FL | 3.0 | 2.0 | 1775 | $7,000 | $3.94 | 25d | 1 | 1.29mi |
| 5460 Laurel Ridge Ln Naples, FL | 3.0 | 2.0 | 1105 | $2,400 | $2.17 | 25d | 4 | 1.30mi |
| 116 Fountain Cir Naples, FL | 3.0 | 2.0 | 1561 | $4,500 | $2.88 | 25d | 1 | 1.31mi |
| 3250 Cypress Glen Way Naples, FL | 2.0 | 2.0 | 1242 | $3,300 | $2.66 | 23d | 3 | 1.32mi |
| 3250 Cypress Glen Way Naples, FL | 2.0 | 2.0 | 1191 | $3,488 | $2.93 | 25d | 2 | 1.32mi |
| 3268 Amanda Ln #3 Naples, FL | 3.0 | 2.5 | 1437 | $2,350 | $1.64 | 15d | 1 | 1.34mi |
| 3225 Cypress Glen Way #105 Naples, FL | 2.0 | 2.0 | 1191 | $2,900 | $2.43 | 25d | 1 | 1.35mi |
HOA detail
- Monthly dues
- $485 · $5,820/yr
- Likely covers
- water
Listing history 7 events
-
2026-06-21days on market $390,000 Active 9 DOM
-
2026-06-18days on market $390,000 Active 6 DOM
-
2026-06-17days on market $390,000 Active 5 DOM
-
2026-06-16days on market $390,000 Active 4 DOM
-
2026-06-15days on market $390,000 Active 3 DOM
-
2026-06-14remarks 699-char remark
-
2026-06-14$390,000 Active 1 DOM
ⓘ Source: listings_history table (triggers on properties + properties_extension) + one-shot
backfill from property_details.listing_events for pre-trigger history.
Climate risk First Street
- Flood 1/10 Low FEMA zone X (unshaded) · 0% chance over 30 yrs
- Wildfire 1/10 Low
- Heat 9/10 Extreme 5 d/yr ≥107°F today · 19 d/yr by 30 yrs out
- Wind 10/10 Extreme 99% chance of damaging wind over 30 yrs
- Air quality 2/10 Low 2 unhealthy d/yr today · 2 by 30 yrs out
Nearby sold comps map
Loading sold comps map…
Walkable amenities ~0.75 mi
Loading nearby amenities…
Taxation est. · year 1
- Rental income
- $47,249
- − Mortgage interest
- −$21,846
- − Property taxes
- −$5,850
- − Insurance
- −$1,950
- − Repairs & maintenance
- −$3,780
- − Management
- −$3,780
- − HOA
- −$5,820
- − Depreciation
- −$11,345
- Taxable loss
- −$7,123
- Est. tax savings @ 24.0%
- +$1,709
- After-tax cash flow
- $873/yr
For passive investors: Depreciation is non-cash, so a rental often shows a tax loss while cash-flowing — sheltering income. Rental losses are passive: they offset passive income freely, and up to $25,000/yr can offset ordinary (W-2) income if you actively participate and your MAGI is under $100k (phasing out to $0 by $150k); unused losses carry forward. On sale, claimed depreciation is recaptured at up to 25%, and gains may owe capital-gains tax (a 1031 exchange can defer both). Figures are a year-1 estimate at your 24.0% rate — not tax advice; consult a CPA.
Condition & rehab AI · 12 photos
This move-in ready, freshly updated three-bedroom townhouse in Stratford Place offers a stylish blend of comfort, functionality, and modern finishes in a highly convenient location.
Value-add opportunities
- Both Painting exterior and interior walls — Fresh paint enhances curb appeal and interior aesthetics
- Both Landscaping and curb appeal improvements — Enhances curb appeal and adds value
- Both Replace light fixtures with energy-efficient ones — Saves on energy costs and enhances curb appeal
Renovation cost estimate screening
Value-add ROI direction
- Both Painting exterior and interior walls — Fresh paint enhances curb appeal and interior aesthetics ↑
- Both Landscaping and curb appeal improvements — Enhances curb appeal and adds value ↑
- Both Replace light fixtures with energy-efficient ones — Saves on energy costs and enhances curb appeal ↑
ⓘ Cost ranges are severity-bucket heuristics (US national rule-of-thumb). Get contractor quotes + a written scope before underwriting a rehab budget.
Schools (NCES district)
- District
- Collier
- NCES district ID
- 1200330
- Math proficiency
- 60% ▼ -4.00%
- Reading proficiency
- 56% ▼ -2.00%
- Median HH income
- $58,275
- Composite
- 50.23/100
- National rank
- #1892
- State rank
- #16 of 73 in FL
Livability — Naples
- Score
- 80/100
- State rank
- #126
- US rank
- #1903
Category grades
Schools grade is shown separately in the Schools card above.
Census & demographics
- County
- Collier County · 396,295 people
- City population
- 344,941
- Metro
- Naples-Marco Island, FL
- Population (ZIP)
- 15,441
- Household income
- $92,214
- Rent vs Own
- Severe rent burden
- 780.0
Population outlook (Collier County) Hauer SSP2
- Today (2025)
- 420,858 people
- By 2030
- 450,054 · +6.9%
- By 2040
- 502,232 · +19.3%
- By 2050
- 544,932 · +29.5%
- By 2075
- 627,203 · +49.0%
- By 2100
- 659,015 · +56.6%
Race, ethnicity, and origin ACS 2023
- Neighborhood character
- Predominantly White (79%)
- Race & ethnicity
- White 79% Hispanic / Latino 14% Two or more races 7% Asian 5%
- Hispanic origin (detail)
- Mexican 3% Puerto Rican 1% Cuban 3% Salvadoran 1%
- Common ancestry
- Romanian 3% Lithuanian 3% Italian 3%
- Foreign-born
- 22% · Canada, China, Jamaica
- Languages at home
- 77% English-only · Spanish 11% Other Indo-European 3% Russian/Polish/Slavic 3%
Political lean MEDSL · Collier
- 2024 margin
- Solid R (+33.1) · D 33.1% · R 66.2%
- 2008→2024 swing
- -10.6pp toward R · 2008: -22.5pp · 2024: -33.1pp
- All cycles
- 2024: R+33.1 2020: R+24.7 2016: R+26.0 2012: R+30.1 2008: R+22.5
Not yet ingested
- Civics
- —
Market trends
- HPI YoY
- ▼ -124.65%
- Current HPI
- 283.9084
- Rent YoY
- ▲ 0.85%
- Metro
- Naples-Marco Island, FL
- State GDP YoY
- ▲ 3.28%
- F500 in state
- 36
Industry mix (Fortune 500 HQ in FL)
| Industry | F500 HQs | Revenue |
|---|---|---|
| Industrial Technology | 2 | $29B |
|
||
| Insurance | 2 | $17B |
|
||
| Retail | 1 | $60B |
|
||
| Technology Distribution | 1 | $58B |
|
||
| Homebuilding | 1 | $35B |
|
||
| Technology Manufacturing | 1 | $35B |
|
||
Price history
1 event — show timeline
- 2026-06-12 Listed $390,000 NAPLESMLS
Cash-flow waterfall
monthlySold comps — $/sqft
last 12 mo · ≤1 miLoading sold comps…