 Multi-family
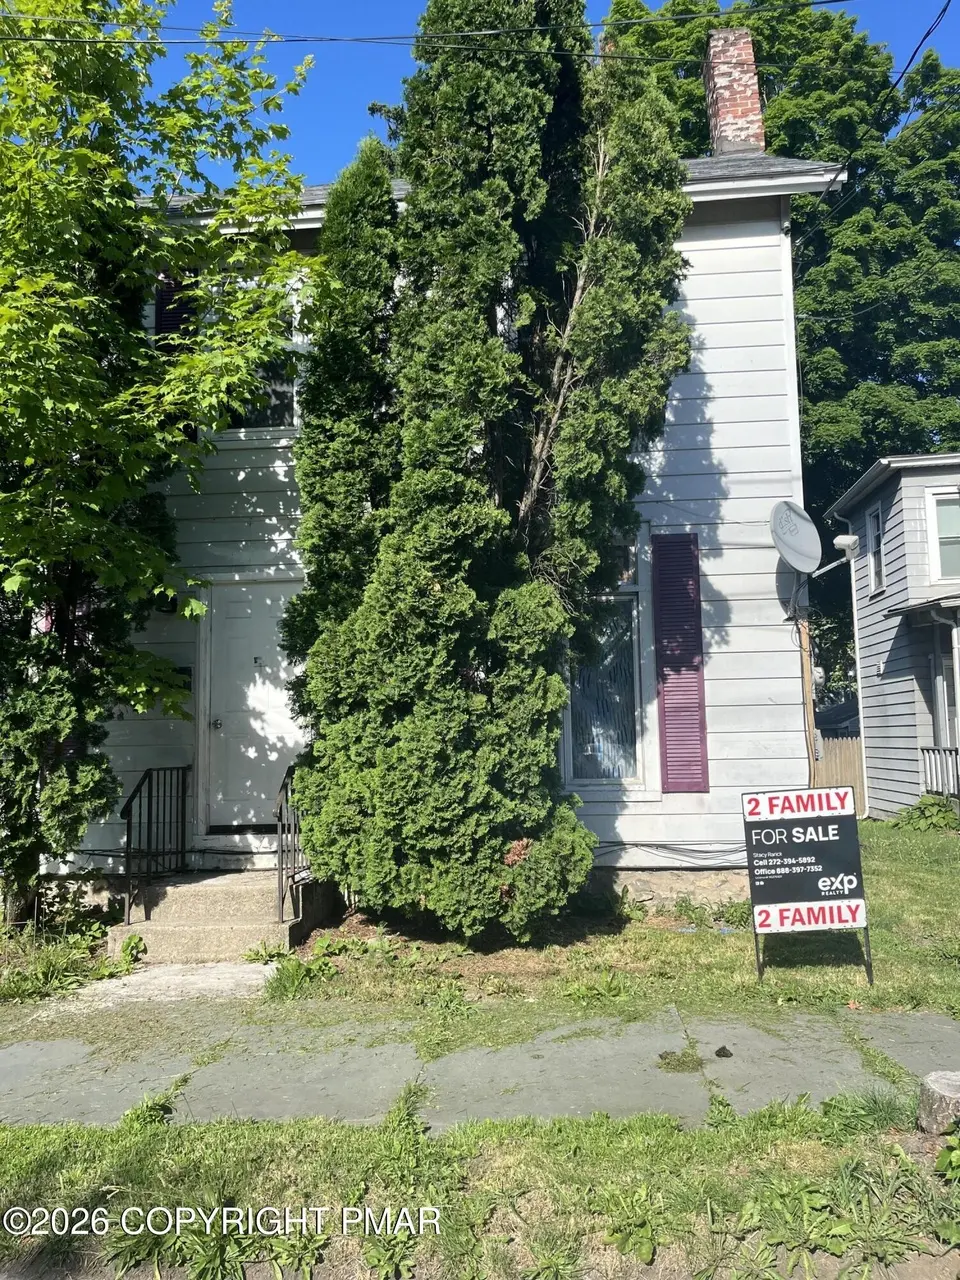
202 N Courtland St · East Stroudsburg, PA
Flood risk 1/10 · Minimal
- FEMA flood zone
- X (unshaded)
- Chance of flooding over 30 yrs
- 0.0%
- Est. flood insurance / yr
- $473 – $860
Fire risk 1/10 · Minimal
- Est. fire insurance / yr
- $511 – $949
Heat risk 4/10 · Minor
- Hot days now (above 99°F)
- 7 days/yr
- Hot days in 30 yrs
- 16 days/yr
Wind risk 4/10 · Minor
- Chance of severe wind over 30 yrs
- 11.0%
Air-quality risk 2/10 · Minimal
- Unhealthy air days now
- 1 days/yr
- Unhealthy air days in 30 yrs
- 2 days/yr
Risk factors via First Street. Map © Google.
Why this score? — see what drove the B- grade
The composite is a weighted blend of 9 inputs, each scored 0–100. Each bar is that input's sub-score; the figure is the points it added to the 100-point composite (weight × sub-score).
- Cash flow +27.4/30.0
- DSCR +9.6/10.0
- 1% rule +7.5/10.0
- ARV discount +7.5/15.0
- Rent growth +5.0/5.0
- Livability +4.2/5.0
- Schools +3.0/10.0
- Condition / age +2.5/5.0
- Appreciation +0.0/10.0
$299,000
🖨 Deal sheet 📄 Offer letter ✓ Due diligence
Multi-family units
County records classify this as Multi-Family (2-4 Unit). Listing-text estimate: 1 unit. estimate disagrees with records
Listing remarks
Great investment opportunity!!! Multi family home with a one-bedroom apartment downstairs and a three-bedroom apartment upstairs. Off street parking for multiple vehicles and separate entrances for both apartments. Live in one or rent out both. Located in the heart of East Stroudsburg, conveniently surrounded by many restaurants, shopping, and entertainment options.
Key facts
- Multi family home
- Off street parking
- Separate entrances
Tags
Property features AI
Finance
- Other: Zoned R-3 (multi-family)
- Financial info: Tax information available
Exterior
- Parking: 4 off-street/on-site open parking spaces
- Utilities: Public water; Public sewer; Phone available; Cable available
- Home design: Single family residence (residential property); No common walls; City street frontage; Paved, publicly maintained road
- Construction: Aluminum siding
- Exterior features: Rear enclosed porch; Back yard
Interior
- Kitchen: Refrigerator
- Bedrooms: 10 total rooms (includes bedroom and living spaces); Basement with walk-up access
- Flooring: Wood flooring
- Bathrooms: 2 full bathrooms
- Heating & cooling: Baseboard heating; Electric heating
- Interior features: In-law floorplan; Private entrance
- Laundry & utility: Unfurnished
Neighborhood map
What this means for you Summary
Snapshot
- This is a 4-bed/2.0-bath multifamily listed at $299k.
Deal economics
- At list price, monthly cash flow is $879 ($11k/yr) — positive.
- The deal already cash-flows at list — no discount required.
- Meets the 1% rule at list price ($4k rent vs $299k).
- Cap rate 9.8% vs local median 3.6% in East Stroudsburg — top-decile yield for the area; either an underpriced asset or a hidden risk that comps aren't pricing in. Stress-test before assuming the spread holds.
Location & tenants
- Location reads 84/100 on livability (#108 in PA, #833 nationally) — a professional / high-income tenant draw. Strengths: commute A+, cost of living A+, housing A+.
- East Stroudsburg Area SD (rural): math 25% / reading 43% proficiency, ranked #413 of 539 in PA (top 77%) — families likely to look elsewhere, expect single-tenant / working-renter base with shorter leases.
- Market conditions: Rents rising fast (+10.4%/yr); 196 active listings in the ZIP; 7 comparable units currently listed for rent nearby; rentals lingering (median 44d on market — plan ~5-8 weeks vacancy on turnover, expect pricing pressure); 86% of comp listings sitting > 30 days — soft ceiling on asking rent; solid renter incomes; 278 units permitted in Monroe County in 2024 (52 in 5+ unit buildings).
- At $3,726/mo this rent would consume 49% of the median local household income ($91k/yr) (locally 672% of renters already pay >50% of income on rent) — very limited rent-growth headroom before tenants either downsize or default.
Forward outlook
- Local home prices are declining (-3.0%/yr); year-one equity from $2k of loan paydown is wiped out by about $9k of value loss. Plan a longer hold.
- Monroe County population projected at -11% by 2050 — secular population decline; favor cash flow + early exit over multi-decade hold.
- At projected returns (-3.0% appreciation + 8.0% rent growth), your $84k cash investment doubles in ~7 years — after that, you're playing with house money.
Negotiation context
- Only 1 days on market — expect competitive offers; lowballing is unlikely to land.
- 7 sale attempts since 24y ago with the ask held roughly flat each time — persistent listings suggest the price (not the market) is what's stuck; bring a comps-based counter.
Risks & watch-outs
- Watch-outs: built in 1902 — expect roof / HVAC / electrical / plumbing capex.
Questions for the listing agent
- Built in 1902 — when were the roof, HVAC, electrical panel, plumbing, and water heater last replaced?
- Is there a deadline driving the sale (1031 exchange, divorce, estate, relocation)? That informs how much negotiation room exists.
- Schools are B-rated — typically a magnet for longer-tenancy family renters. What's the average tenant stay here, and is there a school-zone premium baked into asking?
- What's the average days-on-market for RENTAL listings here right now (not sales)? A rising rental-DOM trend means longer vacancies and softer asking-rent achievability than the comps imply.
- What's the recent tenant-quality profile in this submarket — average credit score on applications, eviction rate, late-payment / NSF rate, and stable-employment percentage? A property-management company in the area should have these aggregated.
- How much new apartment / multifamily construction is in the pipeline within 1–3 miles? Heavy new supply (>2% of stock underway) typically softens rents 12–24 months out; light construction supports rent growth.
Investment metrics
- 1% rule
- 1.25% ✓
- Cap rate
- 9.82%
- Cash-on-cash
- 12.59%
- DSCR
- 1.56
- GRM
- 6.7
CMA / ARV
No comps found within radius.
Projected returns pro-forma
-3.0% appreciation · 8.0% rent growth · sell at horizon
- IRR
- 7.9%
- Equity multiple
- 1.33×
- Total profit
- $27,250
- Equity at exit
- $44,582
- IRR
- 21.1%
- Equity multiple
- 3.22×
- Total profit
- $185,626
- Equity at exit
- $25,852
Cash invested: $83,720 (down + closing). Projections, not guarantees.
Landlord ↔ Tenant lean methodology
- Overall (STATE)
- 62 Landlord-Friendly
- State Pennsylvania
- 62 Landlord-Friendly · EVEN
- County
- — inherits STATE
- City
- — inherits STATE
ZIP-level market 18301
- Rents YoY
- 10.4%
- Active inventory
- 196
- Price-to-rent
- 15.6×
Monthly cashflow live
- Estimated rent
- $3,726 medium interval (Pro) →
- Mortgage (P&I)
- −$1,568
- Tax from tax record
- −$372 /mo · $4,469/yr
- Insurance
- −$125
- HOA
- −$0
- Vacancy / Maint / Mgmt
- −$782
- Net cashflow
- $879
Break-even live
2-unit breakdown (identical units grouped — click to expand)
| Units | Beds | Baths | Est. rent |
|---|---|---|---|
| 1× unit | 1 | 1 | $1,593 |
| 1× unit | 3 | 1 | $2,133 |
| Total (2 units) | $3,726 | ||
UW: 25.0% down · 7.5% · 30yr · 1.5% tax · 5.0% vac · 8.0% maint · 8.0% mgmt
Financing live
Cash to close
- Down payment
- $74,750
- Closing costs
- $8,970
- Reserves months
- —
- Total cash needed
- —
Loan-product check · same deal, 3 products live
Conventional
25% down · 7.5% · 30yr
- Down + closing
- —
- Monthly P&I
- —
- Monthly cashflow
- —
- DSCR
- —
- Eligible?
- —
Personal DTI + credit; lowest rate.
DSCR
20% down · 8.5% · 30yr
- Down + closing
- —
- Monthly P&I
- —
- Monthly cashflow
- —
- DSCR
- —
- Eligible?
- —
No personal income docs; deal must DSCR.
Hard money
10% down · 12.0% · 12mo
- Down + closing
- —
- Monthly P&I
- —
- Monthly cashflow
- —
- DSCR
- —
- Eligible?
- —
Short-term bridge; refi at stabilization.
Rent comps 7 comps
| Address | Beds | Baths | Sqft | Rent | $/sqft | DOM | Units | Dist |
|---|---|---|---|---|---|---|---|---|
| 111 Lenox Ave Unit 3 & 4 East Stroudsburg, PA | 4.0 | 2.0 | 1100 | $1,850 | $1.68 | 43d | 1 | 0.27mi |
| 118 Barnum St East Stroudsburg, PA | 4.0 | 1.0 | 1094 | $1,800 | $1.65 | 43d | 1 | 0.37mi |
| 111 Fairview St East Stroudsburg, PA | 3.0 | 1.0 | 1400 | $2,100 | $1.50 | 43d | 1 | 0.58mi |
| 175 Prospect St Unit 175-R East Stroudsburg, PA | 3.0 | 2.0 | 1278 | $2,500 | $1.96 | 43d | 1 | 0.67mi |
| 106 Ridgeway St East Stroudsburg, PA | 3.0 | 2.0 | 1326 | $2,400 | $1.81 | 43d | 1 | 0.70mi |
| 11 Spring Ln East Stroudsburg, PA | 3.0 | 1.5 | 1598 | $2,000 | $1.25 | 43d | 1 | 1.18mi |
| 333 Greentree Dr East Stroudsburg, PA | 2.0–3.0 | 1.5–2.5 | 1042 | $2,429 | $2.33 | 2d | 4 | 1.23mi |
Listing history 2 events
-
2026-06-18remarks 368-char remark
-
2026-06-18$299,000 Active 1 DOM
ⓘ Source: listings_history table (triggers on properties + properties_extension) + one-shot
backfill from property_details.listing_events for pre-trigger history.
Tax reassessment forecast PA · Partial reset (capped growth)
- Current annual tax
- $4,469 · $372/mo
- Projected year-2 tax
- $4,597 · $383/mo
- Expected delta
- +$127/yr (+$11/mo · 2.9%)
ⓘ Screening estimate from a state-policy table — verify with the county assessor before closing.
Climate risk First Street
- Flood 1/10 Low FEMA zone X (unshaded) · 0% chance over 30 yrs
- Wildfire 1/10 Low
- Heat 4/10 Moderate 7 d/yr ≥99°F today · 16 d/yr by 30 yrs out
- Wind 4/10 Moderate 11% chance of damaging wind over 30 yrs
- Air quality 2/10 Low 1 unhealthy d/yr today · 2 by 30 yrs out
Nearby sold comps map
Loading sold comps map…
Walkable amenities ~0.75 mi
Loading nearby amenities…
Taxation est. · year 1
- Rental income
- $44,712
- − Mortgage interest
- −$16,749
- − Property taxes
- −$4,469
- − Insurance
- −$1,495
- − Repairs & maintenance
- −$3,577
- − Management
- −$3,577
- − Depreciation
- −$8,698
- Taxable income
- $6,147
- Est. tax owed @ 24.0%
- −$1,475
- After-tax cash flow
- $9,067/yr
For passive investors: Depreciation is non-cash, so a rental often shows a tax loss while cash-flowing — sheltering income. Rental losses are passive: they offset passive income freely, and up to $25,000/yr can offset ordinary (W-2) income if you actively participate and your MAGI is under $100k (phasing out to $0 by $150k); unused losses carry forward. On sale, claimed depreciation is recaptured at up to 25%, and gains may owe capital-gains tax (a 1031 exchange can defer both). Figures are a year-1 estimate at your 24.0% rate — not tax advice; consult a CPA.
Schools (NCES district)
- District
- East Stroudsburg Area SD
- NCES district ID
- 4208670
- Math proficiency
- 25% ▼ -11.00%
- Reading proficiency
- 43% ▼ -18.00%
- Median HH income
- $57,142
- Composite
- 30.13/100
- National rank
- #6332
- State rank
- #413 of 539 in PA
Livability — East Stroudsburg
- Score
- 84/100
- State rank
- #108
- US rank
- #833
Category grades
Schools grade is shown separately in the Schools card above.
Census & demographics
- Census place
- East Stroudsburg, PA
- County
- Monroe County · 59,057 people
- City population
- 28,977
- Metro
- East Stroudsburg, PA
- Population (ZIP)
- 28,977
- Household income
- $90,522
- Rent vs Own
- Severe rent burden
- 672.0
Population outlook (Monroe County) Hauer SSP2
- Today (2025)
- 164,099 people
- By 2030
- 161,412 · -1.6%
- By 2040
- 154,616 · -5.8%
- By 2050
- 146,710 · -10.6%
- By 2075
- 140,830 · -14.2%
- By 2100
- 138,472 · -15.6%
Race, ethnicity, and origin ACS 2023
- Neighborhood character
- Diverse neighborhood (Simpson 0.64)
- Race & ethnicity
- White 53% Black 21% Hispanic / Latino 18% Two or more races 10% Asian 2%
- Hispanic origin (detail)
- Puerto Rican 8% Dominican 3%
- Common ancestry
- Romanian 6% Lithuanian 3% Portuguese 1%
- Foreign-born
- 12% · Canada, China, Jamaica
- Languages at home
- 82% English-only · Spanish 9% Russian/Polish/Slavic 2% Other Indo-European 2%
Political lean MEDSL · Monroe
- 2024 margin
- Toss-up / Even · D 49.1% · R 49.9%
- 2008→2024 swing
- -17.1pp toward R · 2008: 16.3pp · 2024: -0.8pp
- All cycles
- 2024: R+0.8 2020: D+6.4 2016: D+0.3 2012: D+14.0 2008: D+16.3
Not yet ingested
- Civics
- —
Market trends
- HPI YoY
- ▼ -109.90%
- Current HPI
- 154.4762
- Rent YoY
- ▲ 10.44%
- Metro
- East Stroudsburg, PA
- State GDP YoY
- ▲ 1.68%
- F500 in state
- 34
Industry mix (Fortune 500 HQ in PA)
| Industry | F500 HQs | Revenue |
|---|---|---|
| Healthcare | 2 | $309B |
|
||
| Insurance | 2 | $27B |
|
||
| Telecommunications / Media | 1 | $124B |
|
||
| Industrial Distribution | 1 | $22B |
|
||
| Financial Services | 1 | $20B |
|
||
| Chemicals / Materials | 1 | $18B |
|
||
Price history
+199.3% since first listed15 events — show timeline
- 2026-06-16 Listed $299,000 PMAR
- 2026-04-17 Listing Removed — GLVRMLS
- 2026-01-20 Relisted — PMAR
- 2026-01-20 Relisted — GLVRMLS
- 2025-12-14 Pending — PMAR
- 2025-12-14 Pending — GLVRMLS
- 2025-12-05 Price Changed $300,000 PMAR
- 2025-12-05 Price Changed $300,000 GLVRMLS
- 2025-11-18 Listed $315,000 PMAR
- 2025-11-18 Listed $315,000 GLVRMLS
- 2025-06-10 Sold (Public Records) $285,000 Public Records
- 2006-02-13 Sold (Public Records) $164,893 Public Records
- 2002-03-21 Sold (MLS) $94,000 PMAR
- 2002-01-03 Listed $99,900 PMAR
- 2002-01-03 Listed $99,900 PMAR
Property tax history
+2.7%/yrLatest (2026): $4,469 · +3.6% YoY. Source: county tax records.
Cash-flow waterfall
monthlySold comps — $/sqft
last 12 mo · ≤1 miLoading sold comps…