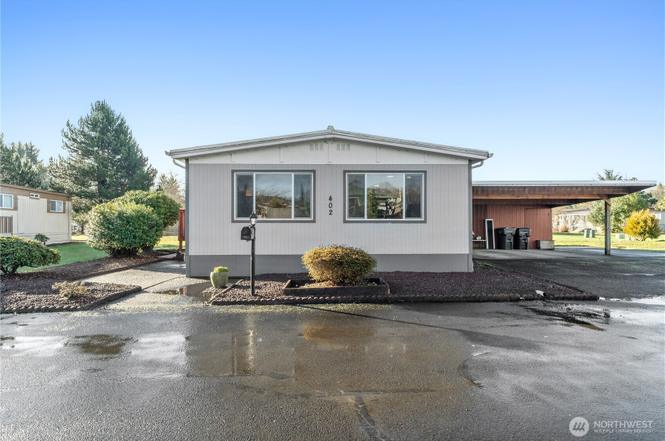
402 Carefree Cir · Aberdeen, WA
Flood risk 4/10 · Minor
- FEMA flood zone
- X
- Chance of flooding over 30 yrs
- 0.22%
- Est. flood insurance / yr
- $507 – $1,088
Fire risk 1/10 · Minimal
- Est. fire insurance / yr
- $604 – $1,122
Heat risk 1/10 · Minimal
- Hot days now (above 78°F)
- 8 days/yr
- Hot days in 30 yrs
- 18 days/yr
Wind risk 1/10 · Minimal
- Chance of severe wind over 30 yrs
- —
Air-quality risk 6/10 · Moderate
- Unhealthy air days now
- 7 days/yr
- Unhealthy air days in 30 yrs
- 7 days/yr
Risk factors via First Street. Map © Google.
Why this score? — see what drove the B grade
The composite is a weighted blend of 9 inputs, each scored 0–100. Each bar is that input's sub-score; the figure is the points it added to the 100-point composite (weight × sub-score).
- Cash flow +30.0/30.0
- 1% rule +10.0/10.0
- DSCR +10.0/10.0
- ARV discount +7.5/15.0
- Livability +4.0/5.0
- Rent growth +3.6/5.0
- Schools +3.6/10.0
- Condition / age +2.5/5.0
- Appreciation +0.0/10.0
$82,000
🖨 Deal sheet (PDF) 📄 Offer letter ✓ Due diligence
Listing remarks
Beautifully remodeled manufactured home in the desirable Leisure Manor MHP! This move-in ready home has been completely updated from top to bottom, featuring durable luxury vinyl plank (LVP) flooring throughout for a modern, cohesive look. Major system upgrades include updated electrical and plumbing, double-pane windows for energy efficiency and comfort, and updated appliances that make everyday living easy. The spacious, well-designed layout offers an effortless flow between rooms, creating a bright and welcoming atmosphere. Enjoy a versatile den/office area—perfect for working from home or creating a cozy retreat—along with a dedicated utility room for added convenience. The
Key facts
- Updated appliances
- Updated electrical
- Den office area
Tags
Property features AI
Finance
- Financial info: Listing terms: Cash or Conventional
- HOA & community: Land-lease community (Leisure Manor MHP); park approved for sale; Land lease amount $775/month
Exterior
- Parking: Carport; Storage in carport
- Utilities: Electric energy source; Electric water heater; Community water (City of Aberdeen); Sewer: City of Aberdeen; Power: GH PUD; Cable: DirecTV
- Home design: Manufactured home (double wide); One story; North facing; Updated/remodeled
- Construction: Wood construction; Metal roof; Tie-down foundation; Manufacturer: 75 PEERLESS 56 x 24, Model M05095
- Exterior features: Wood exterior; Paved lot; Has a view; Park amenities: clubhouse, common area, recreational area
Interior
- Kitchen: Dishwasher; Microwave; Refrigerator; Stove/Range
- Bedrooms: 3 bedrooms
- Flooring: Laminate
- Bathrooms: 1 full bath; 1 three-quarter bath
- Heating & cooling: Forced air heating; No cooling
- Interior features: Water heater (located in hall bathroom); Double pane windows
- Laundry & utility: Washer; Dryer; Utility room
Neighborhood map
What this means for you Summary
Snapshot
- This is a 3-bed/2.0-bath manufactured listed at $82k.
Deal economics
- At list price, monthly cash flow is $772 ($9k/yr) — positive.
- The deal already cash-flows at list — no discount required.
- Meets the 1% rule at list price ($2k rent vs $82k).
- Recommended offer: $77k (6.0% below list) — sets the bar for market timing.
- Cap rate 17.6% vs local median 4.1% in Aberdeen — top-decile yield for the area; either an underpriced asset or a hidden risk that comps aren't pricing in. Stress-test before assuming the spread holds.
Location & tenants
- Location reads 81/100 on livability (#73 in WA, #1,320 nationally) — a professional / high-income tenant draw. Strengths: amenities A+, commute A+, cost of living A+; Watch: crime D-, employment F.
- Aberdeen School District (town): math 35% / reading 45% proficiency, ranked #222 of 291 in WA (top 76%) — families likely to look elsewhere, expect single-tenant / working-renter base with shorter leases; 61% free/reduced lunch — lower-income household profile, screen leases tightly.
- Zoned schools: Stevens Elementary School (345 students, 89% FRL); Miller Junior High (718 students, 68% FRL); J M Weatherwax High School (916 students, 63% FRL).
- Market conditions: Rents rising fast (+4.3%/yr); 266 active listings in the ZIP; 4 comparable units currently listed for rent nearby; rentals lingering (median 45d on market — plan ~5-8 weeks vacancy on turnover, expect pricing pressure); 100% of comp listings sitting > 30 days — soft ceiling on asking rent; 297 units permitted in Grays Harbor County in 2024 (17 in 5+ unit buildings).
- This rent runs 33% of the median local income ($58k/yr) — at the standard rent-burdened threshold; future hikes will face affordability resistance.
Forward outlook
- Local home prices are declining (-3.0%/yr); year-one equity from $567 of loan paydown is wiped out by about $2k of value loss. Plan a longer hold.
- Grays Harbor County population projected at -24% by 2050 — secular population decline; favor cash flow + early exit over multi-decade hold.
- At projected returns (-3.0% appreciation + 4.3% rent growth), your $23k cash investment doubles in ~3 years — after that, you're playing with house money.
Negotiation context
- It's been on market 64 days — a 6% lower offer ($77k) is reasonable based on typical stale-listing flexibility.
- 5 sale attempts since 24y ago with the ask held roughly flat each time — persistent listings suggest the price (not the market) is what's stuck; bring a comps-based counter.
- Current owner paid $64k; 28% above their basis — modest negotiation headroom, anchor on the comps not their cost.
Questions for the listing agent
- It's been on market 64 days. Have you received any prior offers? Is the seller open to a 6% concession, seller financing, or rate buy-down credit?
- Built in 1975 — when were the roof, HVAC, electrical panel, plumbing, and water heater last replaced?
- Why hasn't it sold? Are there any deal-killer items the seller is aware of (foundation, flood, title, zoning, code violations)?
- Is there a deadline driving the sale (1031 exchange, divorce, estate, relocation)? That informs how much negotiation room exists.
- Schools are D-rated, which usually means shorter tenancies and higher turnover. Who's the typical renter profile here, and what's been the actual vacancy rate?
- Crime grade is D in this area — have there been break-ins, vandalism, or insurance claims at this property in the last 3 years? What carrier currently insures it and at what premium?
- What's the average days-on-market for RENTAL listings here right now (not sales)? A rising rental-DOM trend means longer vacancies and softer asking-rent achievability than the comps imply.
- What's the recent tenant-quality profile in this submarket — average credit score on applications, eviction rate, late-payment / NSF rate, and stable-employment percentage? A property-management company in the area should have these aggregated.
- How much new for-sale + rental construction is in the pipeline within 1–3 miles? Heavy new supply typically softens prices + rents 12–24 months out; constrained supply supports both.
Investment metrics
- 1% rule
- 1.97% ✓
- Cap rate
- 17.59%
- Cash-on-cash
- 40.35%
- DSCR
- 2.80
- GRM
- 4.2
CMA / ARV
- ARV (on-the-fly)
- $81,984
- Comps found
- 7
Show comp detail 7 sales within ~0.75 mi
| Address | Dist | Beds/Ba | Sqft | Sold | Price | $/sf | Match |
|---|---|---|---|---|---|---|---|
| 402 Carefree Cir | 0.00mi | 3/2.0 | 1,344 (0%) | 1mo | $82,000 | $61 | 99 |
| 511 Leisure Cir | 0.10mi | 3/2.0 | 1,344 (0%) | 10mo | $52,000 | $39 | 86 |
| 58 Meander Way | 0.11mi | 3/2.0 | 1,404 (+4%) | 11mo | $95,000 | $68 | 78 |
| 513 Leisure Cir | 0.11mi | 3/2.0 | 1,440 (+7%) | 11mo | $58,000 | $40 | 74 |
| 600 Leisure Cir | 0.11mi | 3/2.0 | 1,440 (+7%) | 19mo | $68,500 | $48 | 67 |
| 1212 S Evans St | 0.34mi | 3/2.0 | 1,296 (-4%) | 23mo | $304,784 | $235 | 59 |
| 1504 S Evans St | 0.48mi | 2/2.0 (-1) | 1,142 (-15%) | 10mo | $175,000 | $153 | 39 |
Match score weights: distance 35% · size 25% · config 20% · recency 20%. Top-matched comps best support the ARV.
Projected returns pro-forma
-3.0% appreciation · 4.35% rent growth · sell at horizon
- IRR
- 38.2%
- Equity multiple
- 2.66×
- Total profit
- $38,093
- Equity at exit
- $12,226
- IRR
- 45.3%
- Equity multiple
- 5.61×
- Total profit
- $105,820
- Equity at exit
- $7,090
Cash invested: $22,960 (down + closing). Projections, not guarantees.
Landlord ↔ Tenant lean methodology
- Overall (STATE)
- 28 Tenant-Leaning
- State Washington
- 28 Tenant-Leaning · D+8
- County
- — inherits STATE
- City
- — inherits STATE
ZIP-level market 98520
- Rents YoY
- 4.3%
- Active inventory
- 266
- Price-to-rent
- 4.2×
Monthly cashflow live
- Estimated rent
- $1,617 medium interval (Pro) →
- Mortgage (P&I)
- −$430
- Tax from tax record
- −$42 /mo · $499/yr
- Insurance
- −$34
- HOA
- −$0
- Vacancy / Maint / Mgmt
- −$340
- Net cashflow
- $772
Break-even live
Sensitivity live
| Price | -10% $818 | -5% $795 | +0% $772 | +5% $749 | +10% $726 |
|---|---|---|---|---|---|
| Rent | -10% $644 | -5% $708 | +0% $772 | +5% $836 | +10% $900 |
| Rate | -1.0pp $813 | -0.5pp $793 | base $772 | +0.5pp $751 | +1.0pp $729 |
UW: 25.0% down · 7.5% · 30yr · 1.5% tax · 5.0% vac · 8.0% maint · 8.0% mgmt
Financing live
Cash to close
- Down payment
- $20,500
- Closing costs
- $2,460
- Reserves months
- —
- Total cash needed
- —
Loan-product check · same deal, 3 products live
Conventional
25% down · 7.5% · 30yr
- Down + closing
- —
- Monthly P&I
- —
- Monthly cashflow
- —
- DSCR
- —
- Eligible?
- —
Personal DTI + credit; lowest rate.
DSCR
20% down · 8.5% · 30yr
- Down + closing
- —
- Monthly P&I
- —
- Monthly cashflow
- —
- DSCR
- —
- Eligible?
- —
No personal income docs; deal must DSCR.
Hard money
10% down · 12.0% · 12mo
- Down + closing
- —
- Monthly P&I
- —
- Monthly cashflow
- —
- DSCR
- —
- Eligible?
- —
Short-term bridge; refi at stabilization.
Rent comps 4 comps
| Address | Beds | Baths | Sqft | Rent | $/sqft | DOM | Units | Dist |
|---|---|---|---|---|---|---|---|---|
| 100 W Curtis St Aberdeen, WA | 2.0 | 2.0 | 900 | $1,500 | $1.67 | 45d | 1 | 0.64mi |
| 1731 S Boone St Unit 303 Aberdeen, WA | 2.0 | 1.0 | 1100 | $1,250 | $1.14 | 45d | 1 | 0.80mi |
| 810 Dewitt Dr Unit 810 Cosmopolis, WA | 3.0 | 1.0 | 1656 | $1,895 | $1.14 | 45d | 1 | 1.23mi |
| 908 E 1st St Aberdeen, WA | 3.0 | 1.0 | 1608 | $2,100 | $1.31 | 45d | 1 | 1.41mi |
Listing history 13 events
-
2026-05-12status Pending
-
2026-04-25status Active
-
2026-04-20status Pending
-
2026-04-14status Active
-
2026-04-01status Pending
-
2026-03-30price $82,000
-
2026-02-19$85,000 Active
-
2024-12-27soldstatus $64,000 Closed
-
2024-11-18status Pending
-
2024-10-22price $63,000
-
2024-10-06$65,000 Active
-
2002-11-01soldstatus $14,711
-
2002-09-06$14,711
ⓘ Source: listings_history table (triggers on properties + properties_extension) + one-shot
backfill from property_details.listing_events for pre-trigger history.
Tax reassessment forecast WA · Resets to sale price
- Current annual tax
- $499 · $42/mo
- Projected year-2 tax
- $804 · $67/mo
- Expected delta
- +$304/yr (+$25/mo · 60.9%)
ⓘ Screening estimate from a state-policy table — verify with the county assessor before closing.
Climate risk First Street
- Flood 4/10 Moderate FEMA zone X · 22% chance over 30 yrs
- Wildfire 1/10 Low
- Heat 1/10 Low 8 d/yr ≥78°F today · 18 d/yr by 30 yrs out
- Wind 1/10 Low
- Air quality 6/10 Major 7 unhealthy d/yr today · 7 by 30 yrs out
Nearby sold comps map
Loading sold comps map…
Walkable amenities ~0.75 mi
Loading nearby amenities…
Taxation est. · year 1
- Rental income
- $19,409
- − Mortgage interest
- −$4,593
- − Property taxes
- −$499
- − Insurance
- −$410
- − Repairs & maintenance
- −$1,553
- − Management
- −$1,553
- − Depreciation
- −$2,385
- Taxable income
- $8,416
- Est. tax owed @ 24.0%
- −$2,020
- After-tax cash flow
- $7,244/yr
For passive investors: Depreciation is non-cash, so a rental often shows a tax loss while cash-flowing — sheltering income. Rental losses are passive: they offset passive income freely, and up to $25,000/yr can offset ordinary (W-2) income if you actively participate and your MAGI is under $100k (phasing out to $0 by $150k); unused losses carry forward. On sale, claimed depreciation is recaptured at up to 25%, and gains may owe capital-gains tax (a 1031 exchange can defer both). Figures are a year-1 estimate at your 24.0% rate — not tax advice; consult a CPA.
Schools (NCES district)
- District
- Aberdeen School District
- NCES district ID
- 5300030
- Math proficiency
- 35% ▼ -1.00%
- Reading proficiency
- 45% ▬ 0.00%
- Median HH income
- $41,896
- Composite
- 36.13/100
- National rank
- #9477
- State rank
- #222 of 291 in WA
Livability — Aberdeen
- Score
- 81/100
- State rank
- #73
- US rank
- #1320
Category grades
Schools grade is shown separately in the Schools card above.
Census & demographics
- Census place
- Aberdeen, WA
- County
- Grays Harbor County · 44,693 people
- City population
- 24,888
- Metro
- Aberdeen, WA
- Population (ZIP)
- 24,888
- Household income
- $58,153
- Rent vs Own
- Severe rent burden
- 635.0
Population outlook (Grays Harbor County) Hauer SSP2
- Today (2025)
- 66,443 people
- By 2030
- 63,255 · -4.8%
- By 2040
- 56,466 · -15.0%
- By 2050
- 50,516 · -24.0%
- By 2075
- 39,296 · -40.9%
- By 2100
- 31,142 · -53.1%
Race, ethnicity, and origin ACS 2023
- Neighborhood character
- Predominantly White (70%)
- Race & ethnicity
- White 70% Hispanic / Latino 16% Two or more races 9% Black 4% Native American 3% Asian 1% Pacific Islander 1%
- Hispanic origin (detail)
- Mexican 11%
- Common ancestry
- Portuguese 4% Italian 3% Lithuanian 2%
- Foreign-born
- 7% · Canada
- Languages at home
- 87% English-only · Spanish 10% Other Asian/Pacific 1% German/W. Germanic 1%
Political lean MEDSL · Grays Harbor
- 2024 margin
- Lean R (+6.0) · D 45.6% · R 51.6% · Other 2.8%
- 2008→2024 swing
- -20.6pp toward R · 2008: 14.6pp · 2024: -6.0pp
- All cycles
- 2024: R+6.0 2020: R+6.6 2016: R+7.1 2012: D+14.0 2008: D+14.6
Not yet ingested
- Civics
- —
Market trends
- HPI YoY
- ▼ -138.75%
- Current HPI
- 207.7393
- Rent YoY
- ▲ 4.35%
- Metro
- Aberdeen, WA
- State GDP YoY
- ▲ 4.65%
- F500 in state
- 22
Industry mix (Fortune 500 HQ in WA)
| Industry | F500 HQs | Revenue |
|---|---|---|
| Retail | 2 | $269B |
|
||
| Technology / Retail | 1 | $638B |
|
||
| Technology | 1 | $245B |
|
||
| Telecommunications | 1 | $38B |
|
||
| Food / Beverage | 1 | $36B |
|
||
| Automotive / Trucks | 1 | $34B |
|
||
Price history
+457.4% since first listed13 events — show timeline
- 2026-05-12 Pending — NWMLS as Distributed by MLS Grid
- 2026-04-25 Relisted — NWMLS as Distributed by MLS Grid
- 2026-04-20 Pending — NWMLS as Distributed by MLS Grid
- 2026-04-14 Relisted — NWMLS as Distributed by MLS Grid
- 2026-04-01 Pending — NWMLS as Distributed by MLS Grid
- 2026-03-30 Price Changed $82,000 NWMLS as Distributed by MLS Grid
- 2026-02-19 Listed $85,000 NWMLS as Distributed by MLS Grid
- 2024-12-27 Sold (MLS) $64,000 NWMLS as Distributed by MLS Grid
- 2024-11-18 Pending — NWMLS as Distributed by MLS Grid
- 2024-10-22 Price Changed $63,000 NWMLS as Distributed by MLS Grid
- 2024-10-06 Listed $65,000 NWMLS as Distributed by MLS Grid
- 2002-11-01 Sold (MLS) $14,711 NWMLS as Distributed by MLS Grid
- 2002-09-06 Listed $14,711 NWMLS as Distributed by MLS Grid
Property tax history
+18.3%/yrLatest (2026): $499 · +25.0% YoY. Source: county tax records.
Cash-flow waterfall
monthlySold comps — $/sqft
last 12 mo · ≤1 miLoading sold comps…