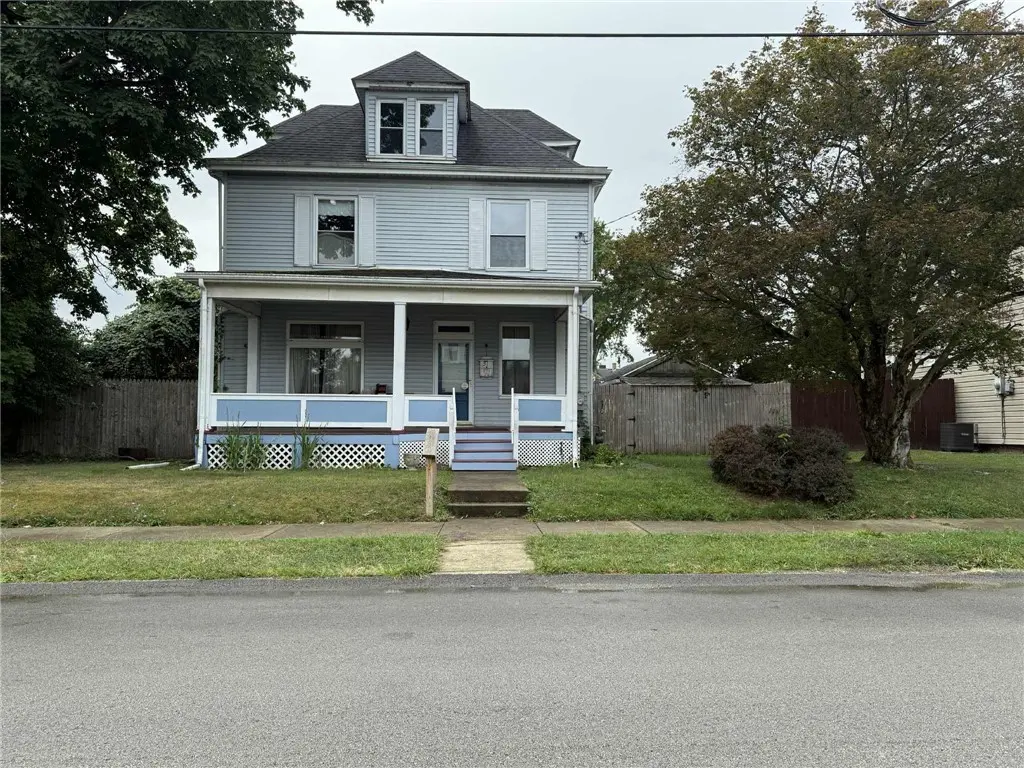
51 E Highland Ave · Uniontown, PA
Flood risk 1/10 · Minimal
- FEMA flood zone
- X (unshaded)
- Chance of flooding over 30 yrs
- 0.0%
- Est. flood insurance / yr
- $473 – $860
Fire risk 1/10 · Minimal
- Est. fire insurance / yr
- $511 – $949
Heat risk 4/10 · Minor
- Hot days now (above 96°F)
- 7 days/yr
- Hot days in 30 yrs
- 18 days/yr
Wind risk 2/10 · Minimal
- Chance of severe wind over 30 yrs
- —
Air-quality risk 2/10 · Minimal
- Unhealthy air days now
- 1 days/yr
- Unhealthy air days in 30 yrs
- 2 days/yr
Risk factors via First Street. Map © Google.
Why this score? — see what drove the C- grade
The composite is a weighted blend of 9 inputs, each scored 0–100. Each bar is that input's sub-score; the figure is the points it added to the 100-point composite (weight × sub-score).
- Cash flow +17.1/30.0
- ARV discount +13.3/15.0
- DSCR +5.3/10.0
- 1% rule +4.4/10.0
- Livability +3.5/5.0
- Schools +3.1/10.0
- Rent growth +2.5/5.0
- Condition / age +2.5/5.0
- Appreciation +0.9/10.0
$169,900
🖨 Deal sheet 📄 Offer letter ✓ Due diligence
Listing remarks MLS
Discover the perfect blend of historical elegance and city conveniences in this classic 4 bedroom urban home. Step through the welcoming front door and be greeted by original hardwoods, 9.5 ft ceilings and a lovely staircase that speaks of a bygone era. The main level offers an effortless flow between the living room, dining room and equipped kitchen ideal for hosting memorable dinner parties! 4 bedrooms, top-floor bonus space—is a versatile, light-filled sanctuary perfect for a home office, playroom, or a creative studio! Located in a vibrant, tree-lined neighborhood, you are just steps away from shopping, restaurants, recreation and public transportation. Carport and detached garage in the level fenced backyard! This home is not just a residence; it’s an invitation to a lifestyle rich with community and urban energy!
Key facts
- 9.5 ft ceilings
- Original hardwoods
- Lovely staircase
Tags
Neighborhood map
What this means for you Summary
Snapshot
- This is a 3-bed/1.0-bath single-family listed at $170k.
Deal economics
- At list price, monthly cash flow is $117 ($1k/yr) — positive.
- The deal already cash-flows at list — no discount required.
- To meet the 1% rule (rent ≥ 1% of price), the offer needs to be $161k (5.5% below list).
- Recommended offer: $150k (12.0% below list) — sets the bar for market timing.
Location & tenants
- Location reads 70/100 on livability (#750 in PA) — a middle-class / working-renter tenant base. Strengths: cost of living A+, health & safety A+, housing A; Watch: schools C-, amenities D+, crime F.
- Uniontown Area SD (suburban): math 27% / reading 49% proficiency, ranked #392 of 539 in PA (top 73%) — families likely to look elsewhere, expect single-tenant / working-renter base with shorter leases.
- Market conditions: 145 active listings in the ZIP; 3 comparable units currently listed for rent nearby; rentals lingering (median 44d on market — plan ~5-8 weeks vacancy on turnover, expect pricing pressure); 100% of comp listings sitting > 30 days — soft ceiling on asking rent; 201 units permitted in Fayette County in 2024 (10 in 5+ unit buildings).
Forward outlook
- Local home prices are declining (-3.0%/yr); year-one equity from $1k of loan paydown is wiped out by about $5k of value loss. Plan a longer hold.
- Fayette County population projected at -19% by 2050 — secular population decline; favor cash flow + early exit over multi-decade hold.
Negotiation context
- It's been on market 283 days — a 12% lower offer ($150k) is reasonable based on typical stale-listing flexibility.
Risks & watch-outs
- Watch-outs: built in 1930 — expect roof / HVAC / electrical / plumbing capex.
Questions for the listing agent
- It's been on market 283 days. Have you received any prior offers? Is the seller open to a 12% concession, seller financing, or rate buy-down credit?
- Built in 1930 — when were the roof, HVAC, electrical panel, plumbing, and water heater last replaced?
- Why hasn't it sold? Are there any deal-killer items the seller is aware of (foundation, flood, title, zoning, code violations)?
- Is there a deadline driving the sale (1031 exchange, divorce, estate, relocation)? That informs how much negotiation room exists.
- Crime grade is F in this area — have there been break-ins, vandalism, or insurance claims at this property in the last 3 years? What carrier currently insures it and at what premium?
- What's the average days-on-market for RENTAL listings here right now (not sales)? A rising rental-DOM trend means longer vacancies and softer asking-rent achievability than the comps imply.
- What's the recent tenant-quality profile in this submarket — average credit score on applications, eviction rate, late-payment / NSF rate, and stable-employment percentage? A property-management company in the area should have these aggregated.
- How much new for-sale + rental construction is in the pipeline within 1–3 miles? Heavy new supply typically softens prices + rents 12–24 months out; constrained supply supports both.
Investment metrics
- 1% rule
- 0.94% ✗
- Cap rate
- 7.12%
- Cash-on-cash
- 2.95%
- DSCR
- 1.13
- GRM
- 8.8
CMA / ARV
- ARV (median comp)
- $195,221
- List price
- $169,900
- Delta
- -12.97%
- Verdict
- UNDERPRICED
- Comps
- 20 within 1.0 mi
Show comp detail 12 sales within ~0.75 mi
| Address | Dist | Beds/Ba | Sqft | Sold | Price | $/sf | Match |
|---|---|---|---|---|---|---|---|
| 158 Clarendon Ave | 0.36mi | 3/2.5 | 1,800 (-3%) | 2mo | $120,000 | $67 | 70 |
| 122 Shaffer St | 0.52mi | 4/1.5 (+1) | 1,832 (-1%) | 7mo | $75,000 | $41 | 61 |
| 14 Leith St | 0.65mi | 4/2.0 (+1) | 1,848 (-0%) | 10mo | $40,000 | $22 | 52 |
| 120 Shaffer St | 0.52mi | 4/1.0 (+1) | 1,680 (-10%) | 7mo | $75,000 | $45 | 49 |
| 49 Lebanon Ave | 0.34mi | 4/2.0 (+1) | 1,748 (-6%) | 20mo | $155,000 | $89 | 49 |
| 59 Lebanon Ave | 0.39mi | 4/2.0 (+1) | 2,098 (+13%) | 10mo | $159,900 | $76 | 43 |
| 100 Molly St | 0.65mi | 3/2.5 | 1,644 (-11%) | 2mo | $278,000 | $169 | 43 |
| 5 William Penn St | 0.66mi | 3/2.0 | 1,625 (-12%) | 10mo | $360,000 | $222 | 36 |
| 317 Derrick | 0.68mi | 3/2.0 | 2,015 (+9%) | 18mo | $185,000 | $92 | 35 |
| 71 Francis St | 0.59mi | 3/2.5 | 1,680 (-10%) | 21mo | $245,000 | $146 | 33 |
| 51 Francis St | 0.51mi | 3/3.0 | 2,124 (+14%) | 14mo | $280,000 | $132 | 32 |
| 59 Dixon Blvd | 0.70mi | 4/1.5 (+1) | 1,648 (-11%) | 20mo | $193,000 | $117 | 24 |
Match score weights: distance 35% · size 25% · config 20% · recency 20%. Top-matched comps best support the ARV.
Projected returns pro-forma
-3.0% appreciation · 3.0% rent growth · sell at horizon
- IRR
- -11.6%
- Equity multiple
- 0.58×
- Total profit
- $-20,068
- Equity at exit
- $25,333
- IRR
- -2.4%
- Equity multiple
- 0.84×
- Total profit
- $-7,837
- Equity at exit
- $14,690
Cash invested: $47,572 (down + closing). Projections, not guarantees.
Landlord ↔ Tenant lean methodology
- Overall (STATE)
- 62 Landlord-Friendly
- State Pennsylvania
- 62 Landlord-Friendly · EVEN
- County
- — inherits STATE
- City
- — inherits STATE
ZIP-level market 15401
- Home prices YoY
- -3.8%
- Active inventory
- 145
- Price-to-rent
- 8.8×
Monthly cashflow live
- Estimated rent
- $1,605 medium interval (Pro) →
- Mortgage (P&I)
- −$891
- Tax from tax record
- −$189 /mo · $2,271/yr
- Insurance
- −$71
- HOA
- −$0
- Vacancy / Maint / Mgmt
- −$337
- Net cashflow
- $117
Break-even live
UW: 25.0% down · 7.5% · 30yr · 1.5% tax · 5.0% vac · 8.0% maint · 8.0% mgmt
Financing live
Cash to close
- Down payment
- $42,475
- Closing costs
- $5,097
- Reserves months
- —
- Total cash needed
- —
Loan-product check · same deal, 3 products live
Conventional
25% down · 7.5% · 30yr
- Down + closing
- —
- Monthly P&I
- —
- Monthly cashflow
- —
- DSCR
- —
- Eligible?
- —
Personal DTI + credit; lowest rate.
DSCR
20% down · 8.5% · 30yr
- Down + closing
- —
- Monthly P&I
- —
- Monthly cashflow
- —
- DSCR
- —
- Eligible?
- —
No personal income docs; deal must DSCR.
Hard money
10% down · 12.0% · 12mo
- Down + closing
- —
- Monthly P&I
- —
- Monthly cashflow
- —
- DSCR
- —
- Eligible?
- —
Short-term bridge; refi at stabilization.
Rent comps 3 comps
| Address | Beds | Baths | Sqft | Rent | $/sqft | DOM | Units | Dist |
|---|---|---|---|---|---|---|---|---|
| 14 Leith St Uniontown, PA | 4.0 | 2.0 | 1848 | $1,600 | $0.87 | 43d | 1 | 0.62mi |
| 27 E Kerr St Unit B Uniontown, PA | 3.0 | 1.0 | 1248 | $800 | $0.64 | 43d | 1 | 1.20mi |
| 189 Wiggins Ln Uniontown, PA | 3.0 | 2.0 | 1663 | $2,300 | $1.38 | 43d | 1 | 1.36mi |
Listing history 16 events
-
2026-06-18days on market $169,900 Active 283 DOM
-
2026-06-17days on market $169,900 Active 282 DOM
-
2026-06-16days on market $169,900 Active 281 DOM
-
2026-06-15days on market $169,900 Active 280 DOM
-
2026-06-13days on market $169,900 Active 278 DOM
-
2026-06-12days on market $169,900 Active 277 DOM
-
2026-06-09days on market $169,900 Active 274 DOM
-
2026-06-08days on market $169,900 Active 273 DOM
-
2026-06-08days on market $169,900 Active 272 DOM
-
2026-06-07days on market $169,900 Active 271 DOM
-
2026-06-04days on market $169,900 Active 268 DOM
-
2026-06-02days on market $169,900 Active 267 DOM
-
2026-06-01days on market $169,900 Active 266 DOM
-
2026-05-31days on market $169,900 Active 265 DOM
-
2025-10-20price $169,900 842-char remark
Show marketing remark (842 chars)
Discover the perfect blend of historical elegance and city conveniences in this classic 4 bedroom urban home. Step through the welcoming front door and be greeted by original hardwoods, 9.5 ft ceilings and a lovely staircase that speaks of a bygone era. The main level offers an effortless flow between the living room, dining room and equipped kitchen ideal for hosting memorable dinner parties! 4 bedrooms, top-floor bonus space—is a versatile, light-filled sanctuary perfect for a home office, playroom, or a creative studio! Located in a vibrant, tree-lined neighborhood, you are just steps away from shopping, restaurants, recreation and public transportation. Carport and detached garage in the level fenced backyard! This home is not just a residence; it’s an invitation to a lifestyle rich with community and urban energy!
-
2025-09-08$175,000 Active 842-char remark
Show marketing remark (842 chars)
Discover the perfect blend of historical elegance and city conveniences in this classic 4 bedroom urban home. Step through the welcoming front door and be greeted by original hardwoods, 9.5 ft ceilings and a lovely staircase that speaks of a bygone era. The main level offers an effortless flow between the living room, dining room and equipped kitchen ideal for hosting memorable dinner parties! 4 bedrooms, top-floor bonus space—is a versatile, light-filled sanctuary perfect for a home office, playroom, or a creative studio! Located in a vibrant, tree-lined neighborhood, you are just steps away from shopping, restaurants, recreation and public transportation. Carport and detached garage in the level fenced backyard! This home is not just a residence; it’s an invitation to a lifestyle rich with community and urban energy!
ⓘ Source: listings_history table (triggers on properties + properties_extension) + one-shot
backfill from property_details.listing_events for pre-trigger history.
Tax reassessment forecast PA · Partial reset (capped growth)
- Current annual tax
- $2,271 · $189/mo
- Projected year-2 tax
- $2,478 · $206/mo
- Expected delta
- +$206/yr (+$17/mo · 9.1%)
ⓘ Screening estimate from a state-policy table — verify with the county assessor before closing.
Climate risk First Street
- Flood 1/10 Low FEMA zone X (unshaded) · 0% chance over 30 yrs
- Wildfire 1/10 Low
- Heat 4/10 Moderate 7 d/yr ≥96°F today · 18 d/yr by 30 yrs out
- Wind 2/10 Low
- Air quality 2/10 Low 1 unhealthy d/yr today · 2 by 30 yrs out
Nearby sold comps map
Loading sold comps map…
Walkable amenities ~0.75 mi
Loading nearby amenities…
Taxation est. · year 1
- Rental income
- $19,262
- − Mortgage interest
- −$9,517
- − Property taxes
- −$2,271
- − Insurance
- −$850
- − Repairs & maintenance
- −$1,541
- − Management
- −$1,541
- − Depreciation
- −$4,943
- Taxable loss
- −$1,401
- Est. tax savings @ 24.0%
- +$336
- After-tax cash flow
- $1,740/yr
For passive investors: Depreciation is non-cash, so a rental often shows a tax loss while cash-flowing — sheltering income. Rental losses are passive: they offset passive income freely, and up to $25,000/yr can offset ordinary (W-2) income if you actively participate and your MAGI is under $100k (phasing out to $0 by $150k); unused losses carry forward. On sale, claimed depreciation is recaptured at up to 25%, and gains may owe capital-gains tax (a 1031 exchange can defer both). Figures are a year-1 estimate at your 24.0% rate — not tax advice; consult a CPA.
Schools (NCES district)
- District
- Uniontown Area SD
- NCES district ID
- 4224150
- Math proficiency
- 27% ▼ -8.00%
- Reading proficiency
- 49% ▼ -6.00%
- Median HH income
- $36,744
- Composite
- 31.48/100
- National rank
- #5977
- State rank
- #392 of 539 in PA
Livability — Uniontown
- Score
- 70/100
- State rank
- #750
- US rank
- #7482
Category grades
Schools grade is shown separately in the Schools card above.
Census & demographics
- Census place
- Uniontown, PA
- Population (ZIP)
- 30,230
Population outlook (Fayette County) Hauer SSP2
- Today (2025)
- 127,561 people
- By 2030
- 123,206 · -3.4%
- By 2040
- 113,232 · -11.2%
- By 2050
- 103,468 · -18.9%
- By 2075
- 83,185 · -34.8%
- By 2100
- 62,384 · -51.1%
Race, ethnicity, and origin ACS 2023
- Neighborhood character
- Predominantly White (86%)
- Race & ethnicity
- White 86% Black 7% Two or more races 5% Hispanic / Latino 1%
- Common ancestry
- Romanian 8% Scotch-Irish 2% Iranian 1%
- Foreign-born
- 2% · Canada
- Languages at home
- 97% English-only · Spanish 1% Arabic 1%
Political lean MEDSL · Fayette
- 2024 margin
- Solid R (+37.9) · D 30.8% · R 68.7%
- 2008→2024 swing
- -37.5pp toward R · 2008: -0.4pp · 2024: -37.9pp
- All cycles
- 2024: R+37.9 2020: R+33.5 2016: R+31.0 2012: R+8.3 2008: R+0.4
Not yet ingested
- Civics
- —
Market trends
- HPI YoY
- ▼ -8.29%
- Current HPI
- 210.1257
- Rent YoY
- —
- Metro
- —
- State GDP YoY
- ▲ 1.68%
- F500 in state
- 34
Industry mix (Fortune 500 HQ in PA)
| Industry | F500 HQs | Revenue |
|---|---|---|
| Healthcare | 2 | $309B |
|
||
| Insurance | 2 | $27B |
|
||
| Telecommunications / Media | 1 | $124B |
|
||
| Industrial Distribution | 1 | $22B |
|
||
| Financial Services | 1 | $20B |
|
||
| Chemicals / Materials | 1 | $18B |
|
||
Price history
-2.9% since first listed2 events — show timeline
- 2025-10-20 Price Changed $169,900 West Penn MLS
- 2025-09-08 Listed $175,000 West Penn MLS
Property tax history
+2.3%/yrLatest (2026): $2,271 · +2.4% YoY. Source: county tax records.
Cash-flow waterfall
monthlySold comps — $/sqft
last 12 mo · ≤1 miLoading sold comps…