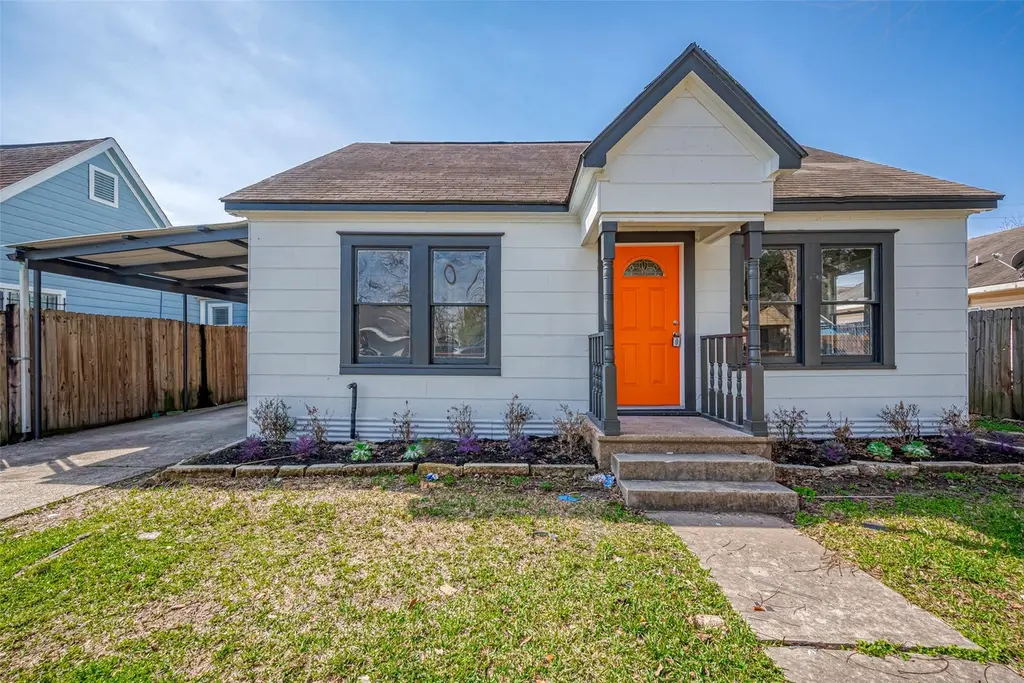
7424 Rusk St · Houston, TX
Flood risk 5/10 · Moderate
- FEMA flood zone
- X (unshaded)
- Chance of flooding over 30 yrs
- 0.24%
- Est. flood insurance / yr
- $507 – $1,088
Fire risk 1/10 · Minimal
- Est. fire insurance / yr
- $1,222 – $2,270
Heat risk 9/10 · Severe
- Hot days now (above 109°F)
- 7 days/yr
- Hot days in 30 yrs
- 24 days/yr
Wind risk 9/10 · Severe
- Chance of severe wind over 30 yrs
- 99.0%
Air-quality risk 2/10 · Minimal
- Unhealthy air days now
- 2 days/yr
- Unhealthy air days in 30 yrs
- 2 days/yr
Risk factors via First Street. Map © Google.
Why this score? — see what drove the F grade
The composite is a weighted blend of 9 inputs, each scored 0–100. Each bar is that input's sub-score; the figure is the points it added to the 100-point composite (weight × sub-score).
- Appreciation +10.0/10.0
- Livability +3.7/5.0
- Schools +2.7/10.0
- Condition / age +2.5/5.0
- Cash flow +1.9/30.0
- Rent growth +1.8/5.0
- 1% rule +0.0/10.0
- DSCR +0.0/10.0
- ARV discount +0.0/15.0
$335,000
🖨 Deal sheet 📄 Offer letter ✓ Due diligence
Listing remarks
The main house has 3 bedrooms and 2 bathrooms, with a spacious living area that’s brightened by large windows and a ceiling fan for added comfort. The kitchen features a subway tile backsplash, quartz countertops, and plenty of cabinet space. The bedrooms are all equipped with ceiling fan lights and big windows for plenty of natural light. There is also a SECOND HOUSE AT THE BACK OF THE PROPERTY with 2 bedrooms and 1 bathroom, plus its own living area and kitchen, making it perfect for guests or as a rental. Outside, there’s an attached wood deck that’s great for relaxing or entertaining. This property offers plenty of space with a fresh, modern feel throughout.
Key facts
- Large windows
- Quartz countertops
- Ceiling fan
Tags
Property features AI
Exterior
- Parking: Detached garage (1 car)
- Utilities: Public water; Public sewer
- Home design: Residential property; Built in 1948
- Construction: Wood siding exterior; Block foundation; Shingle and wood roof
- Exterior features: Subdivision lot; Lot approximately 5,000 square feet
Interior
- Bedrooms: Primary bedroom on the first floor (13 x 11); Two additional first-floor bedrooms (13 x 11 and 9 x 9); Two second-floor bedrooms (14 x 10 and 13 x 9)
- Bathrooms: Three full bathrooms
- Heating & cooling: Window unit cooling
- Interior features: Five total rooms
Neighborhood map
What this means for you Summary
Snapshot
- This is a 2-bed/1.0-bath single-family listed at $335k.
Deal economics
- At list price, monthly cash flow is $-1k ($-15k/yr) — negative.
- To cash-flow at today's rent, offer at most $113k (66.3% below list).
- To meet the 1% rule (rent ≥ 1% of price), the offer needs to be $126k (62.4% below list).
- Recommended offer: $113k (66.3% below list) — sets the bar for cash-flow.
- Cap rate 1.8% vs local median 3.2% in Houston — below-typical yield; the buyer is paying a premium for something (appreciation thesis, condition, location) that the cap rate doesn't capture.
Location & tenants
- Location reads 74/100 on livability (#184 in TX, #4,771 nationally) — a middle-class / working-renter tenant base. Strengths: amenities A+, cost of living A+, housing A+; Watch: crime F.
- Houston ISD (urban): math 27% / reading 35% proficiency, ranked #593 of 826 in TX (top 72%) — families likely to look elsewhere, expect single-tenant / working-renter base with shorter leases; 71% free/reduced lunch — lower-income household profile, screen leases tightly.
- Zoned schools: Edison Middle (math 12% / reading 16%, grade F, #1,596 of 1,662 statewide, top 96%, 460 students, 96% FRL); Austin H S (math 9% / reading 18%, grade F, #1,530 of 1,632 statewide, top 94%, 1,448 students, 97% FRL) — zoned schools average 97% FRL vs 71% district-wide (25 pts higher); higher-poverty schools than district average — tighter screening recommended.
- Zoned-school proficiency averages 14% at this address vs 31% district-wide (-17 pts) — the specific schools serving this property underperform the Houston ISD average; the district grade overstates school quality for this exact location.
- Market conditions: Rents soft (-2.9%/yr); 161 active listings in the ZIP; 34 comparable units currently listed for rent nearby; rentals lingering (median 44d on market — plan ~5-8 weeks vacancy on turnover, expect pricing pressure); 53% of comp listings sitting > 30 days — soft ceiling on asking rent; 29,883 units permitted in Harris County in 2024 (8,621 in 5+ unit buildings).
Forward outlook
- In year one you build about $36k of equity ($2k loan paydown + $34k appreciation (10.0% local appreciation)).
- Harris County population projected at +47% by 2050 — long-run rental-demand tailwind backs the buy-and-hold thesis.
- By year 2, paydown + projected appreciation supports a ~$58k cash-out refi (75% LTV) — recoverable capital for the next deal without selling this one.
Negotiation context
- Only 9 days on market — expect competitive offers; lowballing is unlikely to land.
- 10 sale attempts since 3y ago with the ask held roughly flat each time — persistent listings suggest the price (not the market) is what's stuck; bring a comps-based counter.
Risks & watch-outs
- Watch-outs: built in 1948 — expect roof / HVAC / electrical / plumbing capex.
- Climate carrying-cost: moderate flood risk; severe wind risk, 99% chance of damaging wind over 30y; extreme-heat days projected 7→24/yr by 2055 (HVAC capex compounding) — expect insurance premiums to compound above CPI over the hold.
Questions for the listing agent
- What do current leases actually rent for vs. the listed asking? Can we see a recent rent roll and the last 12 months of T-12 income?
- Built in 1948 — when were the roof, HVAC, electrical panel, plumbing, and water heater last replaced?
- Is there a deadline driving the sale (1031 exchange, divorce, estate, relocation)? That informs how much negotiation room exists.
- Schools are D-rated, which usually means shorter tenancies and higher turnover. Who's the typical renter profile here, and what's been the actual vacancy rate?
- Crime grade is F in this area — have there been break-ins, vandalism, or insurance claims at this property in the last 3 years? What carrier currently insures it and at what premium?
- The area grade is low — what's the realistic commute time and amenity access for the typical tenant pool here? Any planned neighborhood developments (good or bad) we should know about?
- What's the average days-on-market for RENTAL listings here right now (not sales)? A rising rental-DOM trend means longer vacancies and softer asking-rent achievability than the comps imply.
- What's the recent tenant-quality profile in this submarket — average credit score on applications, eviction rate, late-payment / NSF rate, and stable-employment percentage? A property-management company in the area should have these aggregated.
- How much new for-sale + rental construction is in the pipeline within 1–3 miles? Heavy new supply typically softens prices + rents 12–24 months out; constrained supply supports both.
Investment metrics
- 1% rule
- 0.38% ✗
- Cap rate
- 1.79%
- Cash-on-cash
- -16.07%
- DSCR
- 0.28
- GRM
- 22.2
CMA / ARV
- ARV (on-the-fly)
- $227,424
- Comps found
- 12
Show comp detail 12 sales within ~0.75 mi
| Address | Dist | Beds/Ba | Sqft | Sold | Price | $/sf | Match |
|---|---|---|---|---|---|---|---|
| 413 S 72 Nd St | 0.28mi | 3/1.0 (+1) | 1,036 (-6%) | 3mo | $180,000 | $174 | 69 |
| 1836 Matamoras St | 0.47mi | 2/1.0 | 1,035 (-6%) | 8mo | $219,000 | $212 | 61 |
| 7337 Avenue I | 0.61mi | 2/2.0 | 1,101 (-0%) | 10mo | $299,000 | $272 | 59 |
| 7204 Avenue E | 0.44mi | 3/2.0 (+1) | 1,139 (+3%) | 9mo | $234,900 | $206 | 58 |
| 7201 Avenue I | 0.66mi | 2/1.0 | 1,066 (-3%) | 9mo | $181,999 | $171 | 56 |
| 7815 Dayton St | 0.55mi | 2/1.0 | 1,012 (-8%) | 8mo | $144,900 | $143 | 54 |
| 7559 Erath St | 0.64mi | 3/1.0 (+1) | 1,035 (-6%) | 2mo | $255,000 | $246 | 53 |
| 7637 Avenue C | 0.45mi | 3/2.0 (+1) | 1,077 (-2%) | 17mo | $237,000 | $220 | 52 |
| 7615 Avenue F | 0.53mi | 2/2.5 | 993 (-10%) | 2mo | $179,999 | $181 | 51 |
| 1939 Alta Vista St | 0.67mi | 2/1.0 | 1,212 (+10%) | 5mo | $259,500 | $214 | 49 |
| 7567 Satsuma St | 0.69mi | 3/1.0 (+1) | 1,050 (-5%) | 13mo | $175,000 | $167 | 44 |
| 7409 Avenue K | 0.71mi | 2/2.0 | 1,232 (+12%) | 6mo | $239,500 | $194 | 38 |
Match score weights: distance 35% · size 25% · config 20% · recency 20%. Top-matched comps best support the ARV.
Projected returns pro-forma
10.0% appreciation · 0.0% rent growth · sell at horizon
- IRR
- 12.7%
- Equity multiple
- 2.05×
- Total profit
- $98,722
- Equity at exit
- $301,795
- IRR
- 12.8%
- Equity multiple
- 4.70×
- Total profit
- $347,001
- Equity at exit
- $650,831
Cash invested: $93,800 (down + closing). Projections, not guarantees.
Landlord ↔ Tenant lean methodology
- Overall (STATE)
- 87 Strongly Landlord-Friendly
- State Texas
- 87 Strongly Landlord-Friendly · R+5
- County
- — inherits STATE
- City
- — inherits STATE
ZIP-level market 77011
- Home prices YoY
- 30.1%
- Rents YoY
- -2.9%
- Active inventory
- 161
- Price-to-rent
- 22.2×
Monthly cashflow live
- Estimated rent
- $1,259 high interval (Pro) →
- Mortgage (P&I)
- −$1,757
- Tax from tax record
- −$354 /mo · $4,252/yr
- Insurance
- −$140
- HOA
- −$0
- Vacancy / Maint / Mgmt
- −$264
- Net cashflow
- $-1,256
Break-even live
UW: 25.0% down · 7.5% · 30yr · 1.5% tax · 5.0% vac · 8.0% maint · 8.0% mgmt
Financing live
Cash to close
- Down payment
- $83,750
- Closing costs
- $10,050
- Reserves months
- —
- Total cash needed
- —
Loan-product check · same deal, 3 products live
Conventional
25% down · 7.5% · 30yr
- Down + closing
- —
- Monthly P&I
- —
- Monthly cashflow
- —
- DSCR
- —
- Eligible?
- —
Personal DTI + credit; lowest rate.
DSCR
20% down · 8.5% · 30yr
- Down + closing
- —
- Monthly P&I
- —
- Monthly cashflow
- —
- DSCR
- —
- Eligible?
- —
No personal income docs; deal must DSCR.
Hard money
10% down · 12.0% · 12mo
- Down + closing
- —
- Monthly P&I
- —
- Monthly cashflow
- —
- DSCR
- —
- Eligible?
- —
Short-term bridge; refi at stabilization.
Rent comps 34 comps
| Address | Beds | Baths | Sqft | Rent | $/sqft | DOM | Units | Dist |
|---|---|---|---|---|---|---|---|---|
| 7520 Avenue C Houston, TX | 1.0–2.0 | 1.0–2.0 | 745 | $1,313 | $1.76 | 43d | 31 | 0.32mi |
| 7310 Sherman St Houston, TX | 1.0–3.0 | 1.0–2.0 | 879 | $1,299 | $1.48 | 2d | 7 | 0.34mi |
| 7250 Avenue C Houston, TX | 1.0–3.0 | 1.0–2.0 | 886 | $1,415 | $1.60 | 1d | 14 | 0.36mi |
| 217 N 72nd St Houston, TX | 2.0 | 2.0 | 1017 | $1,525 | $1.50 | 43d | 1 | 0.42mi |
| 7530 Canal St Unit 12 Houston, TX | 2.0 | 1.0 | 825 | $1,025 | $1.24 | 4d | 1 | 0.53mi |
| 7530 Canal St Houston, TX | 2.0 | 1.0 | 825 | $988 | $1.20 | 12d | 2 | 0.53mi |
| 7530 Canal St Houston, TX | 2.0 | 1.0 | 825 | $938 | $1.14 | 17d | 2 | 0.53mi |
| 503 71st St Houston, TX | 1.0 | 1.0 | 700 | $850 | $1.21 | 43d | 1 | 0.60mi |
| 505 N 71st St Unit B Houston, TX | 1.0 | 1.0 | 700 | $800 | $1.14 | 43d | 1 | 0.60mi |
| 507 N 71st St Unit D Houston, TX | 1.0 | 1.0 | 700 | $800 | $1.14 | 43d | 1 | 0.61mi |
| 7046 Avenue F Unit F Houston, TX | 1.0 | 1.0 | 700 | $800 | $1.14 | 43d | 1 | 0.62mi |
| 812 Maltby St Houston, TX | 2.0 | 1.0 | 860 | $600 | $0.70 | 43d | 1 | 0.77mi |
| 7043 Avenue L Houston, TX | 3.0 | 2.0 | 999 | $1,845 | $1.85 | 43d | 1 | 0.89mi |
| 7132 Lawndale St Houston, TX | 1.0–2.0 | 1.0 | 725 | $1,296 | $1.79 | 2d | 7 | 0.92mi |
| 1016 S Wayside Dr Houston, TX | 3.0 | 2.0 | 1021 | $1,425 | $1.40 | 43d | 1 | 0.94mi |
| 6526 Jamail Dr Houston, TX | 2.0 | 2.0 | 1025 | $1,449 | $1.41 | 43d | 1 | 0.98mi |
| 1010 S Wayside Dr Houston, TX | 1.0 | 1.0 | 700 | $1,255 | $1.79 | 43d | 1 | 1.00mi |
| 1010 S Wayside Dr Unit 505 Houston, TX | 2.0 | 1.0 | 844 | $1,602 | $1.90 | 43d | 1 | 1.01mi |
| 1010 S Wayside Dr Unit 504 Houston, TX | 2.0 | 1.0 | 844 | $1,398 | $1.66 | 43d | 1 | 1.01mi |
| 1010 S Wayside Dr Unit 402 Houston, TX | 2.0 | 2.0 | 950 | $1,659 | $1.75 | 43d | 1 | 1.01mi |
| 6620 Lawndale St Houston, TX | 2.0 | 1.0 | 901 | $1,700 | $1.89 | 43d | 1 | 1.01mi |
| 6520 Jamail Dr Houston, TX | 2.0 | 2.0 | 1025 | $1,504 | $1.47 | 2d | 4 | 1.01mi |
| 6707 Avenue F Unit F Houston, TX | 1.0 | 1.0 | 714 | $1,250 | $1.75 | 43d | 1 | 1.02mi |
| 956 Villa De Matel Rd Houston, TX | 2.0 | 1.0 | 928 | $1,039 | $1.12 | 21d | 1 | 1.04mi |
| 956 Villa De Matel Rd Houston, TX | 2.0 | 1.0 | 928 | $1,039 | $1.12 | 24d | 1 | 1.04mi |
| 956 Villa De Matel Rd Houston, TX | 1.0 | 1.0 | 736 | $899 | $1.22 | 17d | 1 | 1.04mi |
| 956 Villa De Matel Rd Houston, TX | 1.0 | 1.0 | 736 | $899 | $1.22 | 43d | 1 | 1.04mi |
| 916 Redwood St Houston, TX | 2.0 | 1.0 | 975 | $985 | $1.01 | 43d | 1 | 1.05mi |
| 916 Redwood St Houston, TX | 2.0 | 1.0 | 975 | $985 | $1.01 | 21d | 1 | 1.05mi |
| 916 Redwood St Houston, TX | 3.0 | 1.0 | 1209 | $1,140 | $0.94 | 24d | 1 | 1.05mi |
| 6601 Meadowlawn St Unit 3 Houston, TX | 1.0 | 1.0 | 785 | $989 | $1.26 | 18d | 1 | 1.06mi |
| 960 Villa De Matel Rd Houston, TX | 2.0 | 1.0 | 1056 | $1,129 | $1.07 | 24d | 1 | 1.07mi |
| 6403 Avenue C Unit 1019625P Houston, TX | 2.0–8.0 | 1.0–4.0 | 1232 | $2,478 | $2.01 | 2d | 2 | 1.24mi |
| 6602 Avenue R Unit D Houston, TX | 2.0 | 1.0 | 830 | $1,235 | $1.49 | 7d | 1 | 1.48mi |
Listing history 7 events
-
2026-06-18days on market $335,000 Active 9 DOM
-
2026-06-17days on market $335,000 Active 8 DOM
-
2026-06-16days on market $335,000 Active 7 DOM
-
2026-06-15days on market $335,000 Active 6 DOM
-
2026-06-13days on market $335,000 Active 4 DOM
-
2026-06-10remarks 670-char remark
-
2026-06-10$335,000 Active 1 DOM
ⓘ Source: listings_history table (triggers on properties + properties_extension) + one-shot
backfill from property_details.listing_events for pre-trigger history.
Tax reassessment forecast TX · Resets to sale price
- Current annual tax
- $4,252 · $354/mo
- Projected year-2 tax
- $6,130 · $511/mo
- Expected delta
- +$1,878/yr (+$157/mo · 44.2%)
ⓘ Screening estimate from a state-policy table — verify with the county assessor before closing.
Climate risk First Street
- Flood 5/10 Major FEMA zone X (unshaded) · 24% chance over 30 yrs
- Wildfire 1/10 Low
- Heat 9/10 Extreme 7 d/yr ≥109°F today · 24 d/yr by 30 yrs out
- Wind 9/10 Extreme 99% chance of damaging wind over 30 yrs
- Air quality 2/10 Low 2 unhealthy d/yr today · 2 by 30 yrs out
Nearby sold comps map
Loading sold comps map…
Walkable amenities ~0.75 mi
Loading nearby amenities…
Taxation est. · year 1
- Rental income
- $15,104
- − Mortgage interest
- −$18,765
- − Property taxes
- −$4,252
- − Insurance
- −$1,675
- − Repairs & maintenance
- −$1,208
- − Management
- −$1,208
- − Depreciation
- −$9,745
- Taxable loss
- −$21,750
- Est. tax savings @ 24.0%
- +$5,220
- After-tax cash flow
- $-9,856/yr
For passive investors: Depreciation is non-cash, so a rental often shows a tax loss while cash-flowing — sheltering income. Rental losses are passive: they offset passive income freely, and up to $25,000/yr can offset ordinary (W-2) income if you actively participate and your MAGI is under $100k (phasing out to $0 by $150k); unused losses carry forward. On sale, claimed depreciation is recaptured at up to 25%, and gains may owe capital-gains tax (a 1031 exchange can defer both). Figures are a year-1 estimate at your 24.0% rate — not tax advice; consult a CPA.
Schools (NCES district)
- District
- Houston ISD
- NCES district ID
- 4823640
- Math proficiency
- 27% ▼ -18.00%
- Reading proficiency
- 35% ▼ -6.00%
- Median HH income
- $46,054
- Composite
- 26.63/100
- National rank
- #7173
- State rank
- #593 of 826 in TX
Livability — Houston
- Score
- 74/100
- State rank
- #184
- US rank
- #4771
Category grades
Schools grade is shown separately in the Schools card above.
Census & demographics
- Census place
- Houston, TX
- County
- Harris County · 4,702,590 people
- City population
- 3,226,434
- Metro
- Houston-The Woodlands-Sugar Land, TX
- Population (ZIP)
- 14,940
- Household income
- $50,133
- Rent vs Own
- Severe rent burden
- 655.0
Population outlook (Harris County) Hauer SSP2
- Today (2025)
- 5,571,493 people
- By 2030
- 6,089,821 · +9.3%
- By 2040
- 7,142,806 · +28.2%
- By 2050
- 8,185,864 · +46.9%
- By 2075
- 10,574,329 · +89.8%
- By 2100
- 12,109,958 · +117.4%
Race, ethnicity, and origin ACS 2023
- Neighborhood character
- Predominantly Hispanic (88%)
- Race & ethnicity
- Hispanic / Latino 88% Two or more races 29% White 7% Black 3%
- Hispanic origin (detail)
- Mexican 81%
- Foreign-born
- 33% · Canada
- Languages at home
- 24% English-only · Spanish 76%
Political lean MEDSL · Harris
- 2024 margin
- Lean D (+5.5) · D 52.0% · R 46.4% · Other 1.6%
- 2008→2024 swing
- +3.9pp toward D · 2008: 1.6pp · 2024: 5.5pp
- All cycles
- 2024: D+5.5 2020: D+13.3 2016: D+12.4 2012: D+0.1 2008: D+1.6
Not yet ingested
- Civics
- —
Market trends
- HPI YoY
- ▲ 68.18%
- Current HPI
- 295.1198
- Rent YoY
- ▼ -2.93%
- Metro
- Houston-The Woodlands-Sugar Land, TX
- State GDP YoY
- ▲ 3.95%
- F500 in state
- 110
Industry mix (Fortune 500 HQ in TX)
| Industry | F500 HQs | Revenue |
|---|---|---|
| Energy | 16 | $1,198B |
|
||
| Technology | 5 | $198B |
|
||
| Engineering / Construction | 4 | $72B |
|
||
| Energy Services | 3 | $60B |
|
||
| Utilities | 3 | $41B |
|
||
| Healthcare | 2 | $330B |
|
||
Price history
+39.6% since first listed37 events — show timeline
- 2026-06-09 Listed $335,000 HARMLS
- 2025-04-14 Listing Removed — HARMLS
- 2025-03-17 Price Changed $300,000 HARMLS
- 2025-03-17 Price Changed $285,000 HARMLS
- 2025-03-17 Price Changed $300,000 HARMLS
- 2025-03-12 Price Changed $285,000 HARMLS
- 2025-02-21 Listing Removed — HARMLS
- 2025-02-21 Listed $300,000 HARMLS
- 2025-02-17 Listing Removed — HARMLS
- 2025-02-17 Listed $300,000 HARMLS
- 2025-02-14 Listed $300,000 HARMLS
- 2025-02-13 Coming Soon — HARMLS
- 2025-02-13 Listing Removed — HARMLS
- 2025-01-20 Listing Removed — HARMLS
- 2025-01-20 Listed $325,000 HARMLS
- 2025-01-13 Listed $340,000 HARMLS
- 2025-01-13 Price Changed $340,000 HARMLS
- 2025-01-06 Coming Soon — HARMLS
- 2024-11-12 Sold (Public Records) — Public Records
- 2024-11-07 Listing Removed — HARMLS
- 2024-11-07 Sold (MLS) — HARMLS
- 2024-10-29 Pending — HARMLS
- 2024-10-23 Pending — HARMLS
- 2024-10-21 Price Changed $205,000 HARMLS
- 2024-09-26 Relisted — HARMLS
- 2024-09-18 Pending — HARMLS
- 2024-09-13 Listed $215,000 HARMLS
- 2024-09-11 Coming Soon $215,000 HARMLS
- 2024-03-06 Listing Removed — HARMLS
- 2024-03-04 Relisted — HARMLS
- 2024-03-01 Pending — HARMLS
- 2024-02-26 Pending — HARMLS
- 2024-02-26 Pending — HARMLS
- 2024-02-16 Pending — HARMLS
- 2023-09-27 Price Changed $220,000 HARMLS
- 2023-09-04 Listed $240,000 HARMLS
- 1994-05-09 Sold (Public Records) — Public Records
Property tax history
+5.9%/yrLatest (2025): $4,252 · +1.5% YoY. Source: county tax records.
Cash-flow waterfall
monthlySold comps — $/sqft
last 12 mo · ≤1 miLoading sold comps…