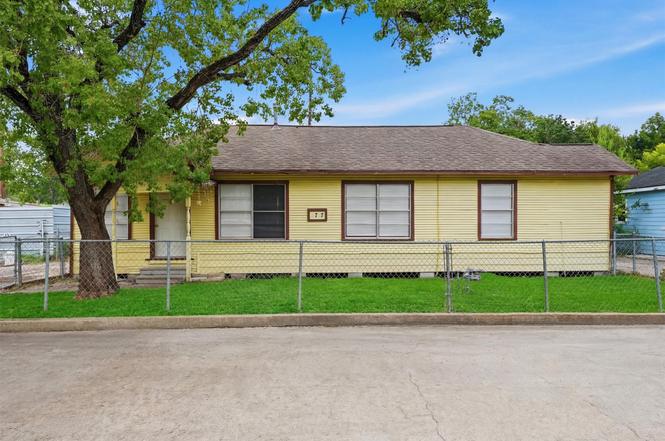
5717 Killough St · Houston, TX
Flood risk 1/10 · Minimal
- FEMA flood zone
- X (shaded)
- Chance of flooding over 30 yrs
- 0.0%
- Est. flood insurance / yr
- $507 – $1,088
Fire risk 2/10 · Minimal
- Est. fire insurance / yr
- $1,222 – $2,270
Heat risk 9/10 · Severe
- Hot days now (above 110°F)
- 7 days/yr
- Hot days in 30 yrs
- 23 days/yr
Wind risk 9/10 · Severe
- Chance of severe wind over 30 yrs
- 99.0%
Air-quality risk 3/10 · Minor
- Unhealthy air days now
- 3 days/yr
- Unhealthy air days in 30 yrs
- 4 days/yr
Risk factors via First Street. Map © Google.
Why this score? — see what drove the C- grade
The composite is a weighted blend of 9 inputs, each scored 0–100. Each bar is that input's sub-score; the figure is the points it added to the 100-point composite (weight × sub-score).
- Cash flow +17.3/30.0
- ARV discount +7.5/15.0
- Appreciation +5.8/10.0
- DSCR +5.4/10.0
- 1% rule +4.5/10.0
- Schools +4.1/10.0
- Livability +3.7/5.0
- Condition / age +2.5/5.0
- Rent growth +2.2/5.0
$140,000
🖨 Deal sheet 📄 Offer letter ✓ Due diligence
Listing remarks
Nestled in a quiet cul-de-sac, this 3-bedroom, 2-bath home offers great potential for investors or buyers looking to add their personal touch. With a cozy layout and solid foundation, this property is ready for updates and improvements to bring out its full value. Whether you're looking for your next renovation project, rental property, or future home, this is an opportunity you won't want to miss.
Key facts
- 7,448 sq ft lot
- Built 1950
- Listed 3 days
Property features AI
Finance
- HOA & community: Curbs in the community
Exterior
- Parking: No parking
- Utilities: Public water; Public sewer; Electric service
- Home design: Residential property; Faces west
- Construction: Built in 1950; Cement siding and wood siding; Composition roof; Block foundation
- Exterior features: Partial fence; Fence; Cul-de-sac lot; Located in a subdivision; Concrete road frontage
Interior
- Bedrooms: Primary bedroom on the first floor (17 x 12); Bedroom on the first floor (11 x 10); Bedroom on the first floor (10 x 10); Three total rooms
- Flooring: Plank flooring; Vinyl flooring
- Bathrooms: One full bathroom
- Heating & cooling: Central heating (gas); Central electric air conditioning; Thermostat (energy-efficient)
- Interior features: Laminate counters; Tub with shower; Ceiling fan(s); Combined living and dining area; Programmable thermostat
- Laundry & utility: Washer hookup; Electric dryer hookup
Neighborhood map
What this means for you Summary
Snapshot
- This is a 3-bed/2.0-bath single-family listed at $140k.
Deal economics
- At list price, monthly cash flow is $102 ($1k/yr) — positive.
- The deal already cash-flows at list — no discount required.
- To meet the 1% rule (rent ≥ 1% of price), the offer needs to be $133k (4.9% below list).
- Recommended offer: $133k (4.9% below list) — sets the bar for 1% rule.
Location & tenants
- Location reads 74/100 on livability (#184 in TX, #4,771 nationally) — a middle-class / working-renter tenant base. Strengths: amenities A+, cost of living A+, housing A+; Watch: crime F.
- Klein ISD (suburban): math 41% / reading 48% proficiency, ranked #213 of 826 in TX (top 26%) — families likely to look elsewhere, expect single-tenant / working-renter base with shorter leases.
- Zoned schools: Klein Forest H S (math 20% / reading 28%, grade F, #1,333 of 1,632 statewide, top 82%, 3,481 students, 79% FRL) — zoned schools average 79% FRL vs 37% district-wide (42 pts higher); higher-poverty schools than district average — tighter screening recommended.
- Zoned-school proficiency averages 24% at this address vs 44% district-wide (-20 pts) — the specific schools serving this property underperform the Klein ISD average; the district grade overstates school quality for this exact location.
- Market conditions: Rents soft (-1.2%/yr); 79 active listings in the ZIP; 11 comparable units currently listed for rent nearby; rentals leasing fast (median 7d on market — plan ~1-2 weeks tenant-placement turnaround); 29,883 units permitted in Harris County in 2024 (8,621 in 5+ unit buildings).
Forward outlook
- In year one you build about $3k of equity ($968 loan paydown + $2k appreciation (1.6% local appreciation)).
- Harris County population projected at +47% by 2050 — long-run rental-demand tailwind backs the buy-and-hold thesis.
- At projected returns (1.6% appreciation + 0.0% rent growth), your $39k cash investment doubles in ~9 years — after that, you're playing with house money.
- By year 10, paydown + projected appreciation supports a ~$32k cash-out refi (75% LTV) — recoverable capital for the next deal without selling this one.
Negotiation context
- Only 3 days on market — expect competitive offers; lowballing is unlikely to land.
- 2 sale attempts since 18y ago with the ask held roughly flat each time — persistent listings suggest the price (not the market) is what's stuck; bring a comps-based counter.
Risks & watch-outs
- Watch-outs: built in 1950 — expect roof / HVAC / electrical / plumbing capex.
- Climate carrying-cost: severe wind risk, 99% chance of damaging wind over 30y; extreme-heat days projected 7→23/yr by 2055 (HVAC capex compounding) — expect insurance premiums to compound above CPI over the hold.
Questions for the listing agent
- Built in 1950 — when were the roof, HVAC, electrical panel, plumbing, and water heater last replaced?
- Is there a deadline driving the sale (1031 exchange, divorce, estate, relocation)? That informs how much negotiation room exists.
- Schools are D-rated, which usually means shorter tenancies and higher turnover. Who's the typical renter profile here, and what's been the actual vacancy rate?
- Crime grade is F in this area — have there been break-ins, vandalism, or insurance claims at this property in the last 3 years? What carrier currently insures it and at what premium?
- What's the average days-on-market for RENTAL listings here right now (not sales)? A rising rental-DOM trend means longer vacancies and softer asking-rent achievability than the comps imply.
- What's the recent tenant-quality profile in this submarket — average credit score on applications, eviction rate, late-payment / NSF rate, and stable-employment percentage? A property-management company in the area should have these aggregated.
- How much new for-sale + rental construction is in the pipeline within 1–3 miles? Heavy new supply typically softens prices + rents 12–24 months out; constrained supply supports both.
Investment metrics
- 1% rule
- 0.95% ✗
- Cap rate
- 7.16%
- Cash-on-cash
- 3.11%
- DSCR
- 1.14
- GRM
- 8.8
CMA / ARV
- ARV (on-the-fly)
- $635,440
- Comps found
- 2
Show comp detail 2 sales within ~0.75 mi
| Address | Dist | Beds/Ba | Sqft | Sold | Price | $/sf | Match |
|---|---|---|---|---|---|---|---|
| 5737 Killough St | 0.02mi | 2/1.0 (-1) | 980 (-6%) | 22mo | $100,500 | $103 | 62 |
| 5622 Breen Dr | 0.25mi | 2/1.0 (-1) | 900 (-14%) | 8mo | $550,000 | $611 | 50 |
Match score weights: distance 35% · size 25% · config 20% · recency 20%. Top-matched comps best support the ARV.
Projected returns pro-forma
1.6% appreciation · 0.0% rent growth · sell at horizon
- IRR
- 4.6%
- Equity multiple
- 1.24×
- Total profit
- $9,355
- Equity at exit
- $52,207
- IRR
- 6.9%
- Equity multiple
- 1.84×
- Total profit
- $32,981
- Equity at exit
- $72,929
Cash invested: $39,200 (down + closing). Projections, not guarantees.
Landlord ↔ Tenant lean methodology
- Overall (STATE)
- 87 Strongly Landlord-Friendly
- State Texas
- 87 Strongly Landlord-Friendly · R+5
- County
- — inherits STATE
- City
- — inherits STATE
ZIP-level market 77086
- Home prices YoY
- 0.6%
- Rents YoY
- -1.2%
- Active inventory
- 79
- Price-to-rent
- 8.8×
Monthly cashflow live
- Estimated rent
- $1,331 high interval (Pro) →
- Mortgage (P&I)
- −$734
- Tax from tax record
- −$157 /mo · $1,886/yr
- Insurance
- −$58
- HOA
- −$0
- Vacancy / Maint / Mgmt
- −$279
- Net cashflow
- $102
Break-even live
UW: 25.0% down · 7.5% · 30yr · 1.5% tax · 5.0% vac · 8.0% maint · 8.0% mgmt
Financing live
Cash to close
- Down payment
- $35,000
- Closing costs
- $4,200
- Reserves months
- —
- Total cash needed
- —
Loan-product check · same deal, 3 products live
Conventional
25% down · 7.5% · 30yr
- Down + closing
- —
- Monthly P&I
- —
- Monthly cashflow
- —
- DSCR
- —
- Eligible?
- —
Personal DTI + credit; lowest rate.
DSCR
20% down · 8.5% · 30yr
- Down + closing
- —
- Monthly P&I
- —
- Monthly cashflow
- —
- DSCR
- —
- Eligible?
- —
No personal income docs; deal must DSCR.
Hard money
10% down · 12.0% · 12mo
- Down + closing
- —
- Monthly P&I
- —
- Monthly cashflow
- —
- DSCR
- —
- Eligible?
- —
Short-term bridge; refi at stabilization.
Rent comps 11 comps
| Address | Beds | Baths | Sqft | Rent | $/sqft | DOM | Units | Dist |
|---|---|---|---|---|---|---|---|---|
| 12011 Madison Oak St Houston, TX | 3.0 | 2.0 | 1442 | $1,800 | $1.25 | 7d | 1 | 0.86mi |
| 13 Regency Ln Houston, TX | 2.0 | 2.0 | 1354 | $1,650 | $1.22 | 43d | 1 | 0.95mi |
| 11111 W Montgomery Rd Unit 2174 Houston, TX | 2.0 | 2.0 | 964 | $992 | $1.03 | 11d | 1 | 1.01mi |
| 11111 W Montgomery Rd Unit 2292 Houston, TX | 2.0 | 2.0 | 964 | $931 | $0.97 | 43d | 1 | 1.01mi |
| 11111 W Montgomery Rd Unit 2162 Houston, TX | 2.0 | 2.0 | 964 | $957 | $0.99 | 7d | 1 | 1.01mi |
| 11111 W Montgomery Rd Unit 2174 Houston, TX | 2.0 | 2.0 | 964 | $949 | $0.98 | 2d | 1 | 1.01mi |
| 11111 W Montgomery Rd Unit 2047 Houston, TX | 2.0 | 2.0 | 964 | $981 | $1.02 | 2d | 1 | 1.02mi |
| 7100 Smiling Woods Ln Houston, TX | 2.0 | 2.0 | 1039 | $1,314 | $1.26 | 17d | 1 | 1.22mi |
| 7100 Smiling Woods Ln Houston, TX | 1.0–2.0 | 1.0–2.0 | 821 | $1,347 | $1.64 | 1d | 25 | 1.22mi |
| 7150 Smiling Woods Ln Houston, TX | 1.0–2.0 | 1.0–2.0 | 797 | $1,383 | $1.74 | 1d | 13 | 1.34mi |
| 12752 N Houston Rosslyn Rd Houston, TX | 1.0–3.0 | 1.0–2.0 | 922 | $1,963 | $2.13 | 1d | 13 | 1.49mi |
Listing history 4 events
-
2026-06-18days on market $140,000 Active 3 DOM
-
2026-06-17days on market $140,000 Active 2 DOM
-
2026-06-15remarks 401-char remark
-
2026-06-15$140,000 Active 1 DOM
ⓘ Source: listings_history table (triggers on properties + properties_extension) + one-shot
backfill from property_details.listing_events for pre-trigger history.
Tax reassessment forecast TX · Resets to sale price
- Current annual tax
- $1,886 · $157/mo
- Projected year-2 tax
- $2,562 · $214/mo
- Expected delta
- +$676/yr (+$56/mo · 35.8%)
ⓘ Screening estimate from a state-policy table — verify with the county assessor before closing.
Climate risk First Street
- Flood 1/10 Low FEMA zone X (shaded) · 0% chance over 30 yrs
- Wildfire 2/10 Low
- Heat 9/10 Extreme 7 d/yr ≥110°F today · 23 d/yr by 30 yrs out
- Wind 9/10 Extreme 99% chance of damaging wind over 30 yrs
- Air quality 3/10 Moderate 3 unhealthy d/yr today · 4 by 30 yrs out
Nearby sold comps map
Loading sold comps map…
Walkable amenities ~0.75 mi
Loading nearby amenities…
Taxation est. · year 1
- Rental income
- $15,971
- − Mortgage interest
- −$7,842
- − Property taxes
- −$1,886
- − Insurance
- −$700
- − Repairs & maintenance
- −$1,278
- − Management
- −$1,278
- − Depreciation
- −$4,073
- Taxable loss
- −$1,085
- Est. tax savings @ 24.0%
- +$261
- After-tax cash flow
- $1,481/yr
For passive investors: Depreciation is non-cash, so a rental often shows a tax loss while cash-flowing — sheltering income. Rental losses are passive: they offset passive income freely, and up to $25,000/yr can offset ordinary (W-2) income if you actively participate and your MAGI is under $100k (phasing out to $0 by $150k); unused losses carry forward. On sale, claimed depreciation is recaptured at up to 25%, and gains may owe capital-gains tax (a 1031 exchange can defer both). Figures are a year-1 estimate at your 24.0% rate — not tax advice; consult a CPA.
Schools (NCES district)
- District
- Klein ISD
- NCES district ID
- 4825740
- Math proficiency
- 41% ▼ -12.00%
- Reading proficiency
- 48% ▼ -3.00%
- Median HH income
- $78,288
- Composite
- 40.91/100
- National rank
- #3615
- State rank
- #213 of 826 in TX
Livability — Houston
- Score
- 74/100
- State rank
- #184
- US rank
- #4771
Category grades
Schools grade is shown separately in the Schools card above.
Census & demographics
- County
- Harris County · 4,702,590 people
- City population
- 3,226,434
- Metro
- Houston-The Woodlands-Sugar Land, TX
- Population (ZIP)
- 28,653
- Household income
- $58,200
- Rent vs Own
- Severe rent burden
- 1323.0
Population outlook (Harris County) Hauer SSP2
- Today (2025)
- 5,571,493 people
- By 2030
- 6,089,821 · +9.3%
- By 2040
- 7,142,806 · +28.2%
- By 2050
- 8,185,864 · +46.9%
- By 2075
- 10,574,329 · +89.8%
- By 2100
- 12,109,958 · +117.4%
Race, ethnicity, and origin ACS 2023
- Neighborhood character
- Diverse neighborhood (Simpson 0.55)
- Race & ethnicity
- Hispanic / Latino 63% Two or more races 26% Black 19% Asian 9% White 7%
- Hispanic origin (detail)
- Mexican 47%
- Common ancestry
- Slovak 1%
- Foreign-born
- 34% · Canada, Vietnam
- Languages at home
- 38% English-only · Spanish 54% Vietnamese 6% Other Asian/Pacific 1%
Political lean MEDSL · Harris
- 2024 margin
- Lean D (+5.5) · D 52.0% · R 46.4% · Other 1.6%
- 2008→2024 swing
- +3.9pp toward D · 2008: 1.6pp · 2024: 5.5pp
- All cycles
- 2024: D+5.5 2020: D+13.3 2016: D+12.4 2012: D+0.1 2008: D+1.6
Not yet ingested
- Civics
- —
Market trends
- HPI YoY
- ▲ 1.60%
- Current HPI
- 281.0065
- Rent YoY
- ▼ -1.19%
- Metro
- Houston-The Woodlands-Sugar Land, TX
- State GDP YoY
- ▲ 3.95%
- F500 in state
- 110
Industry mix (Fortune 500 HQ in TX)
| Industry | F500 HQs | Revenue |
|---|---|---|
| Energy | 16 | $1,198B |
|
||
| Technology | 5 | $198B |
|
||
| Engineering / Construction | 4 | $72B |
|
||
| Energy Services | 3 | $60B |
|
||
| Utilities | 3 | $41B |
|
||
| Healthcare | 2 | $330B |
|
||
Price history
+166.7% since first listed6 events — show timeline
- 2026-06-15 Listed $140,000 HARMLS
- 2021-06-08 Sold (Public Records) — Public Records
- 2008-07-31 Listing Removed — HARMLS
- 2008-01-22 Listed $52,500 HARMLS
- 2006-05-23 Sold (Public Records) — Public Records
- 2004-02-03 Sold (Public Records) — Public Records
Property tax history
+2.6%/yrLatest (2025): $1,886 · +18.4% YoY. Source: county tax records.
Cash-flow waterfall
monthlySold comps — $/sqft
last 12 mo · ≤1 miLoading sold comps…