 Duplex
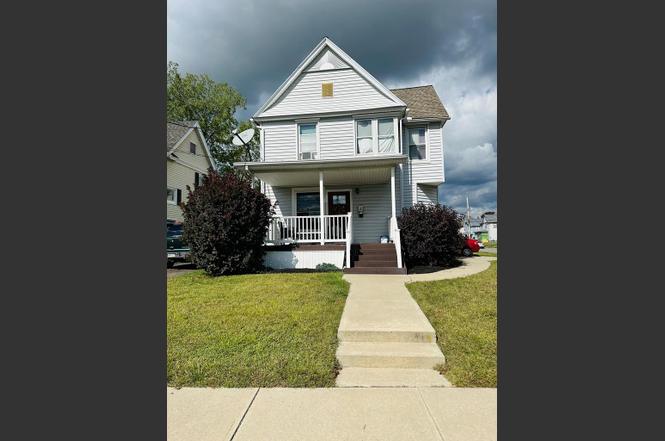
334 West Lockhart St · Sayre, PA
Flood risk 1/10 · Minimal
- FEMA flood zone
- X (unshaded)
- Chance of flooding over 30 yrs
- 0.0%
- Est. flood insurance / yr
- $507 – $1,088
Fire risk 1/10 · Minimal
- Est. fire insurance / yr
- $511 – $949
Heat risk 3/10 · Minor
- Hot days now (above 96°F)
- 7 days/yr
- Hot days in 30 yrs
- 16 days/yr
Wind risk 2/10 · Minimal
- Chance of severe wind over 30 yrs
- 1.0%
Air-quality risk 2/10 · Minimal
- Unhealthy air days now
- 0 days/yr
- Unhealthy air days in 30 yrs
- 1 days/yr
Risk factors via First Street. Map © Google.
Why this score? — see what drove the D grade
The composite is a weighted blend of 9 inputs, each scored 0–100. Each bar is that input's sub-score; the figure is the points it added to the 100-point composite (weight × sub-score).
- Cash flow +14.8/30.0
- ARV discount +7.5/15.0
- DSCR +4.5/10.0
- 1% rule +4.1/10.0
- Livability +3.8/5.0
- Schools +3.7/10.0
- Rent growth +2.5/5.0
- Condition / age +2.5/5.0
- Appreciation +0.0/10.0
$219,000
🖨 Deal sheet (PDF) 📄 Offer letter ✓ Due diligence
Multi-family units
County records classify this as Multi-Family (5+ Unit). Listing-text estimate: 2 units. estimate disagrees with records
5+ unit building — per-unit beds/baths from public records are typically unavailable; the breakdown below (if shown) is an estimate from the listing text.
Listing remarks
Beautifully maintained duplex in the heart of Sayre—just blocks from Robert Packer Hospital! This mint-condition property is a rare find, offering a fantastic live-in investment opportunity or a valuable addition to your portfolio. Each unit is spacious, clean, and move-in ready, with mostly separate utilities and quality finishes throughout. Home has off-street parking and a strong rental history; this turnkey property combines convenience and income potential. Don't miss your chance to see this gem!
Key facts
- Turnkey property
- Off-street parking
- Duplex
Tags
Neighborhood map
What this means for you Summary
Snapshot
- This is a 2 × 2-bed/1.0-bath units multifamily listed at $219k.
Deal economics
- At list price, monthly cash flow is $59 ($704/yr) — positive. Per door: $29/mo.
- The deal already cash-flows at list — no discount required.
- To meet the 1% rule (rent ≥ 1% of price), the offer needs to be $199k (9.1% below list).
- Recommended offer: $199k (9.1% below list) — sets the bar for 1% rule.
- Cap rate 6.6% vs local median 3.7% in Sayre — top-decile yield for the area; either an underpriced asset or a hidden risk that comps aren't pricing in. Stress-test before assuming the spread holds.
Location & tenants
- Location reads 75/100 on livability (#419 in PA, #3,808 nationally) — a middle-class / working-renter tenant base. Strengths: crime A+, cost of living A+, housing A+; Watch: amenities F, commute F, employment F.
- Sayre Area SD (town): math 34% / reading 54% proficiency, ranked #299 of 539 in PA (top 56%) — families likely to look elsewhere, expect single-tenant / working-renter base with shorter leases.
- Zoned schools: Snyder El Sch (math 39% / reading 58%, grade D, #718 of 1,518 statewide, top 48%, 468 students, 100% FRL); Sayre Area Hs (math 26% / reading 47%, grade F, #296 of 437 statewide, top 68%, 435 students, 93% FRL) — zoned schools average 96% FRL vs 40% district-wide (57 pts higher); higher-poverty schools than district average — tighter screening recommended.
- Market conditions: 44 active listings in the ZIP; 66 units permitted in Bradford County in 2024 (0 in 5+ unit buildings).
Forward outlook
- Local home prices are declining (-3.0%/yr); year-one equity from $2k of loan paydown is wiped out by about $7k of value loss. Plan a longer hold.
- Bradford County population projected at -23% by 2050 — secular population decline; favor cash flow + early exit over multi-decade hold.
Negotiation context
- It's been on market 114 days — a 9% lower offer ($199k) is reasonable based on typical stale-listing flexibility.
Risks & watch-outs
- Watch-outs: built in 1900 — expect roof / HVAC / electrical / plumbing capex.
Questions for the listing agent
- It's been on market 114 days. Have you received any prior offers? Is the seller open to a 9% concession, seller financing, or rate buy-down credit?
- Can we see the unit-by-unit rent roll, current vacancy, and any below-market leases? What's the average tenancy length?
- What capital expenditures (roof, boiler, parking lot, exteriors) have been made in the last 5 years, and what's planned in the next 2?
- Built in 1900 — when were the roof, HVAC, electrical panel, plumbing, and water heater last replaced?
- Why hasn't it sold? Are there any deal-killer items the seller is aware of (foundation, flood, title, zoning, code violations)?
- Is there a deadline driving the sale (1031 exchange, divorce, estate, relocation)? That informs how much negotiation room exists.
- The area grade is low — what's the realistic commute time and amenity access for the typical tenant pool here? Any planned neighborhood developments (good or bad) we should know about?
- What's the average days-on-market for RENTAL listings here right now (not sales)? A rising rental-DOM trend means longer vacancies and softer asking-rent achievability than the comps imply.
- What's the recent tenant-quality profile in this submarket — average credit score on applications, eviction rate, late-payment / NSF rate, and stable-employment percentage? A property-management company in the area should have these aggregated.
- How much new apartment / multifamily construction is in the pipeline within 1–3 miles? Heavy new supply (>2% of stock underway) typically softens rents 12–24 months out; light construction supports rent growth.
Investment metrics
- 1% rule
- 0.91% ✗
- Cap rate
- 6.61%
- Cash-on-cash
- 1.15%
- DSCR
- 1.05
- GRM
- 9.2
CMA / ARV
No comps found within radius.
Projected returns pro-forma
-3.0% appreciation · 3.0% rent growth · sell at horizon
- IRR
- -14.5%
- Equity multiple
- 0.48×
- Total profit
- $-31,723
- Equity at exit
- $32,654
- IRR
- -5.7%
- Equity multiple
- 0.63×
- Total profit
- $-22,692
- Equity at exit
- $18,935
Cash invested: $61,320 (down + closing). Projections, not guarantees.
Landlord ↔ Tenant lean methodology
- Overall (STATE)
- 62 Landlord-Friendly
- State Pennsylvania
- 62 Landlord-Friendly · EVEN
- County
- — inherits STATE
- City
- — inherits STATE
ZIP-level market 18840
- Home prices YoY
- -32.9%
- Active inventory
- 44
- Price-to-rent
- 18.3×
Monthly cashflow live
- Estimated rent
- $1,990 medium interval (Pro) →
- Mortgage (P&I)
- −$1,148
- Tax est. 1.5%
- −$274 /mo · $3,285/yr
- Insurance
- −$91
- HOA
- −$0
- Vacancy / Maint / Mgmt
- −$418
- Net cashflow
- $59
Break-even live
Sensitivity live
| Price | -10% $210 | -5% $134 | +0% $59 | +5% $-17 | +10% $-93 |
|---|---|---|---|---|---|
| Rent | -10% $-99 | -5% $-20 | +0% $59 | +5% $137 | +10% $216 |
| Rate | -1.0pp $169 | -0.5pp $114 | base $59 | +0.5pp $2 | +1.0pp $-56 |
2-unit breakdown (identical units grouped — click to expand)
| Units | Beds | Baths | Est. rent |
|---|---|---|---|
| 2× units | 2 | 1 | $1,990 |
| #1 | 2 | 1 | $995 |
| #2 | 2 | 1 | $995 |
| Total (2 units) | $1,990 | ||
UW: 25.0% down · 7.5% · 30yr · 1.5% tax · 5.0% vac · 8.0% maint · 8.0% mgmt
Financing live
Cash to close
- Down payment
- $54,750
- Closing costs
- $6,570
- Reserves months
- —
- Total cash needed
- —
Loan-product check · same deal, 3 products live
Conventional
25% down · 7.5% · 30yr
- Down + closing
- —
- Monthly P&I
- —
- Monthly cashflow
- —
- DSCR
- —
- Eligible?
- —
Personal DTI + credit; lowest rate.
DSCR
20% down · 8.5% · 30yr
- Down + closing
- —
- Monthly P&I
- —
- Monthly cashflow
- —
- DSCR
- —
- Eligible?
- —
No personal income docs; deal must DSCR.
Hard money
10% down · 12.0% · 12mo
- Down + closing
- —
- Monthly P&I
- —
- Monthly cashflow
- —
- DSCR
- —
- Eligible?
- —
Short-term bridge; refi at stabilization.
Listing history 4 events
-
2026-01-21status Pending
-
2025-10-17price $219,000
-
2025-09-28$229,000 Active
-
2022-03-16price $850
ⓘ Source: listings_history table (triggers on properties + properties_extension) + one-shot
backfill from property_details.listing_events for pre-trigger history.
Climate risk First Street
- Flood 1/10 Low FEMA zone X (unshaded) · 0% chance over 30 yrs
- Wildfire 1/10 Low
- Heat 3/10 Moderate 7 d/yr ≥96°F today · 16 d/yr by 30 yrs out
- Wind 2/10 Low 100% chance of damaging wind over 30 yrs
- Air quality 2/10 Low 0 unhealthy d/yr today · 1 by 30 yrs out
Nearby sold comps map
Loading sold comps map…
Walkable amenities ~0.75 mi
Loading nearby amenities…
Taxation est. · year 1
- Rental income
- $23,880
- − Mortgage interest
- −$12,267
- − Property taxes
- −$3,285
- − Insurance
- −$1,095
- − Repairs & maintenance
- −$1,910
- − Management
- −$1,910
- − Depreciation
- −$6,371
- Taxable loss
- −$2,959
- Est. tax savings @ 24.0%
- +$710
- After-tax cash flow
- $1,414/yr
For passive investors: Depreciation is non-cash, so a rental often shows a tax loss while cash-flowing — sheltering income. Rental losses are passive: they offset passive income freely, and up to $25,000/yr can offset ordinary (W-2) income if you actively participate and your MAGI is under $100k (phasing out to $0 by $150k); unused losses carry forward. On sale, claimed depreciation is recaptured at up to 25%, and gains may owe capital-gains tax (a 1031 exchange can defer both). Figures are a year-1 estimate at your 24.0% rate — not tax advice; consult a CPA.
Schools (NCES district)
- District
- Sayre Area SD
- NCES district ID
- 4220850
- Math proficiency
- 34% ▼ -7.00%
- Reading proficiency
- 54% ▼ -3.00%
- Median HH income
- $42,919
- Composite
- 37.05/100
- National rank
- #4509
- State rank
- #299 of 539 in PA
Livability — Sayre
- Score
- 75/100
- State rank
- #419
- US rank
- #3808
Category grades
Schools grade is shown separately in the Schools card above.
Census & demographics
- Census place
- Sayre, PA
- Population (ZIP)
- 11,249
Population outlook (Bradford County) Hauer SSP2
- Today (2025)
- 57,236 people
- By 2030
- 54,660 · -4.5%
- By 2040
- 49,502 · -13.5%
- By 2050
- 44,277 · -22.6%
- By 2075
- 33,420 · -41.6%
- By 2100
- 22,919 · -60.0%
Race, ethnicity, and origin ACS 2023
- Neighborhood character
- Predominantly White (93%)
- Race & ethnicity
- White 93% Two or more races 3% Hispanic / Latino 2% Black 1%
- Common ancestry
- Romanian 3% Slovak 2% Iranian 2%
- Foreign-born
- 5% · Canada
- Languages at home
- 96% English-only · Other Indo-European 1% Spanish 1%
Political lean MEDSL · Bradford
- 2024 margin
- Solid R (+47.9) · D 25.6% · R 73.5%
- 2008→2024 swing
- -29.5pp toward R · 2008: -18.4pp · 2024: -47.9pp
- All cycles
- 2024: R+47.9 2020: R+44.9 2016: R+46.0 2012: R+24.6 2008: R+18.4
Not yet ingested
- Civics
- —
Market trends
- HPI YoY
- ▼ -82.43%
- Current HPI
- 167.8622
- Rent YoY
- —
- Metro
- —
- State GDP YoY
- ▲ 1.68%
- F500 in state
- 34
Industry mix (Fortune 500 HQ in PA)
| Industry | F500 HQs | Revenue |
|---|---|---|
| Healthcare | 2 | $309B |
|
||
| Insurance | 2 | $27B |
|
||
| Telecommunications / Media | 1 | $124B |
|
||
| Industrial Distribution | 1 | $22B |
|
||
| Financial Services | 1 | $20B |
|
||
| Chemicals / Materials | 1 | $18B |
|
||
Price history
-4.4% since first listed4 events — show timeline
- 2026-01-21 Pending — NMPA
- 2025-10-17 Price Changed $219,000 NMPA
- 2025-09-28 Listed $229,000 NMPA
- 2022-03-16 Price Changed $850 RENT.
Cash-flow waterfall
monthlySold comps — $/sqft
last 12 mo · ≤1 miLoading sold comps…