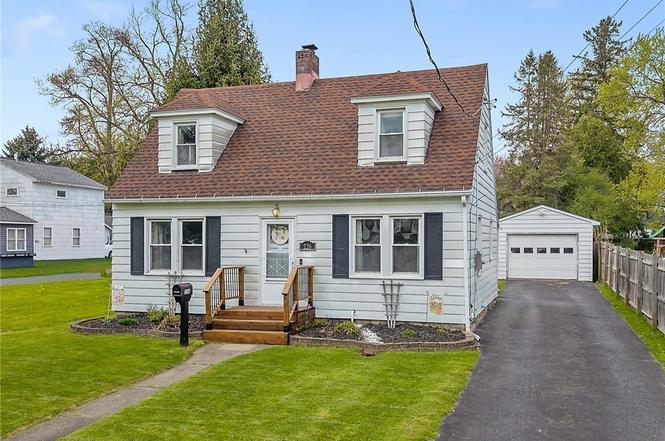
226 Richfield Blvd · Mattydale, NY
Flood risk 1/10 · Minimal
- FEMA flood zone
- X (unshaded)
- Chance of flooding over 30 yrs
- 0.0%
- Est. flood insurance / yr
- $473 – $860
Fire risk 1/10 · Minimal
- Est. fire insurance / yr
- $691 – $1,283
Heat risk 3/10 · Minor
- Hot days now (above 95°F)
- 7 days/yr
- Hot days in 30 yrs
- 16 days/yr
Wind risk 1/10 · Minimal
- Chance of severe wind over 30 yrs
- 0.0%
Air-quality risk 2/10 · Minimal
- Unhealthy air days now
- 0 days/yr
- Unhealthy air days in 30 yrs
- 1 days/yr
Risk factors via First Street. Map © Google.
Why this score? — see what drove the C grade
The composite is a weighted blend of 9 inputs, each scored 0–100. Each bar is that input's sub-score; the figure is the points it added to the 100-point composite (weight × sub-score).
- Cash flow +13.2/30.0
- ARV discount +10.5/15.0
- Appreciation +10.0/10.0
- 1% rule +5.0/10.0
- Schools +4.2/10.0
- DSCR +4.0/10.0
- Livability +3.6/5.0
- Rent growth +2.5/5.0
- Condition / age +2.5/5.0
$179,900
🖨 Deal sheet (PDF) 📄 Offer letter ✓ Due diligence
Listing remarks MLS
Great home in North Syracuse school district. Cute capecod with majority of the work completed so you just have to move in! There has been $40,000 of improvements including new windows, new roof, new enclosed porch, new shed, heated garage and interior work done such as updated bathroom and kitchen, including appliances. Great starter home that is immaculate with lovely decor and cared for condition. Look at this home that has great value! Also forgot to mention close to all stores as well as walking distance to parks, library and the school.
Key facts
- Front porch steps
- Brick fireplace
- Mid century charm
Tags
Property features AI
Exterior
- Parking: Detached garage with garage door opener; 1 garage space
- Utilities: Electricity connected; Public water connected; Sewer connected; Cable available; High speed internet available
- Home design: Single-story home; Resale property; Asphalt roof
- Construction: Aluminum siding; Block foundation; Built as an existing structure
- Exterior features: Blacktop driveway; Fully fenced yard; Shed(s)/storage
Interior
- Kitchen: Dishwasher; Gas oven; Gas range; Microwave; Refrigerator
- Bedrooms: 6 total rooms (includes bedrooms and living spaces)
- Flooring: Hardwood; Varies
- Bathrooms: 1 full bathroom
- Heating & cooling: Gas heating (hot water); Central air conditioning
- Interior features: Separate/formal dining room; Full basement; Family room
- Laundry & utility: Laundry located in basement; Gas water heater
Neighborhood map
What this means for you Summary
Snapshot
- This is a 2-bed/1.0-bath single-family listed at $180k.
Deal economics
- At list price, monthly cash flow is $-3 ($-34/yr) — negative.
- To cash-flow at today's rent, offer at most $179k (0.3% below list).
- To meet the 1% rule (rent ≥ 1% of price), the offer needs to be $179k (0.5% below list).
- Recommended offer: $179k (0.5% below list) — sets the bar for 1% rule.
Location & tenants
- Location reads 72/100 on livability (#360 in NY) — a middle-class / working-renter tenant base. Strengths: cost of living A+, housing A+, health & safety A+; Watch: schools D, crime D, amenities F.
- North Syracuse Central School District (suburban): math 45% / reading 50% proficiency, ranked #402 of 590 in NY (top 68%) — families likely to look elsewhere, expect single-tenant / working-renter base with shorter leases.
- Market conditions: 20 active listings in the ZIP; 5 comparable units currently listed for rent nearby; rentals lingering (median 45d on market — plan ~5-8 weeks vacancy on turnover, expect pricing pressure); 60% of comp listings sitting > 30 days — soft ceiling on asking rent; 616 units permitted in Onondaga County in 2024 (256 in 5+ unit buildings).
Forward outlook
- In year one you build about $19k of equity ($1k loan paydown + $18k appreciation (10.0% local appreciation)).
- Onondaga County population projected to shrink 9% by 2050 — rents likely to lag national; underwrite the cash flow, not the appreciation.
- At projected returns (10.0% appreciation + 3.0% rent growth), your $50k cash investment doubles in ~3 years — after that, you're playing with house money.
- By year 2, paydown + projected appreciation supports a ~$31k cash-out refi (75% LTV) — recoverable capital for the next deal without selling this one.
Negotiation context
- Only 6 days on market — expect competitive offers; lowballing is unlikely to land.
- 2 sale attempts since 13y ago with the ask held roughly flat each time — persistent listings suggest the price (not the market) is what's stuck; bring a comps-based counter.
- Current owner paid $86k; list at $180k implies a 110% gain — meaningful room to come down on a strong offer.
Risks & watch-outs
- Watch-outs: property tax is 2.7% of price; built in 1941 — expect roof / HVAC / electrical / plumbing capex.
Questions for the listing agent
- What do current leases actually rent for vs. the listed asking? Can we see a recent rent roll and the last 12 months of T-12 income?
- Built in 1941 — when were the roof, HVAC, electrical panel, plumbing, and water heater last replaced?
- Property tax is high relative to price — has the assessment been appealed recently, and will the sale trigger a re-assessment?
- Is there a deadline driving the sale (1031 exchange, divorce, estate, relocation)? That informs how much negotiation room exists.
- Schools are D-rated, which usually means shorter tenancies and higher turnover. Who's the typical renter profile here, and what's been the actual vacancy rate?
- Crime grade is D in this area — have there been break-ins, vandalism, or insurance claims at this property in the last 3 years? What carrier currently insures it and at what premium?
- What's the average days-on-market for RENTAL listings here right now (not sales)? A rising rental-DOM trend means longer vacancies and softer asking-rent achievability than the comps imply.
- What's the recent tenant-quality profile in this submarket — average credit score on applications, eviction rate, late-payment / NSF rate, and stable-employment percentage? A property-management company in the area should have these aggregated.
- How much new for-sale + rental construction is in the pipeline within 1–3 miles? Heavy new supply typically softens prices + rents 12–24 months out; constrained supply supports both.
Investment metrics
- 1% rule
- 1.00% ✗
- Cap rate
- 6.27%
- Cash-on-cash
- -0.07%
- DSCR
- 1.00
- GRM
- 8.4
CMA / ARV
- ARV (on-the-fly)
- $192,780
- Comps found
- 12
Show comp detail 12 sales within ~0.75 mi
| Address | Dist | Beds/Ba | Sqft | Sold | Price | $/sf | Match |
|---|---|---|---|---|---|---|---|
| 302 Richfield Blvd | 0.06mi | 3/1.0 (+1) | 1,120 (-11%) | 3mo | $190,000 | $170 | 71 |
| 321 Richfield Blvd | 0.15mi | 3/1.0 (+1) | 1,180 (-6%) | 9mo | $150,000 | $127 | 70 |
| 162 Mc Alpine St | 0.29mi | 3/1.5 (+1) | 1,344 (+7%) | 3mo | $209,000 | $156 | 66 |
| 121 W Molloy Rd | 0.24mi | 3/2.0 (+1) | 1,176 (-7%) | 8mo | $170,000 | $145 | 62 |
| 301 Richfield Blvd | 0.06mi | 3/2.0 (+1) | 1,100 (-13%) | 6mo | $167,301 | $152 | 62 |
| 200 Leonard St | 0.24mi | 3/1.5 (+1) | 1,125 (-11%) | 5mo | $172,500 | $153 | 60 |
| 132 Lind Ave | 0.68mi | 3/1.0 (+1) | 1,284 (+2%) | 2mo | $190,000 | $148 | 58 |
| 203 Brookline Rd | 0.44mi | 3/1.0 (+1) | 1,126 (-11%) | 2mo | $190,000 | $169 | 55 |
| 117 Raphael Ave | 0.41mi | 2/1.0 | 1,404 (+11%) | 11mo | $181,000 | $129 | 53 |
| 217 Mitchell Ave | 0.55mi | 3/2.0 (+1) | 1,370 (+9%) | 5mo | $190,000 | $139 | 47 |
| 311 Raphael Ave | 0.44mi | 3/1.0 (+1) | 1,116 (-11%) | 10mo | $175,000 | $157 | 47 |
| 416 Garden City Dr | 0.30mi | 3/2.0 (+1) | 1,080 (-14%) | 9mo | $199,900 | $185 | 46 |
Match score weights: distance 35% · size 25% · config 20% · recency 20%. Top-matched comps best support the ARV.
Projected returns pro-forma
10.0% appreciation · 3.0% rent growth · sell at horizon
- IRR
- 24.3%
- Equity multiple
- 2.94×
- Total profit
- $97,934
- Equity at exit
- $162,068
- IRR
- 21.5%
- Equity multiple
- 6.73×
- Total profit
- $288,807
- Equity at exit
- $349,506
Cash invested: $50,372 (down + closing). Projections, not guarantees.
Landlord ↔ Tenant lean methodology
- Overall (STATE)
- 15 Strongly Tenant-Friendly
- State New York
- 15 Strongly Tenant-Friendly · D+10
- County
- — inherits STATE
- City
- — inherits STATE
ZIP-level market 13211
- Home prices YoY
- 10.7%
- Active inventory
- 20
- Price-to-rent
- 8.4×
Monthly cashflow live
- Estimated rent
- $1,791 high interval (Pro) →
- Mortgage (P&I)
- −$943
- Tax from tax record
- −$399 /mo · $4,790/yr
- Insurance
- −$75
- HOA
- −$0
- Vacancy / Maint / Mgmt
- −$376
- Net cashflow
- $-3
Break-even live
Sensitivity live
| Price | -10% $99 | -5% $48 | +0% $-3 | +5% $-54 | +10% $-105 |
|---|---|---|---|---|---|
| Rent | -10% $-144 | -5% $-74 | +0% $-3 | +5% $68 | +10% $139 |
| Rate | -1.0pp $88 | -0.5pp $43 | base $-3 | +0.5pp $-49 | +1.0pp $-97 |
UW: 25.0% down · 7.5% · 30yr · 1.5% tax · 5.0% vac · 8.0% maint · 8.0% mgmt
Financing live
Cash to close
- Down payment
- $44,975
- Closing costs
- $5,397
- Reserves months
- —
- Total cash needed
- —
Loan-product check · same deal, 3 products live
Conventional
25% down · 7.5% · 30yr
- Down + closing
- —
- Monthly P&I
- —
- Monthly cashflow
- —
- DSCR
- —
- Eligible?
- —
Personal DTI + credit; lowest rate.
DSCR
20% down · 8.5% · 30yr
- Down + closing
- —
- Monthly P&I
- —
- Monthly cashflow
- —
- DSCR
- —
- Eligible?
- —
No personal income docs; deal must DSCR.
Hard money
10% down · 12.0% · 12mo
- Down + closing
- —
- Monthly P&I
- —
- Monthly cashflow
- —
- DSCR
- —
- Eligible?
- —
Short-term bridge; refi at stabilization.
Rent comps 5 comps
| Address | Beds | Baths | Sqft | Rent | $/sqft | DOM | Units | Dist |
|---|---|---|---|---|---|---|---|---|
| 106 Harrington St Syracuse, NY | 3.0 | 1.0 | 1168 | $1,875 | $1.61 | 45d | 1 | 0.33mi |
| 2802 Lemoyne Ave Unit 1 Syracuse, NY | 3.0 | 1.0 | 988 | $1,700 | $1.72 | 15d | 1 | 0.35mi |
| 1132 Wolf St Unit 4 Syracuse, NY | 3.0 | 1.0 | 1041 | $1,350 | $1.30 | 45d | 1 | 1.03mi |
| 103 Hyland Dr Syracuse, NY | 3.0 | 1.0 | 1260 | $2,400 | $1.90 | 15d | 1 | 1.20mi |
| 286 Ross Park Syracuse, NY | 3.0 | 1.0 | 1100 | $1,500 | $1.36 | 45d | 1 | 1.31mi |
Listing history 5 events
-
2026-06-21days on market $179,900 Active 6 DOM
-
2026-06-18days on market $179,900 Active 3 DOM
-
2026-06-17days on market $179,900 Active 2 DOM
-
2026-06-15remarks 699-char remark
-
2026-06-15$179,900 Active 1 DOM
ⓘ Source: listings_history table (triggers on properties + properties_extension) + one-shot
backfill from property_details.listing_events for pre-trigger history.
Tax reassessment forecast NY · Partial reset (capped growth)
- Current annual tax
- $4,790 · $399/mo
- Projected year-2 tax
- $4,790 · $399/mo
- Expected delta
- $0/yr ($0/mo · 0.0%)
ⓘ Screening estimate from a state-policy table — verify with the county assessor before closing.
Climate risk First Street
- Flood 1/10 Low FEMA zone X (unshaded) · 0% chance over 30 yrs
- Wildfire 1/10 Low
- Heat 3/10 Moderate 7 d/yr ≥95°F today · 16 d/yr by 30 yrs out
- Wind 1/10 Low 0% chance of damaging wind over 30 yrs
- Air quality 2/10 Low 0 unhealthy d/yr today · 1 by 30 yrs out
Nearby sold comps map
Loading sold comps map…
Walkable amenities ~0.75 mi
Loading nearby amenities…
Taxation est. · year 1
- Rental income
- $21,489
- − Mortgage interest
- −$10,077
- − Property taxes
- −$4,790
- − Insurance
- −$900
- − Repairs & maintenance
- −$1,719
- − Management
- −$1,719
- − Depreciation
- −$5,233
- Taxable loss
- −$2,949
- Est. tax savings @ 24.0%
- +$708
- After-tax cash flow
- $674/yr
For passive investors: Depreciation is non-cash, so a rental often shows a tax loss while cash-flowing — sheltering income. Rental losses are passive: they offset passive income freely, and up to $25,000/yr can offset ordinary (W-2) income if you actively participate and your MAGI is under $100k (phasing out to $0 by $150k); unused losses carry forward. On sale, claimed depreciation is recaptured at up to 25%, and gains may owe capital-gains tax (a 1031 exchange can defer both). Figures are a year-1 estimate at your 24.0% rate — not tax advice; consult a CPA.
Schools (NCES district)
- District
- North Syracuse Central School District
- NCES district ID
- 3621210
- Math proficiency
- 45% ▼ -9.00%
- Reading proficiency
- 50% ▲ 1.00%
- Median HH income
- $62,904
- Composite
- 41.93/100
- National rank
- #3356
- State rank
- #402 of 590 in NY
Livability — Mattydale
- Score
- 72/100
- State rank
- #360
- US rank
- #6130
Category grades
Schools grade is shown separately in the Schools card above.
Census & demographics
- Census place
- Mattydale, NY
- City population
- 6,155
- Population (ZIP)
- 6,155
Population outlook (Onondaga County) Hauer SSP2
- Today (2025)
- 467,894 people
- By 2030
- 463,381 · -1.0%
- By 2040
- 447,697 · -4.3%
- By 2050
- 426,399 · -8.9%
- By 2075
- 373,661 · -20.1%
- By 2100
- 307,967 · -34.2%
Race, ethnicity, and origin ACS 2023
- Neighborhood character
- Predominantly White (78%)
- Race & ethnicity
- White 78% Two or more races 7% Asian 5% Hispanic / Latino 5% Black 4%
- Common ancestry
- Romanian 7% Lithuanian 5% Iranian 2%
- Foreign-born
- 5% · Philippines, India, Vietnam
- Languages at home
- 93% English-only · Other Indo-European 2% Other Asian/Pacific 2% Russian/Polish/Slavic 1%
Political lean MEDSL · Onondaga
- 2024 margin
- D (+17.3) · D 58.6% · R 41.4%
- 2008→2024 swing
- -3.0pp toward R · 2008: 20.3pp · 2024: 17.3pp
- All cycles
- 2024: D+17.3 2020: D+20.6 2016: D+12.8 2012: D+21.1 2008: D+20.3
Not yet ingested
- Civics
- —
Market trends
- HPI YoY
- ▲ 31.87%
- Current HPI
- 330.266
- Rent YoY
- —
- Metro
- —
- State GDP YoY
- ▲ 2.60%
- F500 in state
- 92
Industry mix (Fortune 500 HQ in NY)
| Industry | F500 HQs | Revenue |
|---|---|---|
| Financial Services | 10 | $950B |
|
||
| Consumer Goods | 9 | $162B |
|
||
| Insurance | 4 | $225B |
|
||
| Telecommunications | 2 | $144B |
|
||
| Pharmaceuticals | 2 | $112B |
|
||
| Media / Entertainment | 2 | $69B |
|
||
Price history
+110.4% since first listed6 events — show timeline
- 2026-06-15 Listed $179,900 CNYIS
- 2014-05-14 Sold (Public Records) $85,500 Public Records
- 2014-04-25 Listing Removed — CNYIS
- 2014-04-23 Sold (MLS) $85,500 CNYIS
- 2013-08-19 Listed $88,900 CNYIS
- 2007-05-10 Sold (Public Records) $85,500 Public Records
Property tax history
+1.5%/yrLatest (2025): $4,790 · -0.7% YoY. Source: county tax records.
Cash-flow waterfall
monthlySold comps — $/sqft
last 12 mo · ≤1 miLoading sold comps…