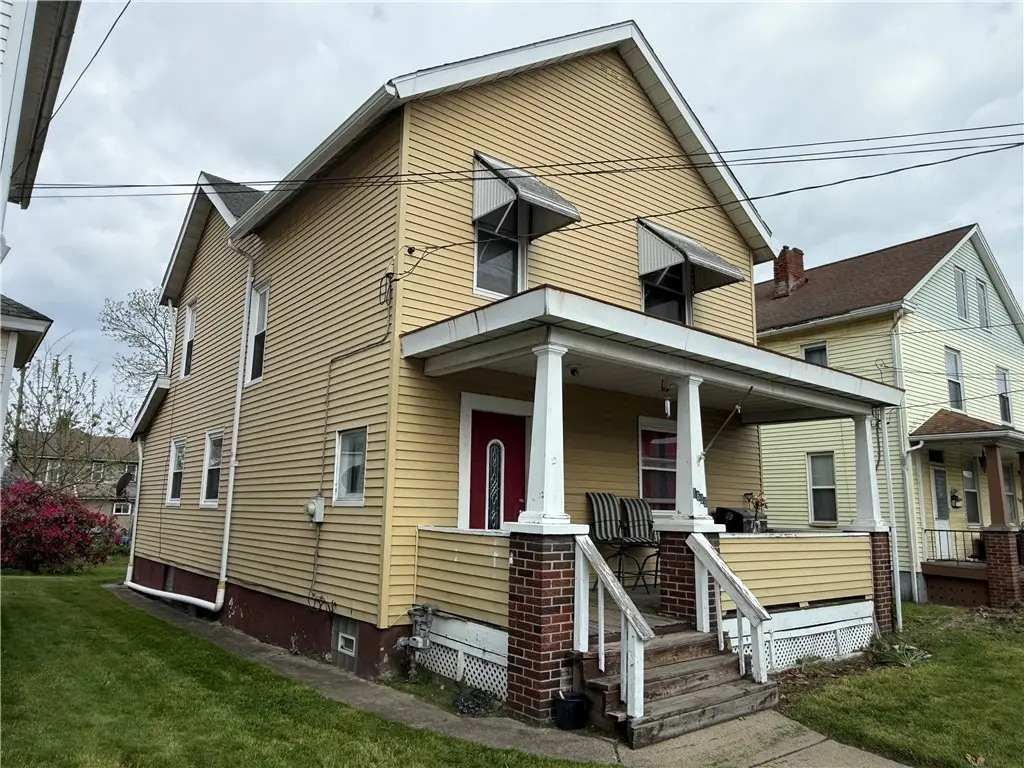
1608 Hanna St · New Castle, PA
Flood risk 1/10 · Minimal
- FEMA flood zone
- X (unshaded)
- Chance of flooding over 30 yrs
- 0.0%
- Est. flood insurance / yr
- $473 – $860
Fire risk 1/10 · Minimal
- Est. fire insurance / yr
- $511 – $949
Heat risk 3/10 · Minor
- Hot days now (above 95°F)
- 7 days/yr
- Hot days in 30 yrs
- 18 days/yr
Wind risk 1/10 · Minimal
- Chance of severe wind over 30 yrs
- —
Air-quality risk 2/10 · Minimal
- Unhealthy air days now
- 1 days/yr
- Unhealthy air days in 30 yrs
- 3 days/yr
Risk factors via First Street. Map © Google.
Why this score? — see what drove the C+ grade
The composite is a weighted blend of 9 inputs, each scored 0–100. Each bar is that input's sub-score; the figure is the points it added to the 100-point composite (weight × sub-score).
- Cash flow +30.0/30.0
- 1% rule +10.0/10.0
- DSCR +10.0/10.0
- ARV discount +4.4/15.0
- Livability +4.1/5.0
- Rent growth +2.5/5.0
- Condition / age +2.5/5.0
- Schools +1.1/10.0
- Appreciation +0.0/10.0
$58,600
🖨 Deal sheet 📄 Offer letter ✓ Due diligence
Listing remarks MLS
Attention Investors: this 3 bedroom 1.5 bath home is currently rented with up to date lease A great addition to any portfolio or for someone looking to start one.
Key facts
- 4,573 sq ft lot
- Garage
- Built 1926
Neighborhood map
What this means for you Summary
Snapshot
- This is a 3-bed/1.0-bath single-family listed at $59k.
Deal economics
- At list price, monthly cash flow is $714 ($9k/yr) — positive.
- The deal already cash-flows at list — no discount required.
- Meets the 1% rule at list price ($1k rent vs $59k).
- Recommended offer: $52k (12.0% below list) — sets the bar for market timing.
- Cap rate 20.9% vs local median 8.7% in New Castle — top-decile yield for the area; either an underpriced asset or a hidden risk that comps aren't pricing in. Stress-test before assuming the spread holds.
Location & tenants
- Location reads 82/100 on livability (#137 in PA, #1,120 nationally) — a professional / high-income tenant draw. Strengths: crime A+, commute A+, cost of living A+; Watch: amenities F, employment F.
- New Castle Area SD (town): math 9% / reading 19% proficiency, ranked #519 of 539 in PA (top 96%) — low school quality limits family demand, transient renter base, plan for 1-2y turnover; 66% free/reduced lunch — lower-income household profile, screen leases tightly.
- Market conditions: 17 active listings in the ZIP; 7 comparable units currently listed for rent nearby; rentals lingering (median 44d on market — plan ~5-8 weeks vacancy on turnover, expect pricing pressure); 100% of comp listings sitting > 30 days — soft ceiling on asking rent; 51 units permitted in Lawrence County in 2024 (0 in 5+ unit buildings).
Forward outlook
- Local home prices are declining (-3.0%/yr); year-one equity from $405 of loan paydown is wiped out by about $2k of value loss. Plan a longer hold.
- Lawrence County population projected at -25% by 2050 — secular population decline; favor cash flow + early exit over multi-decade hold.
- At projected returns (-3.0% appreciation + 3.0% rent growth), your $16k cash investment doubles in ~3 years — after that, you're playing with house money.
Negotiation context
- It's been on market 128 days — a 12% lower offer ($52k) is reasonable based on typical stale-listing flexibility.
- 4 sale attempts since 6y ago with the ask held roughly flat each time — persistent listings suggest the price (not the market) is what's stuck; bring a comps-based counter.
- Current owner paid $27k; list at $59k implies a 117% gain — meaningful room to come down on a strong offer.
Risks & watch-outs
- Watch-outs: built in 1926 — expect roof / HVAC / electrical / plumbing capex.
Questions for the listing agent
- It's been on market 128 days. Have you received any prior offers? Is the seller open to a 12% concession, seller financing, or rate buy-down credit?
- Built in 1926 — when were the roof, HVAC, electrical panel, plumbing, and water heater last replaced?
- Why hasn't it sold? Are there any deal-killer items the seller is aware of (foundation, flood, title, zoning, code violations)?
- Is there a deadline driving the sale (1031 exchange, divorce, estate, relocation)? That informs how much negotiation room exists.
- What's the average days-on-market for RENTAL listings here right now (not sales)? A rising rental-DOM trend means longer vacancies and softer asking-rent achievability than the comps imply.
- What's the recent tenant-quality profile in this submarket — average credit score on applications, eviction rate, late-payment / NSF rate, and stable-employment percentage? A property-management company in the area should have these aggregated.
- How much new for-sale + rental construction is in the pipeline within 1–3 miles? Heavy new supply typically softens prices + rents 12–24 months out; constrained supply supports both.
Investment metrics
- 1% rule
- 2.46% ✓
- Cap rate
- 20.92%
- Cash-on-cash
- 52.23%
- DSCR
- 3.32
- GRM
- 3.4
CMA / ARV
- ARV (median comp)
- $54,788
- List price
- $58,600
- Delta
- 6.96%
- Verdict
- FAIR
- Comps
- 20 within 1.0 mi
Show comp detail 12 sales within ~0.75 mi
| Address | Dist | Beds/Ba | Sqft | Sold | Price | $/sf | Match |
|---|---|---|---|---|---|---|---|
| 1605 S Jefferson St | 0.04mi | 3/1.0 | 1,500 (-9%) | 11mo | $48,900 | $33 | 74 |
| 1930 Morris St | 0.26mi | 3/2.0 | 1,533 (-7%) | 10mo | $143,330 | $93 | 63 |
| 34 W Chartes St | 0.18mi | 3/1.0 | 1,444 (-12%) | 11mo | $67,000 | $46 | 62 |
| 1708 Moravia St | 0.29mi | 3/2.0 | 1,824 (+11%) | 4mo | $43,500 | $24 | 61 |
| 1902 Hamilton St | 0.26mi | 3/1.5 | 1,428 (-13%) | 4mo | $33,000 | $23 | 60 |
| 517 Electric St | 0.40mi | 3/1.0 | 1,404 (-15%) | 1mo | $44,000 | $31 | 55 |
| 407 E Lutton St | 0.60mi | 4/1.0 (+1) | 1,665 (+1%) | 13mo | $53,000 | $32 | 55 |
| 2211 Gilmore St | 0.55mi | 2/2.0 (-1) | 1,704 (+3%) | 8mo | $148,000 | $87 | 53 |
| 503 E Lutton St | 0.64mi | 3/1.5 | 1,492 (-10%) | 6mo | $66,000 | $44 | 48 |
| 1016 Agnew St | 0.48mi | 3/1.5 | 1,404 (-15%) | 9mo | $40,000 | $28 | 43 |
| 738 Addis | 0.74mi | 3/2.0 | 1,853 (+12%) | 3mo | $168,000 | $91 | 38 |
| 1103 Summit St | 0.59mi | 3/1.0 | 1,400 (-15%) | 12mo | $54,000 | $39 | 37 |
Match score weights: distance 35% · size 25% · config 20% · recency 20%. Top-matched comps best support the ARV.
Projected returns pro-forma
-3.0% appreciation · 3.0% rent growth · sell at horizon
- IRR
- 50.2%
- Equity multiple
- 3.20×
- Total profit
- $36,024
- Equity at exit
- $8,737
- IRR
- 55.7%
- Equity multiple
- 6.49×
- Total profit
- $90,074
- Equity at exit
- $5,067
Cash invested: $16,408 (down + closing). Projections, not guarantees.
Landlord ↔ Tenant lean methodology
- Overall (STATE)
- 62 Landlord-Friendly
- State Pennsylvania
- 62 Landlord-Friendly · EVEN
- County
- — inherits STATE
- City
- — inherits STATE
ZIP-level market 16102
- Home prices YoY
- -9.6%
- Active inventory
- 17
- Price-to-rent
- 3.4×
Monthly cashflow live
- Estimated rent
- $1,439 high interval (Pro) →
- Mortgage (P&I)
- −$307
- Tax from tax record
- −$91 /mo · $1,092/yr
- Insurance
- −$24
- HOA
- −$0
- Vacancy / Maint / Mgmt
- −$302
- Net cashflow
- $714
Break-even live
UW: 25.0% down · 7.5% · 30yr · 1.5% tax · 5.0% vac · 8.0% maint · 8.0% mgmt
Financing live
Cash to close
- Down payment
- $14,650
- Closing costs
- $1,758
- Reserves months
- —
- Total cash needed
- —
Loan-product check · same deal, 3 products live
Conventional
25% down · 7.5% · 30yr
- Down + closing
- —
- Monthly P&I
- —
- Monthly cashflow
- —
- DSCR
- —
- Eligible?
- —
Personal DTI + credit; lowest rate.
DSCR
20% down · 8.5% · 30yr
- Down + closing
- —
- Monthly P&I
- —
- Monthly cashflow
- —
- DSCR
- —
- Eligible?
- —
No personal income docs; deal must DSCR.
Hard money
10% down · 12.0% · 12mo
- Down + closing
- —
- Monthly P&I
- —
- Monthly cashflow
- —
- DSCR
- —
- Eligible?
- —
Short-term bridge; refi at stabilization.
Rent comps 7 comps
| Address | Beds | Baths | Sqft | Rent | $/sqft | DOM | Units | Dist |
|---|---|---|---|---|---|---|---|---|
| 1605 S Jefferson St New Castle, PA | 3.0 | 1.0 | 1500 | $1,500 | $1.00 | 43d | 1 | 0.01mi |
| 1708 Moravia St New Castle, PA | 3.0 | 2.0 | 1500 | $1,500 | $1.00 | 43d | 1 | 0.28mi |
| 503 Galbreath St New Castle, PA | 2.0 | 1.0 | 1228 | $1,295 | $1.05 | 43d | 1 | 0.36mi |
| 712 E Reynolds St New Castle, PA | 3.0 | 1.0 | 1182 | $975 | $0.82 | 43d | 1 | 0.72mi |
| 1510 Huron Ave New Castle, PA | 3.0 | 1.0 | 1560 | $1,475 | $0.95 | 43d | 1 | 1.05mi |
| 932 Morton St New Castle, PA | 3.0 | 1.0 | 1440 | $1,375 | $0.95 | 43d | 1 | 1.13mi |
| 1056 Adams St New Castle, PA | 3.0 | 1.0 | 1116 | $1,500 | $1.34 | 43d | 1 | 1.43mi |
Listing history 25 events
-
2026-06-19days on market $58,600 Active 128 DOM
-
2026-06-18days on market $58,600 Active 127 DOM
-
2026-06-17days on market $58,600 Active 126 DOM
-
2026-06-16days on market $58,600 Active 125 DOM
-
2026-06-15days on market $58,600 Active 124 DOM
-
2026-06-14days on market $58,600 Active 122 DOM
-
2026-06-12days on market $58,600 Active 121 DOM
-
2026-06-09days on market $58,600 Active 118 DOM
-
2026-06-08days on market $58,600 Active 117 DOM
-
2026-06-07days on market $58,600 Active 116 DOM
-
2026-06-03days on market $58,600 Active 112 DOM
-
2026-06-02days on market $58,600 Active 111 DOM
-
2026-06-01days on market $58,600 Active 110 DOM
-
2026-05-31days on market $58,600 Active 109 DOM
-
2026-05-30days on market $58,600 Active 108 DOM
-
2026-02-11$58,600 Active 163-char remark
Show marketing remark (163 chars)
Attention Investors: this 3 bedroom 1.5 bath home is currently rented with up to date lease A great addition to any portfolio or for someone looking to start one.
-
2024-10-12status Active 292-char remark
Show marketing remark (292 chars)
Investor Alert! Another very clean tenant on this 3 bedroom, 2 story with a 1 car detached garage. Repairs currently being made to the enclosed gutter system. This also has a convenient 1st floor laundry and 1/2 bath! Besides the 3 bedrooms has an extra 9x7 room for storage or a 4th bedroom!
-
2024-10-08historical Contingent 292-char remark
Show marketing remark (292 chars)
Investor Alert! Another very clean tenant on this 3 bedroom, 2 story with a 1 car detached garage. Repairs currently being made to the enclosed gutter system. This also has a convenient 1st floor laundry and 1/2 bath! Besides the 3 bedrooms has an extra 9x7 room for storage or a 4th bedroom!
-
2024-05-25$50,000 Active 292-char remark
Show marketing remark (292 chars)
Investor Alert! Another very clean tenant on this 3 bedroom, 2 story with a 1 car detached garage. Repairs currently being made to the enclosed gutter system. This also has a convenient 1st floor laundry and 1/2 bath! Besides the 3 bedrooms has an extra 9x7 room for storage or a 4th bedroom!
-
2021-02-24soldstatus $27,000 Closed
-
2021-01-08status Pending
-
2020-10-13$30,000 Active
-
2016-08-24soldstatus $26,000
-
2004-10-14soldstatus $15,000
-
1997-09-30soldstatus $29,500
ⓘ Source: listings_history table (triggers on properties + properties_extension) + one-shot
backfill from property_details.listing_events for pre-trigger history.
Tax reassessment forecast PA · Partial reset (capped growth)
- Current annual tax
- $1,092 · $91/mo
- Projected year-2 tax
- $1,092 · $91/mo
- Expected delta
- $0/yr ($0/mo · 0.0%)
ⓘ Screening estimate from a state-policy table — verify with the county assessor before closing.
Climate risk First Street
- Flood 1/10 Low FEMA zone X (unshaded) · 0% chance over 30 yrs
- Wildfire 1/10 Low
- Heat 3/10 Moderate 7 d/yr ≥95°F today · 18 d/yr by 30 yrs out
- Wind 1/10 Low
- Air quality 2/10 Low 1 unhealthy d/yr today · 3 by 30 yrs out
Nearby sold comps map
Loading sold comps map…
Walkable amenities ~0.75 mi
Loading nearby amenities…
Taxation est. · year 1
- Rental income
- $17,269
- − Mortgage interest
- −$3,283
- − Property taxes
- −$1,092
- − Insurance
- −$293
- − Repairs & maintenance
- −$1,382
- − Management
- −$1,382
- − Depreciation
- −$1,705
- Taxable income
- $8,134
- Est. tax owed @ 24.0%
- −$1,952
- After-tax cash flow
- $6,618/yr
For passive investors: Depreciation is non-cash, so a rental often shows a tax loss while cash-flowing — sheltering income. Rental losses are passive: they offset passive income freely, and up to $25,000/yr can offset ordinary (W-2) income if you actively participate and your MAGI is under $100k (phasing out to $0 by $150k); unused losses carry forward. On sale, claimed depreciation is recaptured at up to 25%, and gains may owe capital-gains tax (a 1031 exchange can defer both). Figures are a year-1 estimate at your 24.0% rate — not tax advice; consult a CPA.
Schools (NCES district)
- District
- New Castle Area SD
- NCES district ID
- 4216620
- Math proficiency
- 9% ▼ -13.00%
- Reading proficiency
- 19% ▼ -23.00%
- Median HH income
- $30,967
- Composite
- 11.08/100
- National rank
- #9736
- State rank
- #519 of 539 in PA
Livability — New Castle
- Score
- 82/100
- State rank
- #137
- US rank
- #1120
Category grades
Schools grade is shown separately in the Schools card above.
Census & demographics
- Census place
- New Castle, PA
- City population
- 30,767
- Population (ZIP)
- 4,933
Population outlook (Lawrence County) Hauer SSP2
- Today (2025)
- 81,781 people
- By 2030
- 77,978 · -4.7%
- By 2040
- 69,522 · -15.0%
- By 2050
- 61,344 · -25.0%
- By 2075
- 45,027 · -44.9%
- By 2100
- 31,305 · -61.7%
Race, ethnicity, and origin ACS 2023
- Neighborhood character
- Predominantly White (91%)
- Race & ethnicity
- White 91% Two or more races 6% Black 2%
- Common ancestry
- Romanian 11% Serbian 3% Slovak 2%
- Foreign-born
- 0%
- Languages at home
- 98% English-only · German/W. Germanic 1% Other Indo-European 1%
Political lean MEDSL · Lawrence
- 2024 margin
- Solid R (+33.8) · D 32.8% · R 66.5%
- 2008→2024 swing
- -28.7pp toward R · 2008: -5.1pp · 2024: -33.8pp
- All cycles
- 2024: R+33.8 2020: R+29.6 2016: R+28.1 2012: R+9.0 2008: R+5.1
Not yet ingested
- Civics
- —
Market trends
- HPI YoY
- ▼ -16.16%
- Current HPI
- 153.0061
- Rent YoY
- —
- Metro
- —
- State GDP YoY
- ▲ 1.68%
- F500 in state
- 34
Industry mix (Fortune 500 HQ in PA)
| Industry | F500 HQs | Revenue |
|---|---|---|
| Healthcare | 2 | $309B |
|
||
| Insurance | 2 | $27B |
|
||
| Telecommunications / Media | 1 | $124B |
|
||
| Industrial Distribution | 1 | $22B |
|
||
| Financial Services | 1 | $20B |
|
||
| Chemicals / Materials | 1 | $18B |
|
||
Price history
+98.6% since first listed10 events — show timeline
- 2026-02-11 Listed $58,600 West Penn MLS
- 2024-10-12 Relisted — West Penn MLS
- 2024-10-08 Contingent — West Penn MLS
- 2024-05-25 Listed $50,000 West Penn MLS
- 2021-02-24 Sold (MLS) $27,000 West Penn MLS
- 2021-01-08 Pending — West Penn MLS
- 2020-10-13 Listed $30,000 West Penn MLS
- 2016-08-24 Sold (Public Records) $26,000 Public Records
- 2004-10-14 Sold (Public Records) $15,000 Public Records
- 1997-09-30 Sold (Public Records) $29,500 Public Records
Property tax history
+1.3%/yrLatest (2025): $1,092 · -0.5% YoY. Source: county tax records.
Cash-flow waterfall
monthlySold comps — $/sqft
last 12 mo · ≤1 miLoading sold comps…