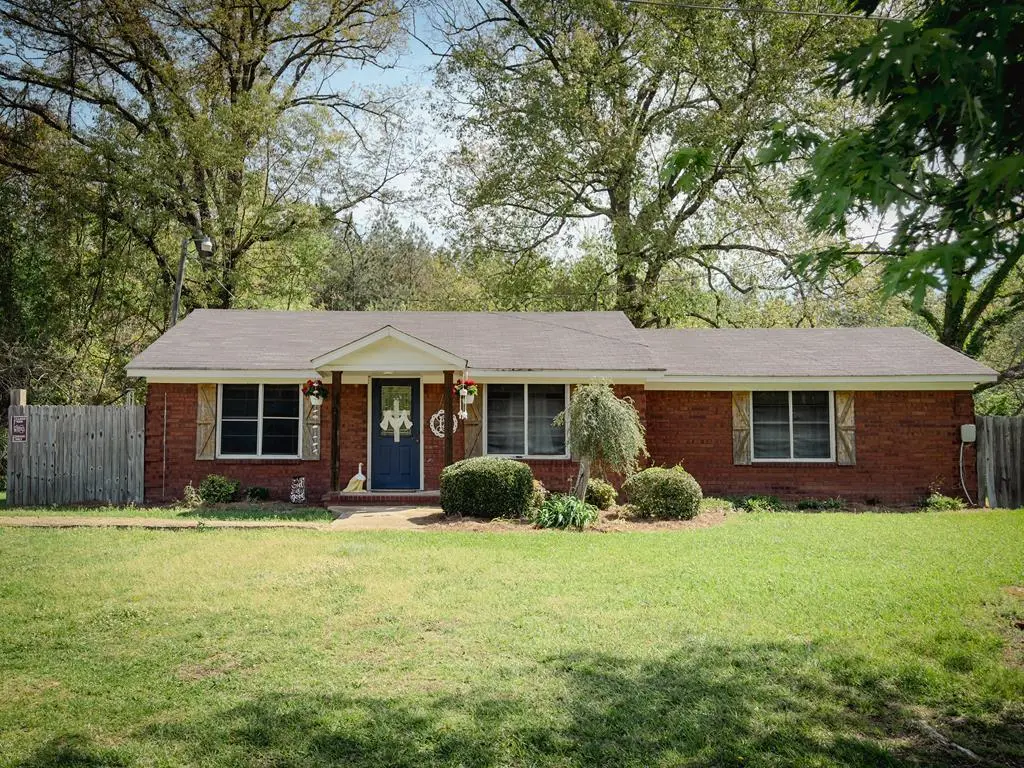
80 County Road 130 · Bruce, MS
Flood risk 1/10 · Minimal
- FEMA flood zone
- X (unshaded)
- Chance of flooding over 30 yrs
- 0.0%
- Est. flood insurance / yr
- $507 – $1,088
Fire risk 4/10 · Minor
- Est. fire insurance / yr
- $1,241 – $2,305
Heat risk 6/10 · Moderate
- Hot days now (above 109°F)
- 7 days/yr
- Hot days in 30 yrs
- 21 days/yr
Wind risk 6/10 · Moderate
- Chance of severe wind over 30 yrs
- 27.0%
Air-quality risk 2/10 · Minimal
- Unhealthy air days now
- 0 days/yr
- Unhealthy air days in 30 yrs
- 1 days/yr
Risk factors via First Street. Map © Google.
Why this score? — see what drove the D grade
The composite is a weighted blend of 9 inputs, each scored 0–100. Each bar is that input's sub-score; the figure is the points it added to the 100-point composite (weight × sub-score).
- Cash flow +11.9/30.0
- ARV discount +7.5/15.0
- Appreciation +6.2/10.0
- DSCR +3.5/10.0
- Livability +3.2/5.0
- Rent growth +2.5/5.0
- Condition / age +2.5/5.0
- Schools +2.3/10.0
- 1% rule +2.2/10.0
$145,000
🖨 Deal sheet (PDF) 📄 Offer letter ✓ Due diligence
Listing remarks
Looking for acreage without breaking the bank? This 3-bedroom, 2-bath home situated on approximately 6 beautiful acres in the desirable Mt. Moriah Community offers a rare opportunity to enjoy country living at an affordable price point. Built in 1945, this traditional home features 1,430 square feet and is full of potential for the buyer ready to make it their own. Whether you're looking for a starter home, investment property, or a quiet place to put down roots, the possibilities here are plentiful. Enjoy the peace and privacy of rural living while still being just minutes from Bruce and everyday conveniences. With land, location, and value all wrapped into one package, this property is a
Key facts
- 6 acre lot
- Built 1945
- Listed 13 days
Neighborhood map
What this means for you Summary
Snapshot
- This is a 2-bed/2.0-bath single-family listed at $145k.
Deal economics
- At list price, monthly cash flow is $-37 ($-448/yr) — negative.
- To cash-flow at today's rent, offer at most $138k (4.6% below list).
- To meet the 1% rule (rent ≥ 1% of price), the offer needs to be $105k (27.7% below list).
- Recommended offer: $105k (27.7% below list) — sets the bar for 1% rule.
Location & tenants
- Location reads 63/100 on livability (#147 in MS) — a middle-class / working-renter tenant base. Strengths: cost of living A+, housing A+; Watch: health & safety D+, amenities F, commute F.
- Calhoun County School District (rural): math 28% / reading 29% proficiency, ranked #75 of 130 in MS (top 58%) — low school quality limits family demand, transient renter base, plan for 1-2y turnover; 69% free/reduced lunch — lower-income household profile, screen leases tightly.
- Zoned schools: Bruce Elementary School (math 8% / reading 27%, grade F, #257 of 375 statewide, top 69%, 316 students, 99% FRL); Bruce High School (math 37% / reading 32%, grade F, #68 of 197 statewide, top 39%, 459 students, 99% FRL) — zoned schools average 99% FRL vs 69% district-wide (30 pts higher); higher-poverty schools than district average — tighter screening recommended.
- Market conditions: 25 active listings in the ZIP; 10 units permitted in Calhoun County in 2024 (0 in 5+ unit buildings).
Forward outlook
- In year one you build about $4k of equity ($1k loan paydown + $3k appreciation (2.4% local appreciation)).
- Calhoun County population projected at -19% by 2050 — secular population decline; favor cash flow + early exit over multi-decade hold.
- At projected returns (2.4% appreciation + 3.0% rent growth), your $41k cash investment doubles in ~8 years — after that, you're playing with house money.
- By year 8, paydown + projected appreciation supports a ~$33k cash-out refi (75% LTV) — recoverable capital for the next deal without selling this one.
Negotiation context
- Only 13 days on market — expect competitive offers; lowballing is unlikely to land.
Risks & watch-outs
- Watch-outs: built in 1945 — expect roof / HVAC / electrical / plumbing capex.
- Climate carrying-cost: major wind risk, 27% chance of damaging wind over 30y; extreme-heat days projected 7→21/yr by 2055 (HVAC capex compounding) — expect insurance premiums to compound above CPI over the hold.
Questions for the listing agent
- What do current leases actually rent for vs. the listed asking? Can we see a recent rent roll and the last 12 months of T-12 income?
- Built in 1945 — when were the roof, HVAC, electrical panel, plumbing, and water heater last replaced?
- Is there a deadline driving the sale (1031 exchange, divorce, estate, relocation)? That informs how much negotiation room exists.
- Schools are D-rated, which usually means shorter tenancies and higher turnover. Who's the typical renter profile here, and what's been the actual vacancy rate?
- The area grade is low — what's the realistic commute time and amenity access for the typical tenant pool here? Any planned neighborhood developments (good or bad) we should know about?
- What's the average days-on-market for RENTAL listings here right now (not sales)? A rising rental-DOM trend means longer vacancies and softer asking-rent achievability than the comps imply.
- What's the recent tenant-quality profile in this submarket — average credit score on applications, eviction rate, late-payment / NSF rate, and stable-employment percentage? A property-management company in the area should have these aggregated.
- How much new for-sale + rental construction is in the pipeline within 1–3 miles? Heavy new supply typically softens prices + rents 12–24 months out; constrained supply supports both.
Investment metrics
- 1% rule
- 0.72% ✗
- Cap rate
- 5.98%
- Cash-on-cash
- -1.10%
- DSCR
- 0.95
- GRM
- 11.5
CMA / ARV
No comps found within radius.
Projected returns pro-forma
2.37% appreciation · 3.0% rent growth · sell at horizon
- IRR
- 4.6%
- Equity multiple
- 1.25×
- Total profit
- $10,280
- Equity at exit
- $60,156
- IRR
- 8.0%
- Equity multiple
- 2.13×
- Total profit
- $45,908
- Equity at exit
- $88,963
Cash invested: $40,600 (down + closing). Projections, not guarantees.
Landlord ↔ Tenant lean methodology
- Overall (STATE)
- 90 Strongly Landlord-Friendly
- State Mississippi
- 90 Strongly Landlord-Friendly · R+11
- County
- — inherits STATE
- City
- — inherits STATE
ZIP-level market 38915
- Home prices YoY
- 1.7%
- Active inventory
- 25
- Price-to-rent
- 11.5×
Monthly cashflow live
- Estimated rent
- $1,048 medium interval (Pro) →
- Mortgage (P&I)
- −$760
- Tax from tax record
- −$44 /mo · $533/yr
- Insurance
- −$60
- HOA
- −$0
- Vacancy / Maint / Mgmt
- −$220
- Net cashflow
- $-37
Break-even live
Sensitivity live
| Price | -10% $45 | -5% $4 | +0% $-37 | +5% $-78 | +10% $-119 |
|---|---|---|---|---|---|
| Rent | -10% $-120 | -5% $-79 | +0% $-37 | +5% $4 | +10% $45 |
| Rate | -1.0pp $36 | -0.5pp $0 | base $-37 | +0.5pp $-75 | +1.0pp $-113 |
UW: 25.0% down · 7.5% · 30yr · 1.5% tax · 5.0% vac · 8.0% maint · 8.0% mgmt
Financing live
Cash to close
- Down payment
- $36,250
- Closing costs
- $4,350
- Reserves months
- —
- Total cash needed
- —
Loan-product check · same deal, 3 products live
Conventional
25% down · 7.5% · 30yr
- Down + closing
- —
- Monthly P&I
- —
- Monthly cashflow
- —
- DSCR
- —
- Eligible?
- —
Personal DTI + credit; lowest rate.
DSCR
20% down · 8.5% · 30yr
- Down + closing
- —
- Monthly P&I
- —
- Monthly cashflow
- —
- DSCR
- —
- Eligible?
- —
No personal income docs; deal must DSCR.
Hard money
10% down · 12.0% · 12mo
- Down + closing
- —
- Monthly P&I
- —
- Monthly cashflow
- —
- DSCR
- —
- Eligible?
- —
Short-term bridge; refi at stabilization.
Listing history 2 events
-
2026-04-26status Pending
-
2026-04-13$145,000 Active
ⓘ Source: listings_history table (triggers on properties + properties_extension) + one-shot
backfill from property_details.listing_events for pre-trigger history.
Tax reassessment forecast MS · Resets to sale price
- Current annual tax
- $533 · $44/mo
- Projected year-2 tax
- $1,146 · $95/mo
- Expected delta
- +$613/yr (+$51/mo · 115.1%)
ⓘ Screening estimate from a state-policy table — verify with the county assessor before closing.
Climate risk First Street
- Flood 1/10 Low FEMA zone X (unshaded) · 0% chance over 30 yrs
- Wildfire 4/10 Moderate
- Heat 6/10 Major 7 d/yr ≥109°F today · 21 d/yr by 30 yrs out
- Wind 6/10 Major 27% chance of damaging wind over 30 yrs
- Air quality 2/10 Low 0 unhealthy d/yr today · 1 by 30 yrs out
Nearby sold comps map
Loading sold comps map…
Walkable amenities ~0.75 mi
Loading nearby amenities…
Taxation est. · year 1
- Rental income
- $12,575
- − Mortgage interest
- −$8,122
- − Property taxes
- −$533
- − Insurance
- −$725
- − Repairs & maintenance
- −$1,006
- − Management
- −$1,006
- − Depreciation
- −$4,218
- Taxable loss
- −$3,035
- Est. tax savings @ 24.0%
- +$728
- After-tax cash flow
- $280/yr
For passive investors: Depreciation is non-cash, so a rental often shows a tax loss while cash-flowing — sheltering income. Rental losses are passive: they offset passive income freely, and up to $25,000/yr can offset ordinary (W-2) income if you actively participate and your MAGI is under $100k (phasing out to $0 by $150k); unused losses carry forward. On sale, claimed depreciation is recaptured at up to 25%, and gains may owe capital-gains tax (a 1031 exchange can defer both). Figures are a year-1 estimate at your 24.0% rate — not tax advice; consult a CPA.
Schools (NCES district)
- District
- Calhoun County School District
- NCES district ID
- 2800870
- Math proficiency
- 28% ▼ -12.00%
- Reading proficiency
- 29% ▼ -9.00%
- Median HH income
- $30,951
- Composite
- 23.14/100
- National rank
- #7952
- State rank
- #75 of 130 in MS
Livability — Bruce
- Score
- 63/100
- State rank
- #147
- US rank
- #15075
Category grades
Schools grade is shown separately in the Schools card above.
Census & demographics
- Population (ZIP)
- 3,186
Population outlook (Calhoun County) Hauer SSP2
- Today (2025)
- 14,108 people
- By 2030
- 13,650 · -3.2%
- By 2040
- 12,586 · -10.8%
- By 2050
- 11,417 · -19.1%
- By 2075
- 8,381 · -40.6%
- By 2100
- 5,478 · -61.2%
Race, ethnicity, and origin ACS 2023
- Neighborhood character
- Predominantly White (68%)
- Race & ethnicity
- White 68% Black 29% Two or more races 3%
- Common ancestry
- Italian 1%
Political lean MEDSL · Calhoun
- 2024 margin
- Solid R (+48.0) · D 25.6% · R 73.6%
- 2008→2024 swing
- -20.3pp toward R · 2008: -27.7pp · 2024: -48.0pp
- All cycles
- 2024: R+48.0 2020: R+41.3 2016: R+39.1 2012: R+27.3 2008: R+27.7
Not yet ingested
- Civics
- —
Market trends
- HPI YoY
- ▲ 2.37%
- Current HPI
- 143.4197
- Rent YoY
- —
- Metro
- —
- State GDP YoY
- —
- F500 in state
- 0
Price history
2 events — show timeline
- 2026-04-26 Pending — NCMBR
- 2026-04-13 Listed $145,000 NCMBR
Property tax history
+4.9%/yrLatest (2025): $533 · +3.5% YoY. Source: county tax records.
Cash-flow waterfall
monthlySold comps — $/sqft
last 12 mo · ≤1 miLoading sold comps…