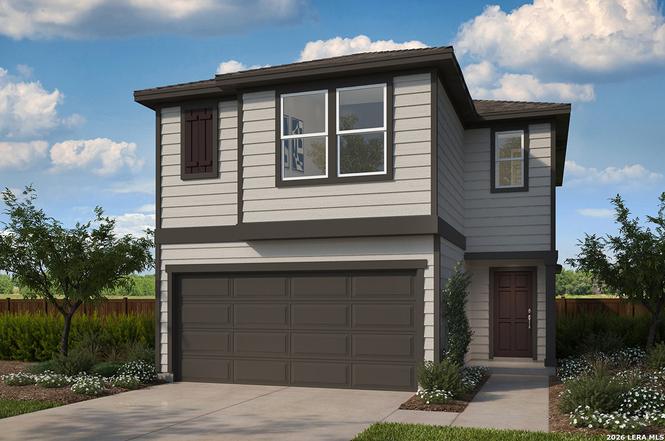
7570 Fishbowl Ln · San Antonio, TX
Flood risk 1/10 · Minimal
- FEMA flood zone
- X (unshaded)
- Chance of flooding over 30 yrs
- 0.0%
- Est. flood insurance / yr
- $507 – $1,088
Fire risk 3/10 · Minor
- Est. fire insurance / yr
- $1,222 – $2,270
Heat risk 8/10 · Major
- Hot days now (above 107°F)
- 7 days/yr
- Hot days in 30 yrs
- 21 days/yr
Wind risk 8/10 · Major
- Chance of severe wind over 30 yrs
- 80.0%
Air-quality risk 2/10 · Minimal
- Unhealthy air days now
- 0 days/yr
- Unhealthy air days in 30 yrs
- 1 days/yr
Risk factors via First Street. Map © Google.
Why this score? — see what drove the D+ grade
The composite is a weighted blend of 9 inputs, each scored 0–100. Each bar is that input's sub-score; the figure is the points it added to the 100-point composite (weight × sub-score).
- ARV discount +15.0/15.0
- Cash flow +11.6/30.0
- Condition / age +4.8/5.0
- Schools +4.4/10.0
- Livability +4.0/5.0
- 1% rule +3.6/10.0
- DSCR +3.4/10.0
- Rent growth +2.2/5.0
- Appreciation +0.0/10.0
$214,625
🖨 Deal sheet (PDF) 📄 Offer letter ✓ Due diligence
Listing remarks
This charming home offers 9-ft. first-floor ceilings and stylish finishes throughout. The modern kitchen features Whirlpool stainless steel appliances, Woodmont Cody 42-in. upper cabinets, an extended breakfast bar, and a sleek Daltile tile backsplash. Relax in the primary bath with an extended cabinet featuring knee space and a 42-in. garden tub/shower with Daltile tile surround. Decorative touches include a Carrara-style entry door, Kwikset Polo knob interior door hardware, durable vinyl plank flooring in the kitchen, laundry, and bathrooms, plus Shaw carpet in the bedrooms, living room, and loft. Additional highlights include a wireless security system, automatic sprinkler system, and fu
Key facts
- Extended cabinet
- Garden tub shower
- 2 garage spots
Tags
Property features AI
Finance
- HOA & community: Mandatory HOA; HOA fee $400 annually; Association transfer fee $200
Exterior
- Parking: 2-car garage (detached/attached not specified)
- Utilities: Water system; Sewer system; Electric service
- Home design: New construction by KB Home
- Construction: Slab foundation; Composition roof; Built by KB Home (new)
- Exterior features: Cement fiber exterior; Subdivision: Preserve at Culebra; Community pool; Park/playground
Interior
- Kitchen: Kitchen approximately 8 x 9
- Bedrooms: Master bedroom (upper level); Second bedroom; Third bedroom; Master bedroom approximately 13 x 13; Bedroom 2 approximately 10 x 10; Bedroom 3 approximately 10 x 10
- Flooring: Carpeting; Other flooring (see remarks)
- Bathrooms: Two full baths and one half bath; Master bath with tub/shower combination (approximately 8 x 6)
- Heating & cooling: Central heating (electric); Central air conditioning (1 unit)
- Interior features: Washer and dryer connections; Energy Star certified
- Laundry & utility: Washer and dryer connections
Neighborhood map
What this means for you Summary
Snapshot
- This is a 3-bed/2.5-bath single-family listed at $215k. Condition is rated excellent.
Deal economics
- At list price, monthly cash flow is $-66 ($-790/yr) — negative.
- To cash-flow at today's rent, offer at most $205k (4.4% below list).
- To meet the 1% rule (rent ≥ 1% of price), the offer needs to be $184k (14.5% below list).
- Recommended offer: $184k (14.5% below list) — sets the bar for 1% rule.
- Cap rate 5.9% vs local median 3.8% in San Antonio — top-decile yield for the area; either an underpriced asset or a hidden risk that comps aren't pricing in. Stress-test before assuming the spread holds.
Location & tenants
- Location reads 80/100 on livability (#31 in TX, #1,616 nationally) — a professional / high-income tenant draw. Strengths: amenities A+, commute A+, cost of living A+; Watch: crime F.
- Medina Valley ISD (rural): math 48% / reading 53% proficiency, ranked #148 of 826 in TX (top 18%) — acceptable for families but not a draw, mixed tenant base, ~2y average lease.
- Zoned schools: Potranco El (math 50% / reading 51%, grade D+, #833 of 4,322 statewide, top 20%, 847 students, 47% FRL); Medina Valley Middle (math 47% / reading 49%, grade C-, #400 of 1,662 statewide, top 24%, 1,029 students, 62% FRL); Medina Valley H S (math 34% / reading 55%, grade F, #652 of 1,632 statewide, top 43%, 2,147 students, 51% FRL) — zoned schools at 53% FRL track the district average.
- Market conditions: Rents soft (-1.1%/yr); 728 active listings in the ZIP; 38 comparable units currently listed for rent nearby; rentals at typical pace (median 26d on market — plan ~3-4 weeks tenant-placement turnaround); solid renter incomes; 8,308 units permitted in Bexar County in 2024 (2,506 in 5+ unit buildings).
Forward outlook
- Local home prices are declining (-3.0%/yr); year-one equity from $1k of loan paydown is wiped out by about $6k of value loss. Plan a longer hold.
- Bexar County population projected at +50% by 2050 — long-run rental-demand tailwind backs the buy-and-hold thesis.
Negotiation context
- It's been on market 24 days — a 2% lower offer ($211k) is reasonable based on typical stale-listing flexibility.
Risks & watch-outs
- Climate carrying-cost: severe wind risk, 80% chance of damaging wind over 30y; extreme-heat days projected 7→21/yr by 2055 (HVAC capex compounding) — expect insurance premiums to compound above CPI over the hold.
Questions for the listing agent
- What do current leases actually rent for vs. the listed asking? Can we see a recent rent roll and the last 12 months of T-12 income?
- What does the HOA fee cover, when was the last increase, and are there any pending special assessments or reserve-fund shortfalls?
- Is there a deadline driving the sale (1031 exchange, divorce, estate, relocation)? That informs how much negotiation room exists.
- Crime grade is F in this area — have there been break-ins, vandalism, or insurance claims at this property in the last 3 years? What carrier currently insures it and at what premium?
- The area grade is low — what's the realistic commute time and amenity access for the typical tenant pool here? Any planned neighborhood developments (good or bad) we should know about?
- What's the average days-on-market for RENTAL listings here right now (not sales)? A rising rental-DOM trend means longer vacancies and softer asking-rent achievability than the comps imply.
- What's the recent tenant-quality profile in this submarket — average credit score on applications, eviction rate, late-payment / NSF rate, and stable-employment percentage? A property-management company in the area should have these aggregated.
- How much new for-sale + rental construction is in the pipeline within 1–3 miles? Heavy new supply typically softens prices + rents 12–24 months out; constrained supply supports both.
Investment metrics
- 1% rule
- 0.86% ✗
- Cap rate
- 5.92%
- Cash-on-cash
- -1.31%
- DSCR
- 0.94
- GRM
- 9.7
CMA / ARV
- ARV (on-the-fly)
- $288,272
- Comps found
- 12
Show comp detail 12 sales within ~0.75 mi
| Address | Dist | Beds/Ba | Sqft | Sold | Price | $/sf | Match |
|---|---|---|---|---|---|---|---|
| 14718 Grey Egret | 0.23mi | 3/2.0 | 1,678 (+0%) | 1mo | $270,000 | $161 | 86 |
| 15620 Bonito Loop | 0.20mi | 3/2.0 | 1,605 (-4%) | 2mo | $262,225 | $163 | 80 |
| 14803 Sweet Clover | 0.38mi | 3/2.0 | 1,694 (+1%) | 5mo | $324,990 | $192 | 74 |
| 7513 Corral Smt | 0.17mi | 3/2.5 | 1,826 (+9%) | 3mo | $279,990 | $153 | 74 |
| 7806 Rock Wren Fall | 0.21mi | 3/2.0 | 1,548 (-8%) | 2mo | $269,131 | $174 | 74 |
| 8026 Kingfisher Lndg | 0.33mi | 3/2.0 | 1,548 (-8%) | 4mo | $290,466 | $188 | 66 |
| 14744 Sweet Clover | 0.44mi | 3/2.5 | 1,800 (+7%) | 4mo | $309,990 | $172 | 64 |
| 7506 Guadalupe Peak | 0.39mi | 3/2.5 | 1,848 (+10%) | 2mo | $245,000 | $133 | 63 |
| 14735 Sweet Clover | 0.43mi | 3/2.0 | 1,549 (-8%) | 5mo | $293,999 | $190 | 61 |
| 14748 Sweet Clover | 0.43mi | 4/2.0 (+1) | 1,549 (-8%) | 2mo | $294,999 | $190 | 58 |
| 14318 Elkhorn Crst | 0.73mi | 3/2.5 | 1,604 (-4%) | 1mo | $231,840 | $145 | 58 |
| 7918 Hanging Br | 0.65mi | 3/2.0 | 1,560 (-7%) | 4mo | $229,900 | $147 | 52 |
Match score weights: distance 35% · size 25% · config 20% · recency 20%. Top-matched comps best support the ARV.
Projected returns pro-forma
-3.0% appreciation · 0.0% rent growth · sell at horizon
- IRR
- -21.9%
- Equity multiple
- 0.26×
- Total profit
- $-44,302
- Equity at exit
- $32,001
- IRR
- -25.8%
- Equity multiple
- -0.07×
- Total profit
- $-64,573
- Equity at exit
- $18,557
Cash invested: $60,095 (down + closing). Projections, not guarantees.
Landlord ↔ Tenant lean methodology
- Overall (STATE)
- 87 Strongly Landlord-Friendly
- State Texas
- 87 Strongly Landlord-Friendly · R+5
- County
- — inherits STATE
- City
- — inherits STATE
ZIP-level market 78253
- Home prices YoY
- -33.4%
- Rents YoY
- -1.1%
- Active inventory
- 728
- Price-to-rent
- 9.7×
Monthly cashflow live
- Estimated rent
- $1,836 high interval (Pro) →
- Mortgage (P&I)
- −$1,126
- Tax est. 1.5%
- −$268 /mo · $3,219/yr
- Insurance
- −$89
- HOA
- −$33
- Vacancy / Maint / Mgmt
- −$386
- Net cashflow
- $-66
Break-even live
Sensitivity live
| Price | -10% $83 | -5% $8 | +0% $-66 | +5% $-140 | +10% $-214 |
|---|---|---|---|---|---|
| Rent | -10% $-211 | -5% $-138 | +0% $-66 | +5% $7 | +10% $79 |
| Rate | -1.0pp $42 | -0.5pp $-11 | base $-66 | +0.5pp $-121 | +1.0pp $-178 |
UW: 25.0% down · 7.5% · 30yr · 1.5% tax · 5.0% vac · 8.0% maint · 8.0% mgmt
Financing live
Cash to close
- Down payment
- $53,656
- Closing costs
- $6,439
- Reserves months
- —
- Total cash needed
- —
Loan-product check · same deal, 3 products live
Conventional
25% down · 7.5% · 30yr
- Down + closing
- —
- Monthly P&I
- —
- Monthly cashflow
- —
- DSCR
- —
- Eligible?
- —
Personal DTI + credit; lowest rate.
DSCR
20% down · 8.5% · 30yr
- Down + closing
- —
- Monthly P&I
- —
- Monthly cashflow
- —
- DSCR
- —
- Eligible?
- —
No personal income docs; deal must DSCR.
Hard money
10% down · 12.0% · 12mo
- Down + closing
- —
- Monthly P&I
- —
- Monthly cashflow
- —
- DSCR
- —
- Eligible?
- —
Short-term bridge; refi at stabilization.
Rent comps 38 comps
| Address | Beds | Baths | Sqft | Rent | $/sqft | DOM | Units | Dist |
|---|---|---|---|---|---|---|---|---|
| 7530 Fishbowl Ln San Antonio, TX | 4.0 | 2.5 | 1650 | $1,950 | $1.18 | 25d | 1 | 0.06mi |
| 7510 Fishbowl Ln San Antonio, TX | 4.0 | 2.5 | 1650 | $1,950 | $1.18 | 25d | 1 | 0.09mi |
| 15620 Bonito Loop San Antonio, TX | 3.0 | 2.0 | 1605 | $1,685 | $1.05 | 6d | 1 | 0.18mi |
| 7525 Corral Smt San Antonio, TX | 3.0 | 2.0 | 1412 | $1,780 | $1.26 | 0d | 1 | 0.18mi |
| 7439 Corral Smt San Antonio, TX | 3.0 | 2.0 | 1662 | $1,745 | $1.05 | 45d | 1 | 0.20mi |
| 7806 Rock Wren Fall San Antonio, TX | 3.0 | 2.0 | 1548 | $1,625 | $1.05 | 6d | 1 | 0.22mi |
| 15900 La Cantera Pkwy San Antonio, TX | 2.0 | 2.0 | 1177 | $1,542 | $1.31 | 45d | 1 | 0.23mi |
| 7518 Boa Holw San Antonio, TX | 3.0 | 2.0 | 1412 | $1,795 | $1.27 | 25d | 1 | 0.34mi |
| 7535 Guadalupe Peak San Antonio, TX | 3.0 | 2.5 | 1485 | $1,450 | $0.98 | 6d | 1 | 0.36mi |
| 7410 Boa Holw San Antonio, TX | 3.0 | 2.0 | 1536 | $1,789 | $1.16 | 16d | 1 | 0.39mi |
| 7435 Guadalupe Peak San Antonio, TX | 3.0 | 2.0 | 1402 | $1,769 | $1.26 | 45d | 1 | 0.39mi |
| 14511 Gecko Lndg San Antonio, TX | 3.0 | 2.0 | 1601 | $1,995 | $1.25 | 4d | 1 | 0.46mi |
| 14511 Gecko Lndg San Antonio, TX | 3.0 | 2.0 | 1601 | $1,895 | $1.18 | 14d | 1 | 0.46mi |
| 14755 Maple Ter San Antonio, TX | 3.0 | 2.5 | 1484 | $1,750 | $1.18 | 18d | 1 | 0.49mi |
| 14523 Bonito Loop San Antonio, TX | 3.0 | 2.0 | 1604 | $1,700 | $1.06 | 19d | 1 | 0.54mi |
| 14477 Gunsight Pass San Antonio, TX | 3.0 | 2.5 | 1851 | $1,895 | $1.02 | 0d | 1 | 0.55mi |
| 15321 Sherwin Oak San Antonio, TX | 3.0 | 2.5 | 1773 | $1,700 | $0.96 | 45d | 1 | 0.61mi |
| 14685 Maple Ter San Antonio, TX | 3.0 | 2.5 | 1605 | $1,799 | $1.12 | 45d | 1 | 0.61mi |
| 14374 Palm Rdg San Antonio, TX | 3.0 | 2.0 | 1405 | $1,750 | $1.25 | 25d | 1 | 0.62mi |
| 7915 Bonsai Bay San Antonio, TX | 3.0 | 2.5 | 2088 | $1,795 | $0.86 | 45d | 1 | 0.65mi |
| 14644 Maple Ter San Antonio, TX | 3.0 | 2.5 | 1826 | $1,799 | $0.99 | 45d | 1 | 0.68mi |
| 14338 Palm Rdg San Antonio, TX | 3.0 | 2.5 | 1826 | $1,779 | $0.97 | 45d | 1 | 0.69mi |
| 15223 Liberty Sta San Antonio, TX | 3.0 | 2.0 | 1549 | $1,795 | $1.16 | 22d | 1 | 0.73mi |
| 15223 Liberty Sta San Antonio, TX | 3.0 | 2.0 | 1549 | $1,850 | $1.19 | 45d | 1 | 0.73mi |
| 14319 Palm Rdg San Antonio, TX | 3.0 | 2.0 | 1412 | $1,769 | $1.25 | 16d | 1 | 0.73mi |
| 14371 Gunsight Pass San Antonio, TX | 3.0 | 2.0 | 1662 | $1,769 | $1.06 | 45d | 1 | 0.73mi |
| 14367 Gunsight Pass San Antonio, TX | 3.0 | 2.0 | 1402 | $1,689 | $1.20 | 25d | 1 | 0.74mi |
| 14303 Palm Rdg Unit 3294 San Antonio, TX | 3.0 | 2.0 | 1412 | $1,703 | $1.21 | 0d | 1 | 0.76mi |
| 14347 Gunsight Pass San Antonio, TX | 3.0 | 2.5 | 1826 | $1,789 | $0.98 | 45d | 1 | 0.78mi |
| 14311 Gila Xing San Antonio, TX | 4.0 | 3.0 | 1912 | $1,850 | $0.97 | 25d | 1 | 0.78mi |
| 7438 Asp Pt San Antonio, TX | 3.0 | 2.0 | 1412 | $1,749 | $1.24 | 16d | 1 | 0.78mi |
| 14339 Gunsight Pass San Antonio, TX | 4.0 | 3.0 | 1912 | $2,099 | $1.10 | 25d | 1 | 0.79mi |
| 7810 Asp Pt San Antonio, TX | 4.0 | 3.0 | 1912 | $1,875 | $0.98 | 0d | 1 | 0.83mi |
| 14303 Gunsight Pass San Antonio, TX | 3.0 | 2.0 | 1587 | $1,850 | $1.17 | 45d | 1 | 0.86mi |
| 14303 Gunsight Pass San Antonio, TX | 3.0 | 2.0 | 1587 | $1,750 | $1.10 | 25d | 1 | 0.86mi |
| 14034 Old Farm to Market 471 W San Antonio, TX | 1.0–3.0 | 1.0–2.0 | 965 | $2,006 | $2.08 | 0d | 9 | 1.23mi |
| 15035 Homing Mdw San Antonio, TX | 4.0 | 2.5 | 1745 | $1,850 | $1.06 | 25d | 1 | 1.31mi |
| 7003 Anacua Crk San Antonio, TX | 3.0–4.0 | 2.0–3.0 | 1902 | $1,698 | $0.89 | 5d | 8 | 1.41mi |
HOA detail
- Monthly dues
- $33 · $396/yr
- Likely covers
- poolsecurity
Listing history 15 events
-
2026-06-21statusdays on market $214,625 Pending 24 DOM
-
2026-06-18days on market $214,625 Active Option 23 DOM
-
2026-06-17days on market $214,625 Active Option 22 DOM
-
2026-06-16days on market $214,625 Active Option 21 DOM
-
2026-06-15days on market $214,625 Active Option 20 DOM
-
2026-06-13days on market $214,625 Active Option 18 DOM
-
2026-06-09days on market $214,625 Active Option 14 DOM
-
2026-06-08days on market $214,625 Active Option 13 DOM
-
2026-06-07statusdays on market $214,625 Active Option 12 DOM
-
2026-06-04days on market $214,625 New 9 DOM
-
2026-06-03days on market $214,625 New 8 DOM
-
2026-06-02days on market $214,625 New 7 DOM
-
2026-06-01days on market $214,625 New 6 DOM
-
2026-05-31days on market $214,625 New 5 DOM
-
2026-05-26$214,625 New
ⓘ Source: listings_history table (triggers on properties + properties_extension) + one-shot
backfill from property_details.listing_events for pre-trigger history.
Climate risk First Street
- Flood 1/10 Low FEMA zone X (unshaded) · 0% chance over 30 yrs
- Wildfire 3/10 Moderate
- Heat 8/10 Severe 7 d/yr ≥107°F today · 21 d/yr by 30 yrs out
- Wind 8/10 Severe 80% chance of damaging wind over 30 yrs
- Air quality 2/10 Low 0 unhealthy d/yr today · 1 by 30 yrs out
Nearby sold comps map
Loading sold comps map…
Walkable amenities ~0.75 mi
Loading nearby amenities…
Taxation est. · year 1
- Rental income
- $22,032
- − Mortgage interest
- −$12,022
- − Property taxes
- −$3,219
- − Insurance
- −$1,073
- − Repairs & maintenance
- −$1,763
- − Management
- −$1,763
- − HOA
- −$396
- − Depreciation
- −$6,244
- Taxable loss
- −$4,448
- Est. tax savings @ 24.0%
- +$1,067
- After-tax cash flow
- $278/yr
For passive investors: Depreciation is non-cash, so a rental often shows a tax loss while cash-flowing — sheltering income. Rental losses are passive: they offset passive income freely, and up to $25,000/yr can offset ordinary (W-2) income if you actively participate and your MAGI is under $100k (phasing out to $0 by $150k); unused losses carry forward. On sale, claimed depreciation is recaptured at up to 25%, and gains may owe capital-gains tax (a 1031 exchange can defer both). Figures are a year-1 estimate at your 24.0% rate — not tax advice; consult a CPA.
Condition & rehab AI · 6 photos
This charming home is in excellent condition with modern finishes and a well-maintained exterior. It offers a great value with potential for minor updates to enhance curb appeal and property value.
Value-add opportunities
- Both Landscaping improvements — Enhances curb appeal and property value
- Both Painting exterior and interior — Maintains and enhances property value
- Resale Upgrade kitchen appliances — Modernizes kitchen and appeals to buyers
- Both Install smart home security system — Enhances safety and adds value
Renovation cost estimate screening
Value-add ROI direction
- Both Landscaping improvements — Enhances curb appeal and property value ↑
- Both Painting exterior and interior — Maintains and enhances property value ↑
- Resale Upgrade kitchen appliances — Modernizes kitchen and appeals to buyers ↑
- Both Install smart home security system — Enhances safety and adds value ↑
ⓘ Cost ranges are severity-bucket heuristics (US national rule-of-thumb). Get contractor quotes + a written scope before underwriting a rehab budget.
Schools (NCES district)
- District
- Medina Valley ISD
- NCES district ID
- 4830060
- Math proficiency
- 48% ▼ -9.00%
- Reading proficiency
- 53% ▼ -2.00%
- Median HH income
- $60,596
- Composite
- 44.2/100
- National rank
- #2851
- State rank
- #148 of 826 in TX
Livability — San Antonio
- Score
- 80/100
- State rank
- #31
- US rank
- #1616
Category grades
Schools grade is shown separately in the Schools card above.
Census & demographics
- County
- Bexar County · 1,990,555 people
- City population
- 1,806,925
- Metro
- San Antonio-New Braunfels, TX
- Population (ZIP)
- 69,282
- Household income
- $106,373
- Rent vs Own
- Severe rent burden
- 1496.0
Population outlook (Bexar County) Hauer SSP2
- Today (2025)
- 2,336,851 people
- By 2030
- 2,560,728 · +9.6%
- By 2040
- 3,020,569 · +29.3%
- By 2050
- 3,493,522 · +49.5%
- By 2075
- 4,668,459 · +99.8%
- By 2100
- 5,533,242 · +136.8%
Race, ethnicity, and origin ACS 2023
- Neighborhood character
- Diverse neighborhood (Simpson 0.65)
- Race & ethnicity
- Hispanic / Latino 47% White 34% Two or more races 27% Black 9% Asian 4% Native American 2%
- Hispanic origin (detail)
- Mexican 38% Puerto Rican 3%
- Common ancestry
- Italian 2% Lithuanian 1% Romanian 1%
- Foreign-born
- 9% · Canada
- Languages at home
- 73% English-only · Spanish 22% Other Asian/Pacific 1% Tagalog/Filipino 1%
Political lean MEDSL · Bexar
- 2024 margin
- Lean D (+9.8) · D 54.3% · R 44.6% · Other 1.1%
- 2008→2024 swing
- +4.2pp toward D · 2008: 5.6pp · 2024: 9.8pp
- All cycles
- 2024: D+9.8 2020: D+18.2 2016: D+13.5 2012: D+4.6 2008: D+5.6
Not yet ingested
- Civics
- —
Market trends
- HPI YoY
- ▼ -99.92%
- Current HPI
- 199.1827
- Rent YoY
- ▼ -1.10%
- Metro
- San Antonio-New Braunfels, TX
- State GDP YoY
- ▲ 3.95%
- F500 in state
- 110
Industry mix (Fortune 500 HQ in TX)
| Industry | F500 HQs | Revenue |
|---|---|---|
| Energy | 16 | $1,198B |
|
||
| Technology | 5 | $198B |
|
||
| Engineering / Construction | 4 | $72B |
|
||
| Energy Services | 3 | $60B |
|
||
| Utilities | 3 | $41B |
|
||
| Healthcare | 2 | $330B |
|
||
Price history
1 event — show timeline
- 2026-05-26 Listed $214,625 LERA
Cash-flow waterfall
monthlySold comps — $/sqft
last 12 mo · ≤1 miLoading sold comps…