517 Begonia Ln · Altoona, WI
Flood risk 1/10 · Minimal
- FEMA flood zone
- X
- Chance of flooding over 30 yrs
- 0.0%
- Est. flood insurance / yr
- $508 – $851
Fire risk 2/10 · Minimal
- Est. fire insurance / yr
- $636 – $1,182
Heat risk 2/10 · Minimal
- Hot days now (above threshold)
- 7 days/yr
- Hot days in 30 yrs
- 14 days/yr
Wind risk No data
- Chance of severe wind over 30 yrs
- —
Air-quality risk 2/10 · Minimal
- Unhealthy air days now
- 1 days/yr
- Unhealthy air days in 30 yrs
- 1 days/yr
Risk factors via First Street. Map © Google.
Why this score? — see what drove the B grade
The composite is a weighted blend of 9 inputs, each scored 0–100. Each bar is that input's sub-score; the figure is the points it added to the 100-point composite (weight × sub-score).
- Cash flow +30.0/30.0
- 1% rule +10.0/10.0
- DSCR +10.0/10.0
- ARV discount +7.5/15.0
- Schools +4.0/10.0
- Livability +3.8/5.0
- Rent growth +2.5/5.0
- Condition / age +2.2/5.0
- Appreciation +0.0/10.0
$90,000
🖨 Deal sheet 📄 Offer letter ✓ Due diligence
Listing remarks MLS
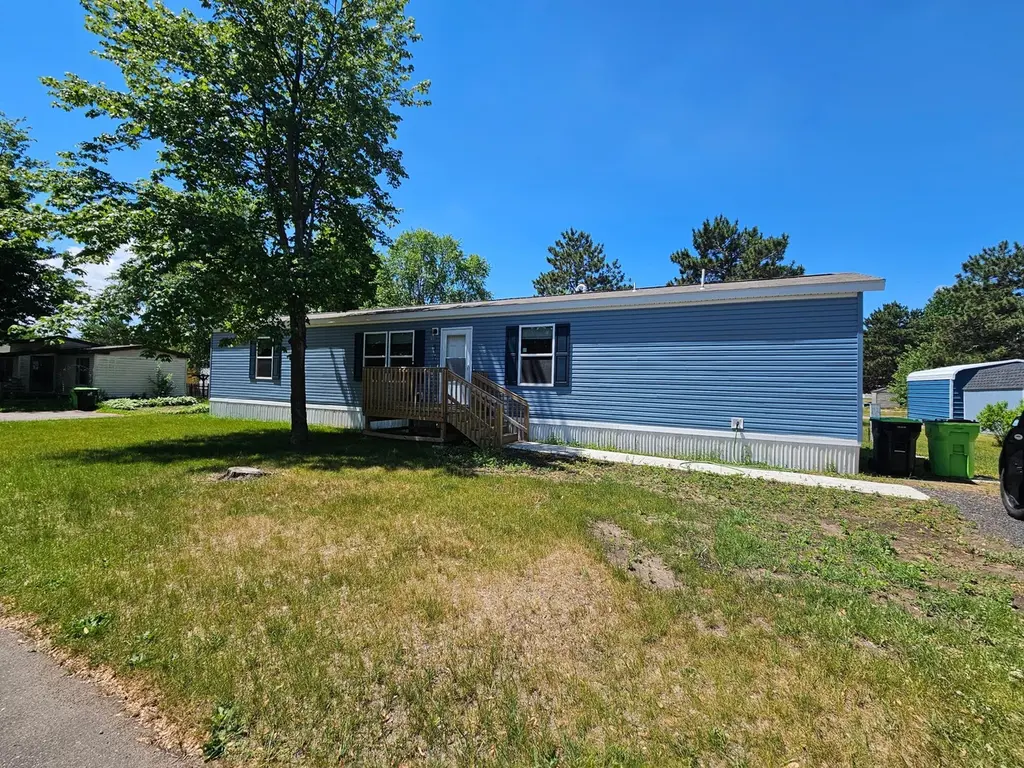
Move-in ready 2024 manufactured home in the desirable Hillcrest Estates community. This spacious 3-bed, 2-bath features luxury vinyl plank & carpet flooring, modern heating and AC systems, and an open layout designed for comfort. Ideal blend of style, functionality and value?schedule your showing today! - no sign in front yard.
Key facts
- Dog park
- Walk around pond
- Playground
Tags
Property features AI
Finance
- Financial info: Land lease payment: $460
- HOA & community: Land is leased
Exterior
- Parking: Gravel parking
- Utilities: City water (connected); City sewer (connected); Natural gas
- Home design: Residential property; Manufactured home; One level; Pillar/post/pier foundation
- Construction: 884 above-ground living area; 884 building area total
- Exterior features: Vinyl exterior; Light tree coverage
Interior
- Kitchen: Kitchen on the main level approx. 7 x 9
- Bedrooms: 3 bedrooms on the main level; Primary bedroom approx. 13 x 9 (main); Second bedroom approx. 10 x 7 (main); Third bedroom approx. 10 x 7 (main)
- Bathrooms: 2 full bathrooms
- Heating & cooling: Forced air heating; Central air conditioning
- Interior features: All living facilities on one level; No basement
Neighborhood map
What this means for you Summary
Snapshot
- This is a 3-bed/2.0-bath single-family listed at $90k. Condition is rated fair.
Deal economics
- At list price, monthly cash flow is $600 ($7k/yr) — positive.
- The deal already cash-flows at list — no discount required.
- Meets the 1% rule at list price ($2k rent vs $90k).
- Cap rate 14.3% vs local median 2.6% in Altoona — top-decile yield for the area; either an underpriced asset or a hidden risk that comps aren't pricing in. Stress-test before assuming the spread holds.
Location & tenants
- Location reads 75/100 on livability (#159 in WI, #4,266 nationally) — a middle-class / working-renter tenant base. Strengths: crime A+, cost of living A+, housing A+; Watch: health & safety D, amenities F, commute F.
- Altoona School District (suburban): math 48% / reading 46% proficiency, ranked #75 of 342 in WI (top 22%) — families likely to look elsewhere, expect single-tenant / working-renter base with shorter leases.
- Market conditions: 33 active listings in the ZIP; 6 comparable units currently listed for rent nearby; rentals at typical pace (median 21d on market — plan ~3-4 weeks tenant-placement turnaround); solid renter incomes; 583 units permitted in Eau Claire County in 2024 (325 in 5+ unit buildings).
Forward outlook
- Local home prices are declining (-3.0%/yr); year-one equity from $622 of loan paydown is wiped out by about $3k of value loss. Plan a longer hold.
- Eau Claire County population projected at +14% by 2050 — modest demand growth; plan on rents tracking national, not racing it.
- At projected returns (-3.0% appreciation + 3.0% rent growth), your $25k cash investment doubles in ~5 years — after that, you're playing with house money.
Negotiation context
- Only 11 days on market — expect competitive offers; lowballing is unlikely to land.
- 2 sale attempts with the ask held roughly flat each time — persistent listings suggest the price (not the market) is what's stuck; bring a comps-based counter.
Questions for the listing agent
- Have any recent inspections been done? Can we get a copy of the seller's disclosures and any deferred-maintenance estimates?
- Is there a deadline driving the sale (1031 exchange, divorce, estate, relocation)? That informs how much negotiation room exists.
- Schools are B-rated — typically a magnet for longer-tenancy family renters. What's the average tenant stay here, and is there a school-zone premium baked into asking?
- What's the average days-on-market for RENTAL listings here right now (not sales)? A rising rental-DOM trend means longer vacancies and softer asking-rent achievability than the comps imply.
- What's the recent tenant-quality profile in this submarket — average credit score on applications, eviction rate, late-payment / NSF rate, and stable-employment percentage? A property-management company in the area should have these aggregated.
- How much new for-sale + rental construction is in the pipeline within 1–3 miles? Heavy new supply typically softens prices + rents 12–24 months out; constrained supply supports both.
Investment metrics
- 1% rule
- 1.72% ✓
- Cap rate
- 14.29%
- Cash-on-cash
- 28.56%
- DSCR
- 2.27
- GRM
- 4.9
CMA / ARV
No comps found within radius.
Projected returns pro-forma
-3.0% appreciation · 3.0% rent growth · sell at horizon
- IRR
- 22.8%
- Equity multiple
- 1.94×
- Total profit
- $23,632
- Equity at exit
- $13,419
- IRR
- 30.8%
- Equity multiple
- 3.77×
- Total profit
- $69,853
- Equity at exit
- $7,782
Cash invested: $25,200 (down + closing). Projections, not guarantees.
Landlord ↔ Tenant lean methodology
- Overall (STATE)
- 73 Landlord-Friendly
- State Wisconsin
- 73 Landlord-Friendly · R+2
- County
- — inherits STATE
- City
- — inherits STATE
ZIP-level market 54720
- Active inventory
- 33
- Price-to-rent
- 4.9×
Monthly cashflow live
- Estimated rent
- $1,546 high interval (Pro) →
- Mortgage (P&I)
- −$472
- Tax est. 1.5%
- −$112 /mo · $1,350/yr
- Insurance
- −$38
- HOA
- −$0
- Vacancy / Maint / Mgmt
- −$325
- Net cashflow
- $600
Break-even live
UW: 25.0% down · 7.5% · 30yr · 1.5% tax · 5.0% vac · 8.0% maint · 8.0% mgmt
Financing live
Cash to close
- Down payment
- $22,500
- Closing costs
- $2,700
- Reserves months
- —
- Total cash needed
- —
Loan-product check · same deal, 3 products live
Conventional
25% down · 7.5% · 30yr
- Down + closing
- —
- Monthly P&I
- —
- Monthly cashflow
- —
- DSCR
- —
- Eligible?
- —
Personal DTI + credit; lowest rate.
DSCR
20% down · 8.5% · 30yr
- Down + closing
- —
- Monthly P&I
- —
- Monthly cashflow
- —
- DSCR
- —
- Eligible?
- —
No personal income docs; deal must DSCR.
Hard money
10% down · 12.0% · 12mo
- Down + closing
- —
- Monthly P&I
- —
- Monthly cashflow
- —
- DSCR
- —
- Eligible?
- —
Short-term bridge; refi at stabilization.
Rent comps 6 comps
| Address | Beds | Baths | Sqft | Rent | $/sqft | DOM | Units | Dist |
|---|---|---|---|---|---|---|---|---|
| 708 Yosemite WAY Altoona, WI | 1.0–3.0 | 1.0–2.0 | 1158 | $1,695 | $1.46 | 13d | 1 | 0.25mi |
| 1136 5th St E Apt 9 Altoona, WI | 2.0 | 1.0 | 800 | $875 | $1.09 | 43d | 1 | 0.67mi |
| 927 Briar Ln Unit 5 Altoona, WI | 2.0 | 1.0 | 900 | $950 | $1.06 | 21d | 1 | 0.70mi |
| 1885 Whistling Straits Dr Altoona, WI | 1.0–3.0 | 1.0–2.0 | 1110 | $1,800 | $1.62 | 13d | 9 | 1.28mi |
| 300 Yellowstone Trl Altoona, WI | 1.0–3.0 | 1.0–2.0 | 1158 | $1,695 | $1.46 | 43d | 4 | 1.38mi |
| 300 Yellowstone Trl Altoona, WI | 1.0–3.0 | 1.0–2.0 | 1158 | $1,695 | $1.46 | 13d | 12 | 1.38mi |
Listing history 10 events
-
2026-06-19days on market $90,000 Active 11 DOM
-
2026-06-18days on market $90,000 Active 10 DOM
-
2026-06-17days on market $90,000 Active 9 DOM
-
2026-06-16days on market $90,000 Active 8 DOM
-
2026-06-15days on market $90,000 Active 7 DOM
-
2026-06-14days on market $90,000 Active 5 DOM
-
2026-06-13days on market $90,000 Active 4 DOM
-
2026-06-10days on market $90,000 Active 2 DOM
-
2026-06-09remarks 345-char remark
-
2026-06-09$90,000 Active 1 DOM
ⓘ Source: listings_history table (triggers on properties + properties_extension) + one-shot
backfill from property_details.listing_events for pre-trigger history.
Climate risk First Street
- Flood 1/10 Low FEMA zone X · 0% chance over 30 yrs
- Wildfire 2/10 Low
- Heat 2/10 Low
- Air quality 2/10 Low 1 unhealthy d/yr today · 1 by 30 yrs out
Nearby sold comps map
Loading sold comps map…
Walkable amenities ~0.75 mi
Loading nearby amenities…
Taxation est. · year 1
- Rental income
- $18,556
- − Mortgage interest
- −$5,041
- − Property taxes
- −$1,350
- − Insurance
- −$450
- − Repairs & maintenance
- −$1,485
- − Management
- −$1,485
- − Depreciation
- −$2,618
- Taxable income
- $6,128
- Est. tax owed @ 24.0%
- −$1,471
- After-tax cash flow
- $5,725/yr
For passive investors: Depreciation is non-cash, so a rental often shows a tax loss while cash-flowing — sheltering income. Rental losses are passive: they offset passive income freely, and up to $25,000/yr can offset ordinary (W-2) income if you actively participate and your MAGI is under $100k (phasing out to $0 by $150k); unused losses carry forward. On sale, claimed depreciation is recaptured at up to 25%, and gains may owe capital-gains tax (a 1031 exchange can defer both). Figures are a year-1 estimate at your 24.0% rate — not tax advice; consult a CPA.
Condition & rehab AI · 5 photos
This mobile home in Hillcrest Estates requires moderate repairs and maintenance to improve its condition and value. Key areas for improvement include the deck, exterior siding, and interior walls. Upgrades to the home's appearance and functionality will significantly enhance its resale and rental value.
Repairs flagged
- Moderate Deck — Worn wooden deck with visible rot and splintering
- Minor Exterior siding — Some minor peeling and discoloration
Value-add opportunities
- Resale Paint interior walls — Fresh paint enhances curb appeal and interior aesthetics.
- Both Replace worn deck — A new deck improves safety and adds value for both resale and rental.
- Both Landscaping improvements — A well-maintained yard enhances curb appeal and property value.
- Resale Update bathrooms — Modern bathrooms with updated fixtures and finishes attract more buyers.
- Resale Replace worn exterior siding — Fresh siding improves the home's appearance and adds value for resale.
- Both Upgrade HVAC system — A new HVAC system improves comfort and energy efficiency, benefiting both resale and rental value.
- Resale Replace worn flooring — Fresh flooring enhances the home's appearance and adds value for resale.
- Resale Update kitchen cabinets — Fresh cabinets with updated hardware and finishes attract more buyers and add value.
- Resale Replace worn windows — New windows improve energy efficiency and add value for resale.
- Resale Replace worn interior walls — Fresh paint and updated finishes enhance the home's appearance and add value for resale.
Renovation cost estimate screening
| Repair item | Severity | Est. cost |
|---|---|---|
| Deck · Worn wooden deck with visible rot and splintering | Moderate | $3,000–15,000 |
| Exterior siding · Some minor peeling and discoloration | Minor | $500–3,000 |
| Total estimated repair cost · 2 items | $3,500–18,000 |
Value-add ROI direction
- Resale Paint interior walls — Fresh paint enhances curb appeal and interior aesthetics. ↑
- Both Replace worn deck — A new deck improves safety and adds value for both resale and rental. ↑
- Both Landscaping improvements — A well-maintained yard enhances curb appeal and property value. ↑
- Resale Update bathrooms — Modern bathrooms with updated fixtures and finishes attract more buyers. ↑
- Resale Replace worn exterior siding — Fresh siding improves the home's appearance and adds value for resale. ↑
- Both Upgrade HVAC system — A new HVAC system improves comfort and energy efficiency, benefiting both resale and rental value. ↑
- Resale Replace worn flooring — Fresh flooring enhances the home's appearance and adds value for resale. ↑
- Resale Update kitchen cabinets — Fresh cabinets with updated hardware and finishes attract more buyers and add value. ↑
- Resale Replace worn windows — New windows improve energy efficiency and add value for resale. ↑
- Resale Replace worn interior walls — Fresh paint and updated finishes enhance the home's appearance and add value for resale. ↑
ⓘ Cost ranges are severity-bucket heuristics (US national rule-of-thumb). Get contractor quotes + a written scope before underwriting a rehab budget.
Schools (NCES district)
- District
- Altoona School District
- NCES district ID
- 5500270
- Math proficiency
- 48% ▬ 0.00%
- Reading proficiency
- 46% ▼ -3.00%
- Median HH income
- $51,846
- Composite
- 40.49/100
- National rank
- #3715
- State rank
- #75 of 342 in WI
Livability — Altoona
- Score
- 75/100
- State rank
- #159
- US rank
- #4266
Category grades
Schools grade is shown separately in the Schools card above.
Census & demographics
- Census place
- Altoona, WI
- County
- Eau Claire County · 96,114 people
- City population
- 8,947
- Metro
- Eau Claire, WI
- Population (ZIP)
- 8,947
- Household income
- $85,977
- Rent vs Own
- Severe rent burden
- 375.0
Population outlook (Eau Claire County) Hauer SSP2
- Today (2025)
- 109,006 people
- By 2030
- 112,587 · +3.3%
- By 2040
- 118,674 · +8.9%
- By 2050
- 124,085 · +13.8%
- By 2075
- 135,804 · +24.6%
- By 2100
- 139,875 · +28.3%
Race, ethnicity, and origin ACS 2023
- Neighborhood character
- Predominantly White (88%)
- Race & ethnicity
- White 88% Two or more races 7% Hispanic / Latino 4% Black 1% Asian 1%
- Common ancestry
- Portuguese 14% Romanian 7% Lithuanian 4%
- Foreign-born
- 1%
- Languages at home
- 99% English-only · Spanish 1%
Political lean MEDSL · Eau Claire
- 2024 margin
- D (+10.6) · D 54.6% · R 44.0% · Other 1.4%
- 2008→2024 swing
- -11.6pp toward R · 2008: 22.1pp · 2024: 10.6pp
- All cycles
- 2024: D+10.6 2020: D+10.8 2016: D+7.3 2012: D+13.6 2008: D+22.1
Not yet ingested
- Civics
- —
Market trends
- HPI YoY
- ▼ -136.33%
- Current HPI
- 230.4933
- Rent YoY
- —
- Metro
- Eau Claire, WI
- State GDP YoY
- ▲ 2.10%
- F500 in state
- 20
Industry mix (Fortune 500 HQ in WI)
| Industry | F500 HQs | Revenue |
|---|---|---|
| Industrial Machinery | 4 | $23B |
|
||
| Industrial Technology | 2 | $36B |
|
||
| Insurance | 1 | $36B |
|
||
| Professional Services | 1 | $19B |
|
||
| Utilities | 1 | $9B |
|
||
| Consumer Goods | 1 | $3B |
|
||
Price history
-2.2% since first listed3 events — show timeline
- 2026-06-08 Listed $90,000 NORTHSTARMLS as Distributed by MLS Grid
- 2025-11-08 Listing Removed — RANWW
- 2025-11-07 Listed $92,000 RANWW
Cash-flow waterfall
monthlySold comps — $/sqft
last 12 mo · ≤1 miLoading sold comps…