6247 Acton Rd · Indianapolis city (balance), IN
Flood risk 1/10 · Minimal
- FEMA flood zone
- X (unshaded)
- Chance of flooding over 30 yrs
- 0.0%
- Est. flood insurance / yr
- $473 – $860
Fire risk 1/10 · Minimal
- Est. fire insurance / yr
- $717 – $1,331
Heat risk 3/10 · Minor
- Hot days now (above 101°F)
- 7 days/yr
- Hot days in 30 yrs
- 19 days/yr
Wind risk 2/10 · Minimal
- Chance of severe wind over 30 yrs
- 1.0%
Air-quality risk 2/10 · Minimal
- Unhealthy air days now
- 1 days/yr
- Unhealthy air days in 30 yrs
- 2 days/yr
Risk factors via First Street. Map © Google.
Why this score? — see what drove the D- grade
The composite is a weighted blend of 9 inputs, each scored 0–100. Each bar is that input's sub-score; the figure is the points it added to the 100-point composite (weight × sub-score).
- Cash flow +11.7/30.0
- ARV discount +7.4/15.0
- Schools +4.0/10.0
- DSCR +3.4/10.0
- 1% rule +2.9/10.0
- Rent growth +2.5/5.0
- Livability +2.5/5.0
- Condition / age +2.5/5.0
- Appreciation +0.0/10.0
$259,900
🖨 Deal sheet (PDF) 📄 Offer letter ✓ Due diligence
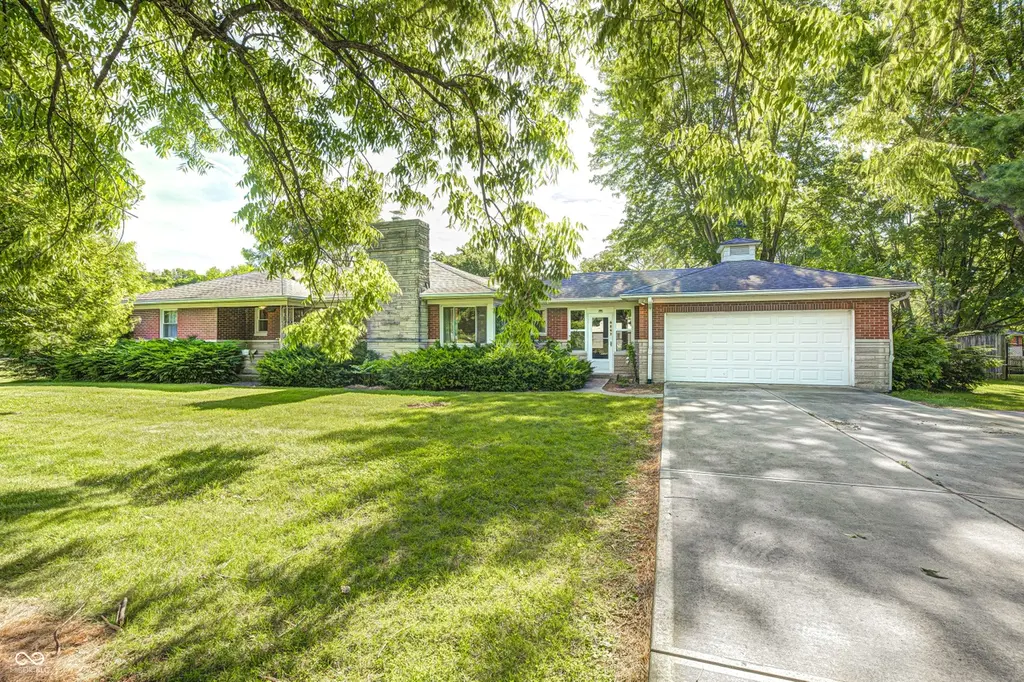
Listing remarks
Opportunity is knocking with this well loved 3 bedroom, 1.5 bath home offering 1,386 sqft on the main level, a 2-car garage, and plenty of upside. The large living room features a stone gas fireplace, built-in bookcase, and likely hardwood floors beneath the carpet, continuing into the dining room. Both bathrooms are original and full of retro character, offering a refreshing break from today's endless gray. Full unfinished basement is ready for your personal touches. The stone and brick exterior, large driveway with turnaround space, replacement windows, gutter guards, and mostly newer mechanicals show how well this home has been maintained. This is the classic Grandma's house opportunity.
Key facts
- Large driveway
- Stone gas fireplace
- Built-in bookcase
Tags
Property features AI
Exterior
- Parking: Attached 2-car garage with garage door opener
- Utilities: Private water; Septic system
- Home design: Single family residence; One level; Faces west
- Construction: Brick and stone exterior; Block foundation
- Exterior features: Covered patio; Patio; Mature trees; No fence
Interior
- Kitchen: Electric oven; Range hood; Refrigerator; Eat-in kitchen
- Bedrooms: 3 bedrooms on the main level; Primary bedroom with walk-in closet
- Flooring: Hardwood floors
- Bathrooms: 1 full bathroom; 1 half bathroom (main level)
- Heating & cooling: Forced air heating (natural gas); Central air conditioning
- Interior features: Attic access; Built-in features; Hardwood floors; Eat-in kitchen; Stained woodwork; Gas log fireplace; Daylight, full, unfinished basement; Smoke alarm; Sump pump
- Laundry & utility: Washer; Dryer
Neighborhood map
What this means for you Summary
Snapshot
- This is a 3-bed/1.5-bath single-family listed at $260k.
Deal economics
- At list price, monthly cash flow is $-75 ($-900/yr) — negative.
- To cash-flow at today's rent, offer at most $247k (5.1% below list).
- To meet the 1% rule (rent ≥ 1% of price), the offer needs to be $205k (21.0% below list).
- Recommended offer: $205k (21.0% below list) — sets the bar for 1% rule.
- Cap rate 5.9% vs local median 4.4% in Indianapolis city (balance) — top-decile yield for the area; either an underpriced asset or a hidden risk that comps aren't pricing in. Stress-test before assuming the spread holds.
Location & tenants
- Location reads: area grade D — affects rentability + tenant quality, not the cash-flow math above.
- Franklin Township Community School Corporation (urban): math 42% / reading 47% proficiency, ranked #87 of 301 in IN (top 29%) — families likely to look elsewhere, expect single-tenant / working-renter base with shorter leases.
- Zoned schools: Acton Elementary School (math 57% / reading 47%, grade C-, #237 of 994 statewide, top 26%, 534 students, 46% FRL); Franklin Central High School (math 41% / reading 69%, grade C, #77 of 369 statewide, top 21%, 3,319 students, 46% FRL) — zoned schools average 46% FRL vs 29% district-wide (17 pts higher); higher-poverty schools than district average — tighter screening recommended.
- Market conditions: 159 active listings in the ZIP; 1 comparable units currently listed for rent nearby; high-income renter base; 1,906 units permitted in Marion County in 2024 (621 in 5+ unit buildings).
Forward outlook
- Local home prices are declining (-3.0%/yr); year-one equity from $2k of loan paydown is wiped out by about $8k of value loss. Plan a longer hold.
- Marion County population projected at +18% by 2050 — long-run rental-demand tailwind backs the buy-and-hold thesis.
Negotiation context
- Only 2 days on market — expect competitive offers; lowballing is unlikely to land.
Risks & watch-outs
- Watch-outs: built in 1955 — expect roof / HVAC / electrical / plumbing capex.
Questions for the listing agent
- What do current leases actually rent for vs. the listed asking? Can we see a recent rent roll and the last 12 months of T-12 income?
- Built in 1955 — when were the roof, HVAC, electrical panel, plumbing, and water heater last replaced?
- Is there a deadline driving the sale (1031 exchange, divorce, estate, relocation)? That informs how much negotiation room exists.
- The area grade is low — what's the realistic commute time and amenity access for the typical tenant pool here? Any planned neighborhood developments (good or bad) we should know about?
- What's the average days-on-market for RENTAL listings here right now (not sales)? A rising rental-DOM trend means longer vacancies and softer asking-rent achievability than the comps imply.
- What's the recent tenant-quality profile in this submarket — average credit score on applications, eviction rate, late-payment / NSF rate, and stable-employment percentage? A property-management company in the area should have these aggregated.
- How much new for-sale + rental construction is in the pipeline within 1–3 miles? Heavy new supply typically softens prices + rents 12–24 months out; constrained supply supports both.
Investment metrics
- 1% rule
- 0.79% ✗
- Cap rate
- 5.95%
- Cash-on-cash
- -1.24%
- DSCR
- 0.94
- GRM
- 10.5
CMA / ARV
- ARV (on-the-fly)
- $259,182
- Comps found
- 5
Show comp detail 5 sales within ~0.75 mi
| Address | Dist | Beds/Ba | Sqft | Sold | Price | $/sf | Match |
|---|---|---|---|---|---|---|---|
| 10805 Charlemagne Dr | 0.22mi | 3/2.0 | 1,288 (-7%) | 12mo | $270,000 | $210 | 66 |
| 6242 Catalina Dr | 0.14mi | 3/1.5 | 1,520 (+10%) | 20mo | $275,000 | $181 | 61 |
| 6238 Fairlane Dr | 0.32mi | 3/1.5 | 1,320 (-5%) | 21mo | $250,000 | $189 | 60 |
| 6226 Fairlane Dr | 0.32mi | 3/2.0 | 1,536 (+11%) | 13mo | $287,000 | $187 | 54 |
| 6859 Bloomfield Dr E | 0.71mi | 3/2.0 | 1,589 (+15%) | 4mo | $289,100 | $182 | 38 |
Match score weights: distance 35% · size 25% · config 20% · recency 20%. Top-matched comps best support the ARV.
Projected returns pro-forma
-3.0% appreciation · 3.0% rent growth · sell at horizon
- IRR
- -18.4%
- Equity multiple
- 0.36×
- Total profit
- $-46,924
- Equity at exit
- $38,752
- IRR
- -10.7%
- Equity multiple
- 0.35×
- Total profit
- $-47,134
- Equity at exit
- $22,471
Cash invested: $72,772 (down + closing). Projections, not guarantees.
Landlord ↔ Tenant lean methodology
- Overall (STATE)
- 90 Strongly Landlord-Friendly
- State Indiana
- 90 Strongly Landlord-Friendly · R+11
- County
- — inherits STATE
- City
- — inherits STATE
ZIP-level market 46259
- Home prices YoY
- -26.8%
- Active inventory
- 159
- Price-to-rent
- 10.5×
Monthly cashflow live
- Estimated rent
- $2,054 medium interval (Pro) →
- Mortgage (P&I)
- −$1,363
- Tax from tax record
- −$226 /mo · $2,717/yr
- Insurance
- −$108
- HOA
- −$0
- Vacancy / Maint / Mgmt
- −$431
- Net cashflow
- $-75
Break-even live
Sensitivity live
| Price | -10% $72 | -5% $-1 | +0% $-75 | +5% $-149 | +10% $-222 |
|---|---|---|---|---|---|
| Rent | -10% $-237 | -5% $-156 | +0% $-75 | +5% $6 | +10% $87 |
| Rate | -1.0pp $56 | -0.5pp $-9 | base $-75 | +0.5pp $-142 | +1.0pp $-211 |
UW: 25.0% down · 7.5% · 30yr · 1.5% tax · 5.0% vac · 8.0% maint · 8.0% mgmt
Financing live
Cash to close
- Down payment
- $64,975
- Closing costs
- $7,797
- Reserves months
- —
- Total cash needed
- —
Loan-product check · same deal, 3 products live
Conventional
25% down · 7.5% · 30yr
- Down + closing
- —
- Monthly P&I
- —
- Monthly cashflow
- —
- DSCR
- —
- Eligible?
- —
Personal DTI + credit; lowest rate.
DSCR
20% down · 8.5% · 30yr
- Down + closing
- —
- Monthly P&I
- —
- Monthly cashflow
- —
- DSCR
- —
- Eligible?
- —
No personal income docs; deal must DSCR.
Hard money
10% down · 12.0% · 12mo
- Down + closing
- —
- Monthly P&I
- —
- Monthly cashflow
- —
- DSCR
- —
- Eligible?
- —
Short-term bridge; refi at stabilization.
Rent comps 1 comps
| Address | Beds | Baths | Sqft | Rent | $/sqft | DOM | Units | Dist |
|---|---|---|---|---|---|---|---|---|
| 10166 Southeastern Ave Indianapolis, IN | 2.0 | 1.5 | 1625 | $1,295 | $0.80 | 24d | 1 | 1.27mi |
Listing history 3 events
-
2026-06-13statusdays on market $259,900 Pending 2 DOM
-
2026-06-08remarks 699-char remark
-
2026-06-08$259,900 Active 1 DOM
ⓘ Source: listings_history table (triggers on properties + properties_extension) + one-shot
backfill from property_details.listing_events for pre-trigger history.
Tax reassessment forecast IN · Partial reset (capped growth)
- Current annual tax
- $2,717 · $226/mo
- Projected year-2 tax
- $2,717 · $226/mo
- Expected delta
- $0/yr ($0/mo · 0.0%)
ⓘ Screening estimate from a state-policy table — verify with the county assessor before closing.
Climate risk First Street
- Flood 1/10 Low FEMA zone X (unshaded) · 0% chance over 30 yrs
- Wildfire 1/10 Low
- Heat 3/10 Moderate 7 d/yr ≥101°F today · 19 d/yr by 30 yrs out
- Wind 2/10 Low 100% chance of damaging wind over 30 yrs
- Air quality 2/10 Low 1 unhealthy d/yr today · 2 by 30 yrs out
Nearby sold comps map
Loading sold comps map…
Walkable amenities ~0.75 mi
Loading nearby amenities…
Taxation est. · year 1
- Rental income
- $24,647
- − Mortgage interest
- −$14,558
- − Property taxes
- −$2,717
- − Insurance
- −$1,300
- − Repairs & maintenance
- −$1,972
- − Management
- −$1,972
- − Depreciation
- −$7,561
- Taxable loss
- −$5,432
- Est. tax savings @ 24.0%
- +$1,304
- After-tax cash flow
- $403/yr
For passive investors: Depreciation is non-cash, so a rental often shows a tax loss while cash-flowing — sheltering income. Rental losses are passive: they offset passive income freely, and up to $25,000/yr can offset ordinary (W-2) income if you actively participate and your MAGI is under $100k (phasing out to $0 by $150k); unused losses carry forward. On sale, claimed depreciation is recaptured at up to 25%, and gains may owe capital-gains tax (a 1031 exchange can defer both). Figures are a year-1 estimate at your 24.0% rate — not tax advice; consult a CPA.
Schools (NCES district)
- District
- Franklin Township Community School Corporation
- NCES district ID
- 1803750
- Math proficiency
- 42% ▼ -12.00%
- Reading proficiency
- 47% ▼ -6.00%
- Median HH income
- $67,825
- Composite
- 39.91/100
- National rank
- #3852
- State rank
- #87 of 301 in IN
Livability — Indianapolis city (balance)
No livability data for this city. (Only ~50 U.S. cities are tracked.)
Census & demographics
- Census place
- Indianapolis city (balance), IN
- County
- Marion County · 998,460 people
- City population
- 881,119
- Metro
- Indianapolis-Carmel-Anderson, IN
- Population (ZIP)
- 15,169
- Household income
- $129,345
- Rent vs Own
- Severe rent burden
- 78.0
Population outlook (Marion County) Hauer SSP2
- Today (2025)
- 1,025,572 people
- By 2030
- 1,065,727 · +3.9%
- By 2040
- 1,141,577 · +11.3%
- By 2050
- 1,208,920 · +17.9%
- By 2075
- 1,367,288 · +33.3%
- By 2100
- 1,438,201 · +40.2%
Race, ethnicity, and origin ACS 2023
- Neighborhood character
- Predominantly White (79%)
- Race & ethnicity
- White 79% Two or more races 9% Asian 8% Hispanic / Latino 7%
- Hispanic origin (detail)
- Mexican 5%
- Common ancestry
- Slovak 4% Lithuanian 4% Italian 3%
- Foreign-born
- 7% · Canada, Dominican Republic
- Languages at home
- 89% English-only · Other Indo-European 8% Spanish 2% Tagalog/Filipino 1%
Political lean MEDSL · Marion
- 2024 margin
- Strong D (+27.7) · D 63.0% · R 35.3% · Other 1.7%
- 2008→2024 swing
- -0.7pp no change · 2008: 28.4pp · 2024: 27.7pp
- All cycles
- 2024: D+27.7 2020: D+29.1 2016: D+22.8 2012: D+22.2 2008: D+28.4
Not yet ingested
- Civics
- —
Market trends
- HPI YoY
- ▼ -86.96%
- Current HPI
- 237.9165
- Rent YoY
- —
- Metro
- Indianapolis-Carmel-Anderson, IN
- State GDP YoY
- ▲ 2.90%
- F500 in state
- 18
Industry mix (Fortune 500 HQ in IN)
| Industry | F500 HQs | Revenue |
|---|---|---|
| Industrial Machinery | 2 | $37B |
|
||
| Healthcare | 1 | $177B |
|
||
| Pharmaceuticals | 1 | $45B |
|
||
| Metals / Steel | 1 | $18B |
|
||
| Agriculture | 1 | $17B |
|
||
| Packaging | 1 | $12B |
|
||
Price history
1 event — show timeline
- 2026-06-08 Listed $259,900 MIBOR as Distributed by MLS Grid
Property tax history
+6.5%/yrLatest (2025): $2,717 · +7.9% YoY. Source: county tax records.
Cash-flow waterfall
monthlySold comps — $/sqft
last 12 mo · ≤1 miLoading sold comps…