 Multi-family
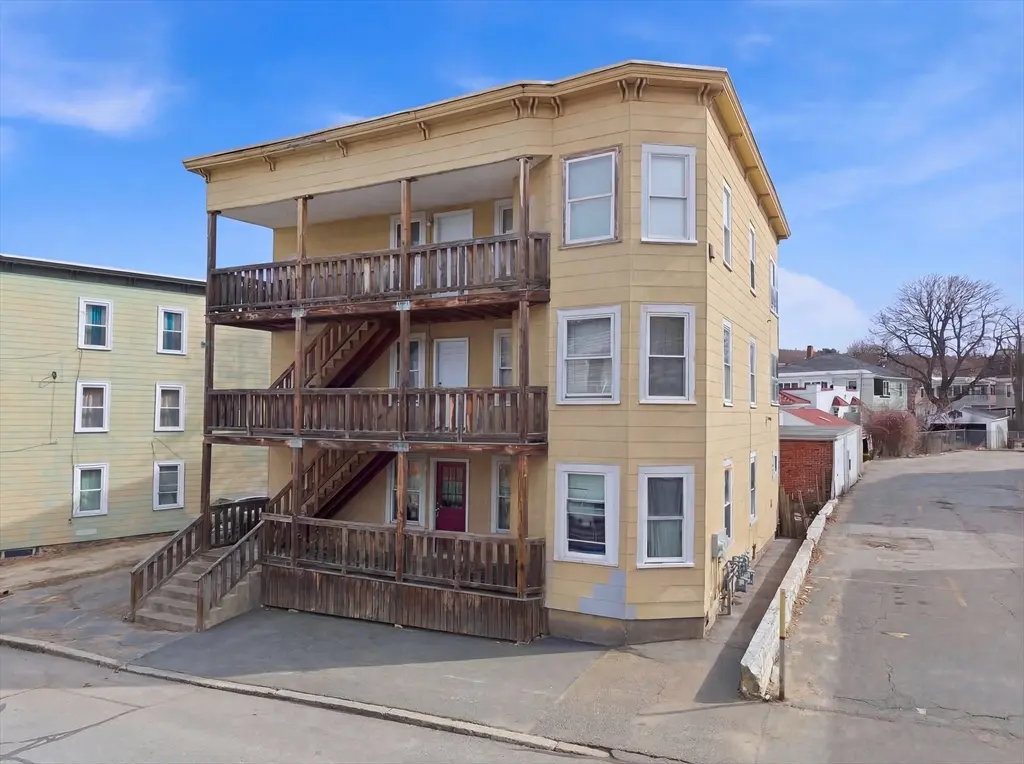
119 Woodland St · Fitchburg, MA
Flood risk 6/10 · Moderate
- FEMA flood zone
- —
- Chance of flooding over 30 yrs
- 0.75%
- Est. flood insurance / yr
- —
Fire risk 3/10 · Minor
- Est. fire insurance / yr
- $915 – $1,699
Heat risk 4/10 · Minor
- Hot days now (above 94°F)
- 8 days/yr
- Hot days in 30 yrs
- 18 days/yr
Wind risk 5/10 · Moderate
- Chance of severe wind over 30 yrs
- 26.0%
Air-quality risk 2/10 · Minimal
- Unhealthy air days now
- 1 days/yr
- Unhealthy air days in 30 yrs
- 1 days/yr
Risk factors via First Street. Map © Google.
Why this score? — see what drove the D grade
The composite is a weighted blend of 9 inputs, each scored 0–100. Each bar is that input's sub-score; the figure is the points it added to the 100-point composite (weight × sub-score).
- Cash flow +19.5/30.0
- DSCR +6.2/10.0
- 1% rule +4.3/10.0
- Livability +3.5/5.0
- Rent growth +3.3/5.0
- Condition / age +2.5/5.0
- Schools +2.0/10.0
- ARV discount +1.3/15.0
- Appreciation +0.0/10.0
$634,900
🖨 Deal sheet 📄 Offer letter ✓ Due diligence
Multi-family units
County records classify this as Multi-Family (2-4 Unit). Listing-text estimate: 1 unit. estimate disagrees with records
Listing remarks MLS
This multi-family residence presents a captivating opportunity. Its enduring architecture, originating in 1900, offers a distinctive presence within its surroundings. Within its expansive 3198 square feet of living area, this structure accommodates ten distinct bedrooms, each offering personal retreats for occupants. Complementing these spaces are three full bathrooms, providing convenience and comfort throughout the dwelling. The three stories of this substantial dwelling contribute to the generous living environment. Occupying a lot of 3454 square feet, the property offers its own dedicated outdoor space. This distinguished multi-family residence invites exploration for those seeking a property of remarkable scale and enduring character.
Key facts
- 3,454 sq ft lot
- 6 parking spots
- Built 1900
Neighborhood map
What this means for you Summary
Snapshot
- This is a 10-bed/3.0-bath multifamily listed at $635k.
Deal economics
- At list price, monthly cash flow is $719 ($9k/yr) — positive.
- The deal already cash-flows at list — no discount required.
- To meet the 1% rule (rent ≥ 1% of price), the offer needs to be $592k (6.7% below list).
- Recommended offer: $592k (6.7% below list) — sets the bar for 1% rule.
- Cap rate 7.7% vs local median 4.0% in Fitchburg — top-decile yield for the area; either an underpriced asset or a hidden risk that comps aren't pricing in. Stress-test before assuming the spread holds.
Location & tenants
- Location reads 69/100 on livability (#137 in MA) — a middle-class / working-renter tenant base. Strengths: housing A+, commute A-, health & safety B+; Watch: employment D+, crime D, schools D-.
- Fitchburg (suburban): math 15% / reading 30% proficiency, ranked #282 of 302 in MA (top 93%) — low school quality limits family demand, transient renter base, plan for 1-2y turnover; 64% free/reduced lunch — lower-income household profile, screen leases tightly.
- Market conditions: Rents rising (+3.1%/yr); 79 active listings in the ZIP; 2,293 units permitted in Worcester County in 2024 (1,205 in 5+ unit buildings).
- At $5,922/mo this rent would consume 98% of the median local household income ($73k/yr) (locally 1763% of renters already pay >50% of income on rent) — very limited rent-growth headroom before tenants either downsize or default.
Forward outlook
- Local home prices are declining (-3.0%/yr); year-one equity from $4k of loan paydown is wiped out by about $19k of value loss. Plan a longer hold.
Negotiation context
- It's been on market 58 days — a 3% lower offer ($616k) is reasonable based on typical stale-listing flexibility.
- 6 sale attempts since 22y ago with the ask held roughly flat each time — persistent listings suggest the price (not the market) is what's stuck; bring a comps-based counter.
Risks & watch-outs
- Watch-outs: built in 1900 — expect roof / HVAC / electrical / plumbing capex.
- Climate carrying-cost: major flood risk; moderate wind risk, 26% chance of damaging wind over 30y — expect insurance premiums to compound above CPI over the hold.
Questions for the listing agent
- It's been on market 58 days. Have you received any prior offers? Is the seller open to a 7% concession, seller financing, or rate buy-down credit?
- Built in 1900 — when were the roof, HVAC, electrical panel, plumbing, and water heater last replaced?
- Is there a deadline driving the sale (1031 exchange, divorce, estate, relocation)? That informs how much negotiation room exists.
- Schools are D-rated, which usually means shorter tenancies and higher turnover. Who's the typical renter profile here, and what's been the actual vacancy rate?
- Crime grade is D in this area — have there been break-ins, vandalism, or insurance claims at this property in the last 3 years? What carrier currently insures it and at what premium?
- The area grade is low — what's the realistic commute time and amenity access for the typical tenant pool here? Any planned neighborhood developments (good or bad) we should know about?
- What's the average days-on-market for RENTAL listings here right now (not sales)? A rising rental-DOM trend means longer vacancies and softer asking-rent achievability than the comps imply.
- What's the recent tenant-quality profile in this submarket — average credit score on applications, eviction rate, late-payment / NSF rate, and stable-employment percentage? A property-management company in the area should have these aggregated.
- How much new apartment / multifamily construction is in the pipeline within 1–3 miles? Heavy new supply (>2% of stock underway) typically softens rents 12–24 months out; light construction supports rent growth.
Investment metrics
- 1% rule
- 0.93% ✗
- Cap rate
- 7.65%
- Cash-on-cash
- 4.85%
- DSCR
- 1.22
- GRM
- 8.9
CMA / ARV
- ARV (median comp)
- $557,940
- List price
- $634,900
- Delta
- 13.79%
- Verdict
- OVERPRICED
- Comps
- 20 within 1.0 mi
Show comp detail 5 sales within ~0.75 mi
| Address | Dist | Beds/Ba | Sqft | Sold | Price | $/sf | Match |
|---|---|---|---|---|---|---|---|
| 66-68 Clarendon St | 0.18mi | 9/3.0 (-1) | 3,024 (-6%) | 0mo | $625,000 | $207 | 77 |
| 228 Daniels St | 0.02mi | 9/3.0 (-1) | 3,521 (+10%) | 2mo | $650,000 | $185 | 76 |
| 19 Chester St | 0.12mi | 10/4.0 | 3,510 (+10%) | 10mo | $720,000 | $205 | 66 |
| 115 Madison St | 0.14mi | 9/3.0 (-1) | 2,922 (-9%) | 11mo | $630,000 | $216 | 65 |
| 90 Leighton St | 0.64mi | 9/3.5 (-1) | 3,144 (-2%) | 14mo | $640,000 | $204 | 48 |
Match score weights: distance 35% · size 25% · config 20% · recency 20%. Top-matched comps best support the ARV.
Projected returns pro-forma
-3.0% appreciation · 3.06% rent growth · sell at horizon
- IRR
- -8.7%
- Equity multiple
- 0.68×
- Total profit
- $-56,908
- Equity at exit
- $94,666
- IRR
- 0.8%
- Equity multiple
- 1.06×
- Total profit
- $10,171
- Equity at exit
- $54,895
Cash invested: $177,772 (down + closing). Projections, not guarantees.
Landlord ↔ Tenant lean methodology
- Overall (STATE)
- 20 Strongly Tenant-Friendly
- State Massachusetts
- 20 Strongly Tenant-Friendly · D+15
- County
- — inherits STATE
- City
- — inherits STATE
ZIP-level market 01420
- Home prices YoY
- -25.2%
- Rents YoY
- 3.1%
- Active inventory
- 79
- Price-to-rent
- 26.8×
Monthly cashflow live
- Estimated rent
- $5,922 high interval (Pro) →
- Mortgage (P&I)
- −$3,329
- Tax from tax record
- −$365 /mo · $4,385/yr
- Insurance
- −$265
- HOA
- −$0
- Vacancy / Maint / Mgmt
- −$1,244
- Net cashflow
- $719
Break-even live
3-unit breakdown (identical units grouped — click to expand)
| Units | Beds | Baths | Est. rent |
|---|---|---|---|
| 3× units | 3 | 1 | $5,922 |
| #1 | 3 | 1 | $1,974 |
| #2 | 3 | 1 | $1,974 |
| #3 | 3 | 1 | $1,974 |
| Total (3 units) | $5,922 | ||
UW: 25.0% down · 7.5% · 30yr · 1.5% tax · 5.0% vac · 8.0% maint · 8.0% mgmt
Financing live
Cash to close
- Down payment
- $158,725
- Closing costs
- $19,047
- Reserves months
- —
- Total cash needed
- —
Loan-product check · same deal, 3 products live
Conventional
25% down · 7.5% · 30yr
- Down + closing
- —
- Monthly P&I
- —
- Monthly cashflow
- —
- DSCR
- —
- Eligible?
- —
Personal DTI + credit; lowest rate.
DSCR
20% down · 8.5% · 30yr
- Down + closing
- —
- Monthly P&I
- —
- Monthly cashflow
- —
- DSCR
- —
- Eligible?
- —
No personal income docs; deal must DSCR.
Hard money
10% down · 12.0% · 12mo
- Down + closing
- —
- Monthly P&I
- —
- Monthly cashflow
- —
- DSCR
- —
- Eligible?
- —
Short-term bridge; refi at stabilization.
Listing history 34 events
-
2026-06-18days on market $634,900 Active 58 DOM
-
2026-06-17days on market $634,900 Active 57 DOM
-
2026-06-16days on market $634,900 Active 56 DOM
-
2026-06-15days on market $634,900 Active 55 DOM
-
2026-06-14days on market $634,900 Active 53 DOM
-
2026-06-10days on market $634,900 Active 50 DOM
-
2026-06-09days on market $634,900 Active 49 DOM
-
2026-06-08days on market $634,900 Active 48 DOM
-
2026-06-07days on market $634,900 Active 47 DOM
-
2026-06-03days on market $634,900 Active 43 DOM
-
2026-06-02days on market $634,900 Active 42 DOM
-
2026-06-01days on market $634,900 Active 41 DOM
-
2026-05-31days on market $634,900 Active 40 DOM
-
2026-05-31days on market $634,900 Active 39 DOM
-
2026-04-21$634,900 New 749-char remark
Show marketing remark (749 chars)
This multi-family residence presents a captivating opportunity. Its enduring architecture, originating in 1900, offers a distinctive presence within its surroundings. Within its expansive 3198 square feet of living area, this structure accommodates ten distinct bedrooms, each offering personal retreats for occupants. Complementing these spaces are three full bathrooms, providing convenience and comfort throughout the dwelling. The three stories of this substantial dwelling contribute to the generous living environment. Occupying a lot of 3454 square feet, the property offers its own dedicated outdoor space. This distinguished multi-family residence invites exploration for those seeking a property of remarkable scale and enduring character.
-
2025-03-03soldstatus $625,000 Sold 608-char remark
Show marketing remark (608 chars)
This three family is in the process of being finished. Two units are already completed and the final unit is being finished. First floor is 4 bedrooms and will be left vacant upon completion for an owner occupied buyer. Second floor is 3 bedrooms and has been rented. Third floor is 3 bedrooms and is in the process of being rented. Each floor has a front balcony and the second and third floor has an enclosed back porch. All 3 units have their own separate washer and dryer hookups inside the units. The first floor has a full shower/tub, while the second and third floor only have shower stalls (no tubs).
-
2025-01-01status Under Agreement 608-char remark
Show marketing remark (608 chars)
This three family is in the process of being finished. Two units are already completed and the final unit is being finished. First floor is 4 bedrooms and will be left vacant upon completion for an owner occupied buyer. Second floor is 3 bedrooms and has been rented. Third floor is 3 bedrooms and is in the process of being rented. Each floor has a front balcony and the second and third floor has an enclosed back porch. All 3 units have their own separate washer and dryer hookups inside the units. The first floor has a full shower/tub, while the second and third floor only have shower stalls (no tubs).
-
2024-11-25$625,000 New 608-char remark
Show marketing remark (608 chars)
This three family is in the process of being finished. Two units are already completed and the final unit is being finished. First floor is 4 bedrooms and will be left vacant upon completion for an owner occupied buyer. Second floor is 3 bedrooms and has been rented. Third floor is 3 bedrooms and is in the process of being rented. Each floor has a front balcony and the second and third floor has an enclosed back porch. All 3 units have their own separate washer and dryer hookups inside the units. The first floor has a full shower/tub, while the second and third floor only have shower stalls (no tubs).
-
2016-10-28soldstatus $142,500 Sold
-
2016-09-03status Contingent
-
2016-08-28$169,900 New
-
2010-01-28soldstatus $60,000 Sold
-
2009-12-28historical Under Agreement
-
2009-12-15price $65,000 Price Changed
-
2009-11-30$80,000 New
-
2005-10-27soldstatus $283,000
-
2005-10-27soldstatus $283,000
-
2005-08-24historical
-
2005-08-11$278,000
-
2004-12-15soldstatus $254,750
-
2004-12-15soldstatus $254,750
-
2004-10-09historical
-
2004-09-20$259,900
-
1988-10-18soldstatus $44,000
ⓘ Source: listings_history table (triggers on properties + properties_extension) + one-shot
backfill from property_details.listing_events for pre-trigger history.
Tax reassessment forecast MA · Partial reset (capped growth)
- Current annual tax
- $4,385 · $365/mo
- Projected year-2 tax
- $6,097 · $508/mo
- Expected delta
- +$1,712/yr (+$143/mo · 39.0%)
ⓘ Screening estimate from a state-policy table — verify with the county assessor before closing.
Climate risk First Street
- Flood 6/10 Major 75% chance over 30 yrs
- Wildfire 3/10 Moderate
- Heat 4/10 Moderate 8 d/yr ≥94°F today · 18 d/yr by 30 yrs out
- Wind 5/10 Major 26% chance of damaging wind over 30 yrs
- Air quality 2/10 Low 1 unhealthy d/yr today · 1 by 30 yrs out
Nearby sold comps map
Loading sold comps map…
Walkable amenities ~0.75 mi
Loading nearby amenities…
Taxation est. · year 1
- Rental income
- $71,064
- − Mortgage interest
- −$35,564
- − Property taxes
- −$4,385
- − Insurance
- −$3,174
- − Repairs & maintenance
- −$5,685
- − Management
- −$5,685
- − Depreciation
- −$18,470
- Taxable loss
- −$1,900
- Est. tax savings @ 24.0%
- +$456
- After-tax cash flow
- $9,083/yr
For passive investors: Depreciation is non-cash, so a rental often shows a tax loss while cash-flowing — sheltering income. Rental losses are passive: they offset passive income freely, and up to $25,000/yr can offset ordinary (W-2) income if you actively participate and your MAGI is under $100k (phasing out to $0 by $150k); unused losses carry forward. On sale, claimed depreciation is recaptured at up to 25%, and gains may owe capital-gains tax (a 1031 exchange can defer both). Figures are a year-1 estimate at your 24.0% rate — not tax advice; consult a CPA.
Schools (NCES district)
- District
- Fitchburg
- NCES district ID
- 2504890
- Math proficiency
- 15% ▼ -14.00%
- Reading proficiency
- 30% ▼ -7.00%
- Median HH income
- $48,430
- Composite
- 19.78/100
- National rank
- #8705
- State rank
- #282 of 302 in MA
Livability — Fitchburg
- Score
- 69/100
- State rank
- #137
- US rank
- #8435
Category grades
Schools grade is shown separately in the Schools card above.
Census & demographics
- Census place
- Fitchburg, MA
- County
- Worcester County · 487,911 people
- City population
- 41,839
- Metro
- Worcester, MA-CT
- Population (ZIP)
- 41,839
- Household income
- $72,780
- Rent vs Own
- Severe rent burden
- 1763.0
Population outlook (Worcester County) Hauer SSP2
- Today (2025)
- 850,858 people
- By 2030
- 860,403 · +1.1%
- By 2040
- 869,902 · +2.2%
- By 2050
- 869,110 · +2.1%
- By 2075
- 870,120 · +2.3%
- By 2100
- 829,703 · -2.5%
Race, ethnicity, and origin ACS 2023
- Neighborhood character
- Diverse neighborhood (Simpson 0.58)
- Race & ethnicity
- White 57% Hispanic / Latino 30% Two or more races 19% Black 6% Asian 2%
- Hispanic origin (detail)
- Mexican 2% Puerto Rican 20% Dominican 2%
- Common ancestry
- Lithuanian 8% Romanian 3% Slovak 1%
- Foreign-born
- 10% · Canada, Jamaica
- Languages at home
- 71% English-only · Spanish 22% French/Haitian/Cajun 3% Other Indo-European 2%
Political lean MEDSL · Worcester
- 2024 margin
- D (+10.0) · D 53.9% · R 43.9% · Other 2.2%
- 2008→2024 swing
- -3.8pp toward R · 2008: 13.8pp · 2024: 10.0pp
- All cycles
- 2024: D+10.0 2020: D+17.8 2016: D+10.5 2012: D+9.2 2008: D+13.8
Not yet ingested
- Civics
- —
Market trends
- HPI YoY
- ▼ -102.11%
- Current HPI
- 303.1067
- Rent YoY
- ▲ 3.06%
- Metro
- Worcester, MA-CT
- State GDP YoY
- ▲ 2.28%
- F500 in state
- 38
Industry mix (Fortune 500 HQ in MA)
| Industry | F500 HQs | Revenue |
|---|---|---|
| Technology | 3 | $17B |
|
||
| Insurance | 2 | $84B |
|
||
| Retail | 2 | $76B |
|
||
| Life Sciences | 1 | $43B |
|
||
| Energy Technology | 1 | $31B |
|
||
| Aerospace / Defense | 1 | $18B |
|
||
Price history
+1343.0% since first listed20 events — show timeline
- 2026-04-21 Listed $634,900 MLS PIN
- 2025-03-03 Sold (MLS) $625,000 MLS PIN
- 2025-01-01 Pending — MLS PIN
- 2024-11-25 Listed $625,000 MLS PIN
- 2016-10-28 Sold (MLS) $142,500 MLS PIN
- 2016-09-03 Pending — MLS PIN
- 2016-08-28 Listed $169,900 MLS PIN
- 2010-01-28 Sold (MLS) $60,000 MLS PIN
- 2009-12-28 Contingent — MLS PIN
- 2009-12-15 Price Changed $65,000 MLS PIN
- 2009-11-30 Listed $80,000 MLS PIN
- 2005-10-27 Sold (Public Records) $283,000 Public Records
- 2005-10-27 Sold (MLS) $283,000 MLS PIN
- 2005-08-24 Listing Removed — MLS PIN
- 2005-08-11 Listed $278,000 MLS PIN
- 2004-12-15 Sold (Public Records) $254,750 Public Records
- 2004-12-15 Sold (MLS) $254,750 MLS PIN
- 2004-10-09 Listing Removed — MLS PIN
- 2004-09-20 Listed $259,900 MLS PIN
- 1988-10-18 Sold (Public Records) $44,000 Public Records
Property tax history
+3.5%/yrLatest (2022): $4,385 · +10.9% YoY. Source: county tax records.
Cash-flow waterfall
monthlySold comps — $/sqft
last 12 mo · ≤1 miLoading sold comps…