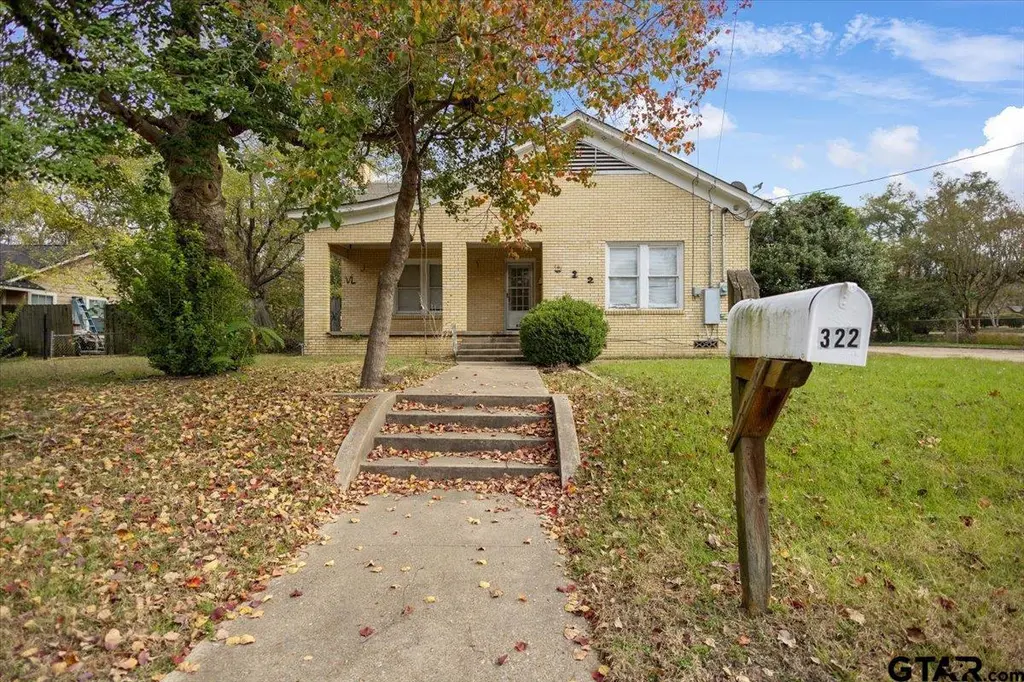
322 S Clayton Ave · Tyler, TX
Flood risk 1/10 · Minimal
- FEMA flood zone
- X (unshaded)
- Chance of flooding over 30 yrs
- 0.0%
- Est. flood insurance / yr
- $507 – $1,088
Fire risk 4/10 · Minor
- Est. fire insurance / yr
- $1,222 – $2,270
Heat risk 6/10 · Moderate
- Hot days now (above 109°F)
- 7 days/yr
- Hot days in 30 yrs
- 26 days/yr
Wind risk 6/10 · Moderate
- Chance of severe wind over 30 yrs
- 60.0%
Air-quality risk 2/10 · Minimal
- Unhealthy air days now
- 0 days/yr
- Unhealthy air days in 30 yrs
- 1 days/yr
Risk factors via First Street. Map © Google.
Why this score? — see what drove the C grade
The composite is a weighted blend of 9 inputs, each scored 0–100. Each bar is that input's sub-score; the figure is the points it added to the 100-point composite (weight × sub-score).
- Cash flow +18.2/30.0
- ARV discount +15.0/15.0
- DSCR +5.7/10.0
- 1% rule +5.6/10.0
- Livability +3.8/5.0
- Schools +3.3/10.0
- Rent growth +3.1/5.0
- Condition / age +2.5/5.0
- Appreciation +0.0/10.0
$159,900
🖨 Deal sheet 📄 Offer letter ✓ Due diligence
Listing remarks MLS
Discover the potential at 322 S Clayton—an old-school charmer with over 1,700 sq. ft. of space, ready for your vision and revival. This solid brick-veneer home offers an official living area, a dedicated dining space, a large kitchen, and 3 bedrooms with 1.5 baths. The location is unbeatable—just minutes from the hospitals, making it an ideal opportunity for a long-term rental, travel-nurse rental, or Airbnb. With the right updates, this property could shine again and become a strong income-producing investment. If you’re looking for a project with great bones and even better potential, come see 322 S Clayton today!
Key facts
- Built 1940
- Listed 180 days
Neighborhood map
What this means for you Summary
Snapshot
- This is a 3-bed/1.0-bath single-family listed at $160k.
Deal economics
- At list price, monthly cash flow is $144 ($2k/yr) — positive.
- The deal already cash-flows at list — no discount required.
- Meets the 1% rule at list price ($2k rent vs $160k).
- Recommended offer: $141k (12.0% below list) — sets the bar for market timing.
- Cap rate 7.4% vs local median 3.6% in Tyler — top-decile yield for the area; either an underpriced asset or a hidden risk that comps aren't pricing in. Stress-test before assuming the spread holds.
Location & tenants
- Location reads 75/100 on livability (#147 in TX, #4,181 nationally) — a middle-class / working-renter tenant base. Strengths: cost of living A+, housing A+, health & safety A+; Watch: employment C-, schools D+, crime D+.
- Tyler ISD (urban): math 39% / reading 38% proficiency, ranked #449 of 826 in TX (top 54%) — families likely to look elsewhere, expect single-tenant / working-renter base with shorter leases; 66% free/reduced lunch — lower-income household profile, screen leases tightly.
- Market conditions: Rents rising (+2.3%/yr); 155 active listings in the ZIP; 30 comparable units currently listed for rent nearby; rentals at typical pace (median 21d on market — plan ~3-4 weeks tenant-placement turnaround); 40% of comp listings sitting > 30 days — soft ceiling on asking rent; 595 units permitted in Smith County in 2024 (45 in 5+ unit buildings).
- This rent runs 40% of the median local income ($52k/yr) — at the standard rent-burdened threshold; future hikes will face affordability resistance.
Forward outlook
- Local home prices are declining (-3.0%/yr); year-one equity from $1k of loan paydown is wiped out by about $5k of value loss. Plan a longer hold.
- Smith County population projected at +24% by 2050 — long-run rental-demand tailwind backs the buy-and-hold thesis.
Negotiation context
- It's been on market 180 days — a 12% lower offer ($141k) is reasonable based on typical stale-listing flexibility.
- 3 sale attempts since 3y ago with the ask held roughly flat each time — persistent listings suggest the price (not the market) is what's stuck; bring a comps-based counter.
Risks & watch-outs
- Watch-outs: built in 1940 — expect roof / HVAC / electrical / plumbing capex.
- Climate carrying-cost: major wind risk, 60% chance of damaging wind over 30y; extreme-heat days projected 7→26/yr by 2055 (HVAC capex compounding) — expect insurance premiums to compound above CPI over the hold.
Questions for the listing agent
- It's been on market 180 days. Have you received any prior offers? Is the seller open to a 12% concession, seller financing, or rate buy-down credit?
- Built in 1940 — when were the roof, HVAC, electrical panel, plumbing, and water heater last replaced?
- Why hasn't it sold? Are there any deal-killer items the seller is aware of (foundation, flood, title, zoning, code violations)?
- Is there a deadline driving the sale (1031 exchange, divorce, estate, relocation)? That informs how much negotiation room exists.
- Schools are D-rated, which usually means shorter tenancies and higher turnover. Who's the typical renter profile here, and what's been the actual vacancy rate?
- Crime grade is D in this area — have there been break-ins, vandalism, or insurance claims at this property in the last 3 years? What carrier currently insures it and at what premium?
- What's the average days-on-market for RENTAL listings here right now (not sales)? A rising rental-DOM trend means longer vacancies and softer asking-rent achievability than the comps imply.
- What's the recent tenant-quality profile in this submarket — average credit score on applications, eviction rate, late-payment / NSF rate, and stable-employment percentage? A property-management company in the area should have these aggregated.
- How much new for-sale + rental construction is in the pipeline within 1–3 miles? Heavy new supply typically softens prices + rents 12–24 months out; constrained supply supports both.
Investment metrics
- 1% rule
- 1.06% ✓
- Cap rate
- 7.37%
- Cash-on-cash
- 3.86%
- DSCR
- 1.17
- GRM
- 7.8
CMA / ARV
- ARV (median comp)
- $211,086
- List price
- $159,900
- Delta
- -24.25%
- Verdict
- UNDERPRICED
- Comps
- 17 within 1.0 mi
Show comp detail 2 sales within ~0.75 mi
| Address | Dist | Beds/Ba | Sqft | Sold | Price | $/sf | Match |
|---|---|---|---|---|---|---|---|
| 1520 E Devine St | 0.66mi | 4/2.0 (+1) | 1,720 (-1%) | 20mo | $248,500 | $144 | 42 |
| 1528 E Devine St | 0.66mi | 3/3.0 | 1,522 (-12%) | 6mo | $298,990 | $196 | 35 |
Match score weights: distance 35% · size 25% · config 20% · recency 20%. Top-matched comps best support the ARV.
Projected returns pro-forma
-3.0% appreciation · 2.27% rent growth · sell at horizon
- IRR
- -11.1%
- Equity multiple
- 0.60×
- Total profit
- $-17,889
- Equity at exit
- $23,842
- IRR
- -2.9%
- Equity multiple
- 0.81×
- Total profit
- $-8,434
- Equity at exit
- $13,825
Cash invested: $44,772 (down + closing). Projections, not guarantees.
Landlord ↔ Tenant lean methodology
- Overall (STATE)
- 87 Strongly Landlord-Friendly
- State Texas
- 87 Strongly Landlord-Friendly · R+5
- County
- — inherits STATE
- City
- — inherits STATE
ZIP-level market 75702
- Home prices YoY
- -5.8%
- Rents YoY
- 2.3%
- Active inventory
- 155
- Price-to-rent
- 7.8×
Monthly cashflow live
- Estimated rent
- $1,699 high interval (Pro) →
- Mortgage (P&I)
- −$839
- Tax from tax record
- −$293 /mo · $3,517/yr
- Insurance
- −$67
- HOA
- −$0
- Vacancy / Maint / Mgmt
- −$357
- Net cashflow
- $144
Break-even live
UW: 25.0% down · 7.5% · 30yr · 1.5% tax · 5.0% vac · 8.0% maint · 8.0% mgmt
Financing live
Cash to close
- Down payment
- $39,975
- Closing costs
- $4,797
- Reserves months
- —
- Total cash needed
- —
Loan-product check · same deal, 3 products live
Conventional
25% down · 7.5% · 30yr
- Down + closing
- —
- Monthly P&I
- —
- Monthly cashflow
- —
- DSCR
- —
- Eligible?
- —
Personal DTI + credit; lowest rate.
DSCR
20% down · 8.5% · 30yr
- Down + closing
- —
- Monthly P&I
- —
- Monthly cashflow
- —
- DSCR
- —
- Eligible?
- —
No personal income docs; deal must DSCR.
Hard money
10% down · 12.0% · 12mo
- Down + closing
- —
- Monthly P&I
- —
- Monthly cashflow
- —
- DSCR
- —
- Eligible?
- —
Short-term bridge; refi at stabilization.
Rent comps 30 comps
| Address | Beds | Baths | Sqft | Rent | $/sqft | DOM | Units | Dist |
|---|---|---|---|---|---|---|---|---|
| 211 Patricia Ct Tyler, TX | 3.0 | 2.0 | 1314 | $1,795 | $1.37 | 43d | 1 | 0.27mi |
| 613 S Baxter Ave Tyler, TX | 3.0 | 2.0 | 1090 | $1,250 | $1.15 | 21d | 1 | 0.31mi |
| 324 S Saunders Ave Tyler, TX | 3.0 | 2.0 | 1650 | $2,100 | $1.27 | 43d | 1 | 0.33mi |
| 1421 E Idel St Tyler, TX | 3.0 | 1.5 | 1080 | $1,300 | $1.20 | 13d | 1 | 0.46mi |
| 1729 E Arnold St Tyler, TX | 2.0 | 1.0 | 1074 | $1,295 | $1.21 | 21d | 1 | 0.47mi |
| 411 N Fuller Ave Tyler, TX | 3.0 | 2.0 | 1246 | $1,850 | $1.48 | 43d | 1 | 0.48mi |
| 811 S Mahon Ave Tyler, TX | 3.0 | 2.0 | 1761 | $1,900 | $1.08 | 43d | 1 | 0.50mi |
| 1118 S Fleishel Ave Tyler, TX | 3.0 | 2.0 | 1425 | $1,495 | $1.05 | 13d | 1 | 0.79mi |
| 2009 E Devine St Tyler, TX | 3.0 | 2.0 | 1200 | $1,600 | $1.33 | 43d | 1 | 0.81mi |
| 425 E Oakwood St Tyler, TX | 3.0 | 2.0 | 1298 | $1,540 | $1.19 | 43d | 1 | 0.88mi |
| 132 Rowland Pl Unit b Tyler, TX | 2.0 | 1.0 | 1170 | $1,295 | $1.11 | 21d | 1 | 1.02mi |
| 431 S College Ave Tyler, TX | 2.0 | 1.0 | 1380 | $1,750 | $1.27 | 43d | 1 | 1.08mi |
| 431 S College Ave Tyler, TX | 2.0 | 1.0 | 1380 | $1,650 | $1.20 | 21d | 1 | 1.08mi |
| 305 E Lake St Tyler, TX | 2.0 | 1.5 | 1287 | $1,695 | $1.32 | 13d | 1 | 1.12mi |
| 1712 Redbud Ave Tyler, TX | 3.0 | 1.5 | 1561 | $1,475 | $0.94 | 13d | 1 | 1.13mi |
| 1712 Redbud Ave Tyler, TX | 3.0 | 1.5 | 1305 | $1,475 | $1.13 | 21d | 1 | 1.13mi |
| 1403 S Donnybrook Ave Tyler, TX | 3.0 | 3.0 | 1834 | $2,150 | $1.17 | 43d | 1 | 1.21mi |
| 2401 Airline Dr Tyler, TX | 3.0 | 2.5 | 1512 | $1,325 | $0.88 | 43d | 1 | 1.22mi |
| 1225 San Antonio St Tyler, TX | 3.0 | 2.0 | 1754 | $1,695 | $0.97 | 13d | 1 | 1.26mi |
| 526 S Bonner Ave Apt 4 Tyler, TX | 2.0 | 1.0 | 1120 | $1,175 | $1.05 | 21d | 1 | 1.28mi |
| 540 W Erwin St Tyler, TX | 3.0 | 3.5 | 1956 | $4,000 | $2.04 | 43d | 1 | 1.32mi |
| 548 W Erwin St Tyler, TX | 3.0 | 3.5 | 1956 | $2,295 | $1.17 | 21d | 1 | 1.34mi |
| 548 W Erwin St Tyler, TX | 3.0 | 3.5 | 1956 | $2,495 | $1.28 | 43d | 1 | 1.34mi |
| 556 W Erwin St Tyler, TX | 3.0 | 3.5 | 1956 | $2,550 | $1.30 | 21d | 1 | 1.35mi |
| 2319 Hunter St Tyler, TX | 3.0 | 1.0 | 1200 | $1,225 | $1.02 | 43d | 1 | 1.38mi |
| 328 Mockingbird Ln Tyler, TX | 2.0 | 1.0 | 1200 | $950 | $0.79 | 13d | 1 | 1.41mi |
| 522 W Dobbs St Tyler, TX | 3.0 | 1.0 | 1127 | $1,395 | $1.24 | 13d | 1 | 1.41mi |
| 2020 S Tipton Ave Tyler, TX | 3.0 | 2.0 | 1914 | $2,100 | $1.10 | 13d | 1 | 1.45mi |
| 539 Williams Ct Tyler, TX | 2.0 | 1.0 | 1352 | $1,415 | $1.05 | 21d | 1 | 1.49mi |
| 1115 S Robertson Ave Tyler, TX | 2.0 | 1.0 | 1366 | $1,550 | $1.13 | 13d | 1 | 1.49mi |
Listing history 6 events
-
2026-05-31days on market $159,900 Active 180 DOM
-
2026-05-30days on market $159,900 Active 179 DOM
-
2025-12-03$159,900 Active 641-char remark
Show marketing remark (641 chars)
Discover the potential at 322 S Clayton—an old-school charmer with over 1,700 sq. ft. of space, ready for your vision and revival. This solid brick-veneer home offers an official living area, a dedicated dining space, a large kitchen, and 3 bedrooms with 1.5 baths. The location is unbeatable—just minutes from the hospitals, making it an ideal opportunity for a long-term rental, travel-nurse rental, or Airbnb. With the right updates, this property could shine again and become a strong income-producing investment. If you’re looking for a project with great bones and even better potential, come see 322 S Clayton today!
-
2024-03-09$190,000 Active
-
2023-10-20$200,000 Active
-
1991-09-20soldstatus
ⓘ Source: listings_history table (triggers on properties + properties_extension) + one-shot
backfill from property_details.listing_events for pre-trigger history.
Tax reassessment forecast TX · Resets to sale price
- Current annual tax
- $3,517 · $293/mo
- Projected year-2 tax
- $3,517 · $293/mo
- Expected delta
- $0/yr ($0/mo · 0.0%)
ⓘ Screening estimate from a state-policy table — verify with the county assessor before closing.
Climate risk First Street
- Flood 1/10 Low FEMA zone X (unshaded) · 0% chance over 30 yrs
- Wildfire 4/10 Moderate
- Heat 6/10 Major 7 d/yr ≥109°F today · 26 d/yr by 30 yrs out
- Wind 6/10 Major 60% chance of damaging wind over 30 yrs
- Air quality 2/10 Low 0 unhealthy d/yr today · 1 by 30 yrs out
Nearby sold comps map
Loading sold comps map…
Walkable amenities ~0.75 mi
Loading nearby amenities…
Taxation est. · year 1
- Rental income
- $20,389
- − Mortgage interest
- −$8,957
- − Property taxes
- −$3,517
- − Insurance
- −$800
- − Repairs & maintenance
- −$1,631
- − Management
- −$1,631
- − Depreciation
- −$4,652
- Taxable loss
- −$798
- Est. tax savings @ 24.0%
- +$191
- After-tax cash flow
- $1,921/yr
For passive investors: Depreciation is non-cash, so a rental often shows a tax loss while cash-flowing — sheltering income. Rental losses are passive: they offset passive income freely, and up to $25,000/yr can offset ordinary (W-2) income if you actively participate and your MAGI is under $100k (phasing out to $0 by $150k); unused losses carry forward. On sale, claimed depreciation is recaptured at up to 25%, and gains may owe capital-gains tax (a 1031 exchange can defer both). Figures are a year-1 estimate at your 24.0% rate — not tax advice; consult a CPA.
Schools (NCES district)
- District
- Tyler ISD
- NCES district ID
- 4843470
- Math proficiency
- 39% ▼ -4.00%
- Reading proficiency
- 38% ▼ -1.00%
- Median HH income
- $44,090
- Composite
- 32.69/100
- National rank
- #5650
- State rank
- #449 of 826 in TX
Livability — Tyler
- Score
- 75/100
- State rank
- #147
- US rank
- #4181
Category grades
Schools grade is shown separately in the Schools card above.
Census & demographics
- Census place
- Tyler, TX
- County
- Smith County · 180,570 people
- City population
- 127,842
- Metro
- Tyler, TX
- Population (ZIP)
- 27,927
- Household income
- $51,564
- Rent vs Own
- Severe rent burden
- 803.0
Population outlook (Smith County) Hauer SSP2
- Today (2025)
- 248,890 people
- By 2030
- 261,665 · +5.1%
- By 2040
- 286,114 · +15.0%
- By 2050
- 308,006 · +23.8%
- By 2075
- 354,171 · +42.3%
- By 2100
- 372,828 · +49.8%
Race, ethnicity, and origin ACS 2023
- Neighborhood character
- Diverse neighborhood (Simpson 0.61)
- Race & ethnicity
- Hispanic / Latino 49% Black 37% White 12% Two or more races 11% Native American 1%
- Hispanic origin (detail)
- Mexican 47%
- Common ancestry
- Lithuanian 1%
- Foreign-born
- 20% · Canada
- Languages at home
- 56% English-only · Spanish 44%
Political lean MEDSL · Smith
- 2024 margin
- Solid R (+45.1) · D 27.0% · R 72.1%
- 2008→2024 swing
- -5.6pp toward R · 2008: -39.5pp · 2024: -45.1pp
- All cycles
- 2024: R+45.1 2020: R+39.4 2016: R+43.9 2012: R+46.9 2008: R+39.5
Not yet ingested
- Civics
- —
Market trends
- HPI YoY
- ▼ -12.63%
- Current HPI
- 207.1573
- Rent YoY
- ▲ 2.27%
- Metro
- Tyler, TX
- State GDP YoY
- ▲ 3.95%
- F500 in state
- 110
Industry mix (Fortune 500 HQ in TX)
| Industry | F500 HQs | Revenue |
|---|---|---|
| Energy | 16 | $1,198B |
|
||
| Technology | 5 | $198B |
|
||
| Engineering / Construction | 4 | $72B |
|
||
| Energy Services | 3 | $60B |
|
||
| Utilities | 3 | $41B |
|
||
| Healthcare | 2 | $330B |
|
||
Price history
-20.1% since first listed4 events — show timeline
- 2025-12-03 Listed $159,900 GTAR
- 2024-03-09 Listed $190,000 GTAR
- 2023-10-20 Listed $200,000 GTAR
- 1991-09-20 Sold (Public Records) — Public Records
Property tax history
+8.2%/yrLatest (2024): $3,517 · +17.1% YoY. Source: county tax records.
Cash-flow waterfall
monthlySold comps — $/sqft
last 12 mo · ≤1 miLoading sold comps…