310 Butte Creek Rd · Raymond, WA
Flood risk 8/10 · Major
- FEMA flood zone
- X (unshaded)
- Chance of flooding over 30 yrs
- 0.99%
- Est. flood insurance / yr
- $507 – $1,088
Fire risk 1/10 · Minimal
- Est. fire insurance / yr
- $604 – $1,122
Heat risk 1/10 · Minimal
- Hot days now (above 83°F)
- 7 days/yr
- Hot days in 30 yrs
- 14 days/yr
Wind risk 1/10 · Minimal
- Chance of severe wind over 30 yrs
- —
Air-quality risk 6/10 · Moderate
- Unhealthy air days now
- 6 days/yr
- Unhealthy air days in 30 yrs
- 7 days/yr
Risk factors via First Street. Map © Google.
Why this score? — see what drove the B- grade
The composite is a weighted blend of 9 inputs, each scored 0–100. Each bar is that input's sub-score; the figure is the points it added to the 100-point composite (weight × sub-score).
- Cash flow +29.3/30.0
- DSCR +10.0/10.0
- 1% rule +8.2/10.0
- ARV discount +7.5/15.0
- Livability +3.6/5.0
- Schools +3.5/10.0
- Rent growth +2.5/5.0
- Condition / age +2.5/5.0
- Appreciation +1.1/10.0
$121,100
🖨 Deal sheet 📄 Offer letter ✓ Due diligence
Listing remarks
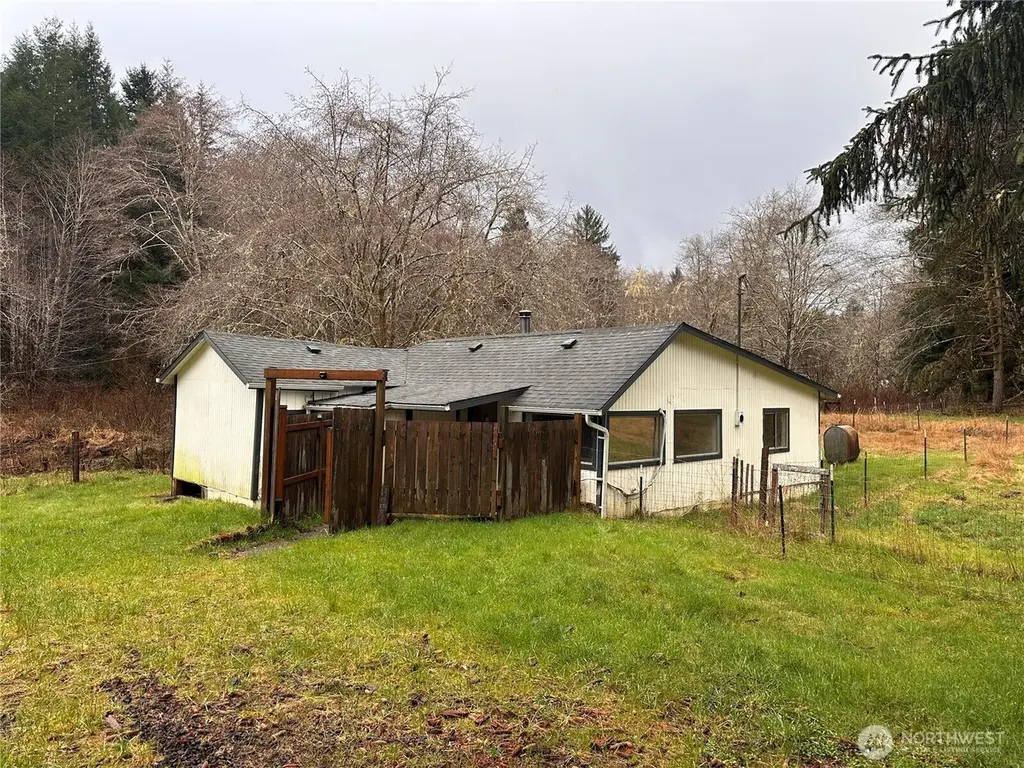
Opportunity awaits on 1.77 acres in Raymond with scenic views of Butte Creek. This property offers 1,131 square feet of living space with three bedrooms and one full bathroom. The home features a spacious living room with a fireplace, along with a combined kitchen and dining area with plenty of storage. All three bedrooms are well-sized, providing comfortable and functional living space. The exterior includes plenty of parking and a storage shed. This is a HUD home being sold as-is and available through electronic bidding.
Key facts
- Plenty of storage
- Plenty of parking
- 1.77 acres
Tags
Property features AI
Finance
- Other: Property type: Residential — Single Family Residence; Living area reported as 1,131 (assessor source); Lot size approximately 1.77 acres; Zoning jurisdiction: County
- Financial info: Listing accepted terms: Cash, Rehab loan
Exterior
- Parking: Driveway; Off-street parking; RV parking
- Utilities: Individual well water; Septic tank; Electric power
- Home design: Single family residence; One-story house; Built on lot; Entry level: main; Facing: unspecified
- Construction: Wood construction; Composition roof; Pillar/Post/Pier foundation; Built year: unspecified
- Exterior features: Wood exterior; Outbuildings; RV parking; On waterfront (creek); Level to rolling topography; Has view
Interior
- Kitchen: Refrigerator; Stove/Range
- Bedrooms: 3 bedrooms (all on main level)
- Flooring: Vinyl flooring
- Bathrooms: 1 full bathroom with bathtub and shower (main level)
- Heating & cooling: Ductless heating; Has cooling; Electric energy source
- Interior features: Wood-burning fireplace; Fireplace in main living area; Kitchen with eating space; Living room; Utility room
- Laundry & utility: Utility room (main level)
Neighborhood map
What this means for you Summary
Snapshot
- This is a 3-bed/1.0-bath single-family listed at $121k.
Deal economics
- At list price, monthly cash flow is $361 ($4k/yr) — positive.
- The deal already cash-flows at list — no discount required.
- Meets the 1% rule at list price ($2k rent vs $121k).
- Recommended offer: $114k (6.0% below list) — sets the bar for market timing.
- Cap rate 10.5% vs local median 4.0% in Raymond — top-decile yield for the area; either an underpriced asset or a hidden risk that comps aren't pricing in. Stress-test before assuming the spread holds.
Location & tenants
- Location reads 72/100 on livability (#212 in WA) — a middle-class / working-renter tenant base. Strengths: crime A+, cost of living A+, housing A+; Watch: schools D+, commute F.
- Raymond School District (rural): math 30% / reading 48% proficiency, ranked #231 of 291 in WA (top 79%) — families likely to look elsewhere, expect single-tenant / working-renter base with shorter leases.
- Market conditions: 91 active listings in the ZIP; 90 units permitted in Pacific County in 2024 (0 in 5+ unit buildings).
Forward outlook
- Local home prices are declining (-3.0%/yr); year-one equity from $837 of loan paydown is wiped out by about $4k of value loss. Plan a longer hold.
- Pacific County population projected at -10% by 2050 — secular population decline; favor cash flow + early exit over multi-decade hold.
- At projected returns (-3.0% appreciation + 3.0% rent growth), your $34k cash investment doubles in ~9 years — after that, you're playing with house money.
Negotiation context
- It's been on market 86 days — a 6% lower offer ($114k) is reasonable based on typical stale-listing flexibility.
- 3 sale attempts since 9y ago; this cycle's ask has dropped $52k (30%) from the opening price — seller is motivated, your offer sets the floor, not the list.
Risks & watch-outs
- Watch-outs: flood insurance adds $66/mo; built in 1930 — expect roof / HVAC / electrical / plumbing capex.
- Climate carrying-cost: severe flood risk — expect insurance premiums to compound above CPI over the hold.
Questions for the listing agent
- It's been on market 86 days. Have you received any prior offers? Is the seller open to a 6% concession, seller financing, or rate buy-down credit?
- Built in 1930 — when were the roof, HVAC, electrical panel, plumbing, and water heater last replaced?
- What's the actual annual flood-insurance premium (NFIP or private), and is the property in a SFHA with mandatory coverage?
- Why hasn't it sold? Are there any deal-killer items the seller is aware of (foundation, flood, title, zoning, code violations)?
- Is there a deadline driving the sale (1031 exchange, divorce, estate, relocation)? That informs how much negotiation room exists.
- Schools are D-rated, which usually means shorter tenancies and higher turnover. Who's the typical renter profile here, and what's been the actual vacancy rate?
- What's the average days-on-market for RENTAL listings here right now (not sales)? A rising rental-DOM trend means longer vacancies and softer asking-rent achievability than the comps imply.
- What's the recent tenant-quality profile in this submarket — average credit score on applications, eviction rate, late-payment / NSF rate, and stable-employment percentage? A property-management company in the area should have these aggregated.
- How much new for-sale + rental construction is in the pipeline within 1–3 miles? Heavy new supply typically softens prices + rents 12–24 months out; constrained supply supports both.
Investment metrics
- 1% rule
- 1.32% ✓
- Cap rate
- 10.53%
- Cash-on-cash
- 15.13%
- DSCR
- 1.67
- GRM
- 6.3
CMA / ARV
No comps found within radius.
Projected returns pro-forma
-3.0% appreciation · 3.0% rent growth · sell at horizon
- IRR
- 2.6%
- Equity multiple
- 1.10×
- Total profit
- $3,427
- Equity at exit
- $18,056
- IRR
- 12.2%
- Equity multiple
- 1.97×
- Total profit
- $32,837
- Equity at exit
- $10,471
Cash invested: $33,908 (down + closing). Projections, not guarantees.
Landlord ↔ Tenant lean methodology
- Overall (STATE)
- 28 Tenant-Leaning
- State Washington
- 28 Tenant-Leaning · D+8
- County
- — inherits STATE
- City
- — inherits STATE
ZIP-level market 98577
- Home prices YoY
- -2.8%
- Active inventory
- 91
- Price-to-rent
- 6.3×
Monthly cashflow live
- Estimated rent
- $1,594 medium interval (Pro) →
- Mortgage (P&I)
- −$635
- Tax from tax record
- −$146 /mo · $1,757/yr
- Insurance
- −$50
- Flood insurance flood zone
- −$66 /mo · $798/yr
- HOA
- −$0
- Vacancy / Maint / Mgmt
- −$335
- Net cashflow
- $361
Break-even live
UW: 25.0% down · 7.5% · 30yr · 1.5% tax · 5.0% vac · 8.0% maint · 8.0% mgmt
Financing live
Cash to close
- Down payment
- $30,275
- Closing costs
- $3,633
- Reserves months
- —
- Total cash needed
- —
Loan-product check · same deal, 3 products live
Conventional
25% down · 7.5% · 30yr
- Down + closing
- —
- Monthly P&I
- —
- Monthly cashflow
- —
- DSCR
- —
- Eligible?
- —
Personal DTI + credit; lowest rate.
DSCR
20% down · 8.5% · 30yr
- Down + closing
- —
- Monthly P&I
- —
- Monthly cashflow
- —
- DSCR
- —
- Eligible?
- —
No personal income docs; deal must DSCR.
Hard money
10% down · 12.0% · 12mo
- Down + closing
- —
- Monthly P&I
- —
- Monthly cashflow
- —
- DSCR
- —
- Eligible?
- —
Short-term bridge; refi at stabilization.
Listing history 24 events
-
2026-06-18days on market $121,100 Active 86 DOM
-
2026-06-17days on market $121,100 Active 85 DOM
-
2026-06-16days on market $121,100 Active 84 DOM
-
2026-06-15days on market $121,100 Active 83 DOM
-
2026-06-15days on market $121,100 Active 82 DOM
-
2026-06-13days on market $121,100 Active 81 DOM
-
2026-06-12days on market $121,100 Active 80 DOM
-
2026-06-09days on market $121,100 Active 77 DOM
-
2026-06-08days on market $121,100 Active 76 DOM
-
2026-06-08pricedays on market $121,100 Active 75 DOM
-
2026-06-05days on market $138,400 Active 73 DOM
-
2026-06-03days on market $138,400 Active 71 DOM
-
2026-06-02days on market $138,400 Active 70 DOM
-
2026-06-01days on market $138,400 Active 69 DOM
-
2026-05-31days on market $138,400 Active 68 DOM
-
2026-05-09price $138,400
-
2026-03-23$173,000 Active
-
2022-07-29soldstatus $249,000 Closed
-
2022-07-29soldstatus $249,000
-
2022-06-05status Pending
-
2022-06-02$249,000 Active
-
2017-04-28soldstatus $115,000 Sold
-
2017-04-12status Pending
-
2017-04-12$154,000 Active
ⓘ Source: listings_history table (triggers on properties + properties_extension) + one-shot
backfill from property_details.listing_events for pre-trigger history.
Tax reassessment forecast WA · Resets to sale price
- Current annual tax
- $1,757 · $146/mo
- Projected year-2 tax
- $1,757 · $146/mo
- Expected delta
- $0/yr ($0/mo · 0.0%)
ⓘ Screening estimate from a state-policy table — verify with the county assessor before closing.
Climate risk First Street
- Flood 8/10 Severe FEMA zone X (unshaded) · 99% chance over 30 yrs
- Wildfire 1/10 Low
- Heat 1/10 Low 7 d/yr ≥83°F today · 14 d/yr by 30 yrs out
- Wind 1/10 Low
- Air quality 6/10 Major 6 unhealthy d/yr today · 7 by 30 yrs out
Nearby sold comps map
Loading sold comps map…
Walkable amenities ~0.75 mi
Loading nearby amenities…
Taxation est. · year 1
- Rental income
- $19,129
- − Mortgage interest
- −$6,783
- − Property taxes
- −$1,757
- − Insurance
- −$1,403
- − Repairs & maintenance
- −$1,530
- − Management
- −$1,530
- − Depreciation
- −$3,523
- Taxable income
- $2,602
- Est. tax owed @ 24.0%
- −$624
- After-tax cash flow
- $3,707/yr
For passive investors: Depreciation is non-cash, so a rental often shows a tax loss while cash-flowing — sheltering income. Rental losses are passive: they offset passive income freely, and up to $25,000/yr can offset ordinary (W-2) income if you actively participate and your MAGI is under $100k (phasing out to $0 by $150k); unused losses carry forward. On sale, claimed depreciation is recaptured at up to 25%, and gains may owe capital-gains tax (a 1031 exchange can defer both). Figures are a year-1 estimate at your 24.0% rate — not tax advice; consult a CPA.
Schools (NCES district)
- District
- Raymond School District
- NCES district ID
- 5307140
- Math proficiency
- 30% ▲ 5.00%
- Reading proficiency
- 48% ▲ 2.00%
- Median HH income
- $38,441
- Composite
- 34.99/100
- National rank
- #9951
- State rank
- #231 of 291 in WA
Livability — Raymond
- Score
- 72/100
- State rank
- #212
- US rank
- #6045
Category grades
Schools grade is shown separately in the Schools card above.
Census & demographics
- Population (ZIP)
- 7,458
Population outlook (Pacific County) Hauer SSP2
- Today (2025)
- 20,636 people
- By 2030
- 20,137 · -2.4%
- By 2040
- 19,041 · -7.7%
- By 2050
- 18,504 · -10.3%
- By 2075
- 17,403 · -15.7%
- By 2100
- 16,241 · -21.3%
Race, ethnicity, and origin ACS 2023
- Neighborhood character
- Predominantly White (78%)
- Race & ethnicity
- White 78% Hispanic / Latino 11% Two or more races 7% Native American 2% Asian 1%
- Hispanic origin (detail)
- Mexican 11%
- Common ancestry
- Portuguese 5% Scotch-Irish 3% Romanian 3%
- Foreign-born
- 7% · Canada, South Korea
- Languages at home
- 89% English-only · Spanish 8% German/W. Germanic 2%
Political lean MEDSL · Pacific
- 2024 margin
- Toss-up / Even · D 48.1% · R 49.4% · Other 2.4%
- 2008→2024 swing
- -15.4pp toward R · 2008: 14.1pp · 2024: -1.3pp
- All cycles
- 2024: R+1.3 2020: R+1.1 2016: R+6.9 2012: D+11.4 2008: D+14.1
Not yet ingested
- Civics
- —
Market trends
- HPI YoY
- ▼ -7.88%
- Current HPI
- 271.0583
- Rent YoY
- —
- Metro
- —
- State GDP YoY
- ▲ 4.65%
- F500 in state
- 22
Industry mix (Fortune 500 HQ in WA)
| Industry | F500 HQs | Revenue |
|---|---|---|
| Retail | 2 | $269B |
|
||
| Technology / Retail | 1 | $638B |
|
||
| Technology | 1 | $245B |
|
||
| Telecommunications | 1 | $38B |
|
||
| Food / Beverage | 1 | $36B |
|
||
| Automotive / Trucks | 1 | $34B |
|
||
Price history
-10.1% since first listed9 events — show timeline
- 2026-05-09 Price Changed $138,400 NWMLS as Distributed by MLS Grid
- 2026-03-23 Listed $173,000 NWMLS as Distributed by MLS Grid
- 2022-07-29 Sold (Public Records) $249,000 Public Records
- 2022-07-29 Sold (MLS) $249,000 NWMLS as Distributed by MLS Grid
- 2022-06-05 Pending — NWMLS as Distributed by MLS Grid
- 2022-06-02 Listed $249,000 NWMLS as Distributed by MLS Grid
- 2017-04-28 Sold (MLS) $115,000 NWMLS as Distributed by MLS Grid
- 2017-04-12 Pending — NWMLS as Distributed by MLS Grid
- 2017-04-12 Listed $154,000 NWMLS as Distributed by MLS Grid
Property tax history
+10.3%/yrLatest (2026): $1,757 · -1.9% YoY. Source: county tax records.
Cash-flow waterfall
monthlySold comps — $/sqft
last 12 mo · ≤1 miLoading sold comps…