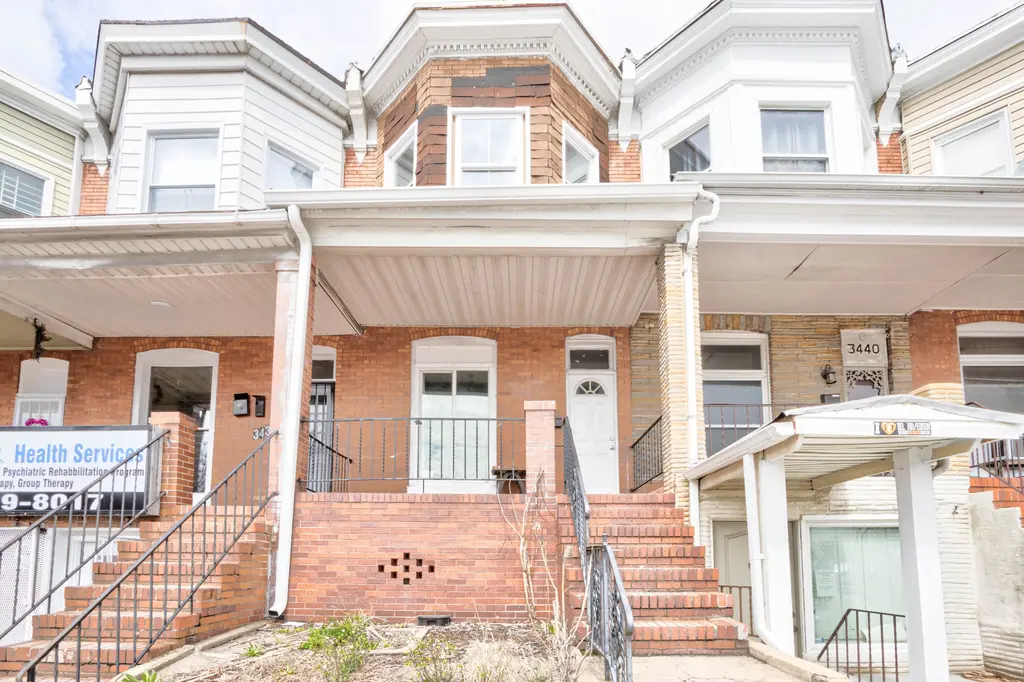
3438 Belair Rd · Baltimore, MD
Flood risk 1/10 · Minimal
- FEMA flood zone
- X (unshaded)
- Chance of flooding over 30 yrs
- 0.0%
- Est. flood insurance / yr
- $473 – $860
Fire risk 1/10 · Minimal
- Est. fire insurance / yr
- $755 – $1,403
Heat risk 8/10 · Major
- Hot days now (above 103°F)
- 7 days/yr
- Hot days in 30 yrs
- 15 days/yr
Wind risk 6/10 · Moderate
- Chance of severe wind over 30 yrs
- 27.0%
Air-quality risk 4/10 · Minor
- Unhealthy air days now
- 6 days/yr
- Unhealthy air days in 30 yrs
- 7 days/yr
Risk factors via First Street. Map © Google.
Why this score? — see what drove the A- grade
The composite is a weighted blend of 9 inputs, each scored 0–100. Each bar is that input's sub-score; the figure is the points it added to the 100-point composite (weight × sub-score).
- Cash flow +30.0/30.0
- ARV discount +15.0/15.0
- 1% rule +10.0/10.0
- DSCR +10.0/10.0
- Appreciation +4.7/10.0
- Rent growth +3.8/5.0
- Livability +3.8/5.0
- Condition / age +2.5/5.0
- Schools +1.0/10.0
$80,000
🖨 Deal sheet (PDF) 📄 Offer letter ✓ Due diligence
Listing remarks
ONLINE AUCTION: This auction takes place on the Ashland Auction Group Website Bidding Platform. Bidding begins 6/25/2026 @ 10:00 AM. Bidding ends 6/29/2026 @ 12:50 PM. List Price is Suggested Opening Bid. Deposit: $15,000. Fully renovated interior townhome located in the Belair-Edison area of Baltimore City. Just minutes from Herring Run Park, Clifton Park Golf Course, Morgan State University, and the Belair Road shopping corridor. Easy access to Belair Road, Erdman Avenue, Sinclair Lane, and I-895. Property features are believed to include a renovated kitchen with granite countertops, stainless steel appliances, updated plumbing, new HVAC, fresh paint, updated flooring, finished basement a
Key facts
- Fresh paint
- New hvac
- Renovated kitchen
Tags
Property features AI
Exterior
- Parking: Detached garage (1 space); On-street parking
- Utilities: Public water; Public sewer; Natural gas hot water; Natural gas heating
- Home design: Interior townhouse/rowhouse; Fee simple ownership
- Construction: Brick construction; Permanent foundation; Built year per assessor
- Exterior features: Lot dimensions approximately 14 x 116; Above-grade and below-grade structures
Interior
- Bedrooms: Three bedrooms on the upper level
- Bathrooms: Two full bathrooms (one on the main level, one on the upper level)
- Heating & cooling: Radiator heat; Central air conditioning
- Interior features: Fully finished basement
Neighborhood map
What this means for you Summary
Snapshot
- This is a 3-bed/2.0-bath townhouse listed at $80k.
Deal economics
- At list price, monthly cash flow is $792 ($9k/yr) — positive.
- The deal already cash-flows at list — no discount required.
- Meets the 1% rule at list price ($2k rent vs $80k).
- Recommended offer: $79k (1.5% below list) — sets the bar for market timing.
- Cap rate 18.2% vs local median 6.0% in Baltimore — top-decile yield for the area; either an underpriced asset or a hidden risk that comps aren't pricing in. Stress-test before assuming the spread holds.
Location & tenants
- Location reads 76/100 on livability (#90 in MD, #3,396 nationally) — a middle-class / working-renter tenant base. Strengths: amenities A+, commute A+, housing A+; Watch: schools D, crime F.
- Baltimore City Public Schools (urban): math 7% / reading 16% proficiency, ranked #24 of 24 in MD (top 100%) — low school quality limits family demand, transient renter base, plan for 1-2y turnover; 79% free/reduced lunch — lower-income household profile, screen leases tightly.
- Market conditions: Rents rising fast (+5.2%/yr); 319 active listings in the ZIP; 40 comparable units currently listed for rent nearby; rentals at typical pace (median 25d on market — plan ~3-4 weeks tenant-placement turnaround); 48% of comp listings sitting > 30 days — soft ceiling on asking rent; 1,273 units permitted in Baltimore city in 2024 (1,104 in 5+ unit buildings).
- This rent runs 44% of the median local income ($51k/yr) — at the standard rent-burdened threshold; future hikes will face affordability resistance.
Forward outlook
- In year one you build about $99 of equity ($553 loan paydown + $-454 appreciation (-0.6% local appreciation)).
- Baltimore County population projected to shrink 4% by 2050 — rents likely to lag national; underwrite the cash flow, not the appreciation.
- At projected returns (-0.6% appreciation + 5.2% rent growth), your $22k cash investment doubles in ~3 years — after that, you're playing with house money.
Negotiation context
- It's been on market 20 days — a 2% lower offer ($79k) is reasonable based on typical stale-listing flexibility.
- 12 sale attempts since 28y ago with the ask held roughly flat each time — persistent listings suggest the price (not the market) is what's stuck; bring a comps-based counter.
Risks & watch-outs
- Watch-outs: property tax is 3.5% of price; built in 1924 — expect roof / HVAC / electrical / plumbing capex.
- Climate carrying-cost: major wind risk, 27% chance of damaging wind over 30y; extreme-heat days projected 7→15/yr by 2055 (HVAC capex compounding) — expect insurance premiums to compound above CPI over the hold.
Questions for the listing agent
- Built in 1924 — when were the roof, HVAC, electrical panel, plumbing, and water heater last replaced?
- Property tax is high relative to price — has the assessment been appealed recently, and will the sale trigger a re-assessment?
- Is there a deadline driving the sale (1031 exchange, divorce, estate, relocation)? That informs how much negotiation room exists.
- Schools are D-rated, which usually means shorter tenancies and higher turnover. Who's the typical renter profile here, and what's been the actual vacancy rate?
- Crime grade is F in this area — have there been break-ins, vandalism, or insurance claims at this property in the last 3 years? What carrier currently insures it and at what premium?
- What's the average days-on-market for RENTAL listings here right now (not sales)? A rising rental-DOM trend means longer vacancies and softer asking-rent achievability than the comps imply.
- What's the recent tenant-quality profile in this submarket — average credit score on applications, eviction rate, late-payment / NSF rate, and stable-employment percentage? A property-management company in the area should have these aggregated.
- How much new for-sale + rental construction is in the pipeline within 1–3 miles? Heavy new supply typically softens prices + rents 12–24 months out; constrained supply supports both.
Investment metrics
- 1% rule
- 2.34% ✓
- Cap rate
- 18.17%
- Cash-on-cash
- 42.41%
- DSCR
- 2.89
- GRM
- 3.6
CMA / ARV
- ARV (median comp)
- $142,176
- List price
- $80,000
- Delta
- 18.87%
- Verdict
- OVERPRICED
- Comps
- 20 within 1.0 mi
Show comp detail 12 sales within ~0.75 mi
| Address | Dist | Beds/Ba | Sqft | Sold | Price | $/sf | Match |
|---|---|---|---|---|---|---|---|
| 2835 Brendan Ave | 0.07mi | 3/1.0 | 1,725 (+5%) | 2mo | $76,500 | $44 | 83 |
| 3444 Belair Rd | 0.01mi | 3/2.0 | 1,428 (-13%) | 2mo | $131,000 | $92 | 76 |
| 3620 Erdman Ave | 0.45mi | 3/2.0 | 1,600 (-3%) | 2mo | $120,000 | $75 | 73 |
| 3914 Eierman Ave | 0.58mi | 3/2.0 | 1,628 (-1%) | 0mo | $128,000 | $79 | 71 |
| 2846 Lake Ave | 0.06mi | 4/2.5 (+1) | 1,455 (-12%) | 2mo | $235,000 | $162 | 69 |
| 4208 Sheldon Ave | 0.54mi | 3/2.0 | 1,680 (+2%) | 2mo | $145,000 | $86 | 69 |
| 3114 Mareco Ave | 0.22mi | 3/2.0 | 1,410 (-14%) | 2mo | $125,000 | $89 | 64 |
| 3401 Ramona Ave | 0.44mi | 3/2.0 | 1,812 (+10%) | 0mo | $199,000 | $110 | 62 |
| 4215 Seidel Ave | 0.65mi | 3/2.0 | 1,528 (-7%) | 2mo | $186,500 | $122 | 57 |
| 3564 Elmora Ave | 0.52mi | 3/1.5 | 1,478 (-10%) | 1mo | $133,500 | $90 | 56 |
| 3406 Ramona Ave | 0.46mi | 3/2.0 | 1,408 (-14%) | 0mo | $85,000 | $60 | 54 |
| 3571 Dudley Ave | 0.56mi | 3/2.0 | 1,400 (-15%) | 1mo | $175,000 | $125 | 48 |
Match score weights: distance 35% · size 25% · config 20% · recency 20%. Top-matched comps best support the ARV.
Projected returns pro-forma
-0.57% appreciation · 5.25% rent growth · sell at horizon
- IRR
- 45.3%
- Equity multiple
- 3.25×
- Total profit
- $50,413
- Equity at exit
- $20,983
- IRR
- 49.9%
- Equity multiple
- 7.07×
- Total profit
- $136,069
- Equity at exit
- $23,493
Cash invested: $22,400 (down + closing). Projections, not guarantees.
Landlord ↔ Tenant lean methodology
- Overall (CITY)
- 12 Strongly Tenant-Friendly
- State Maryland
- 27 Tenant-Leaning · D+14
- County
- — inherits STATE
- City Baltimore
- 12 Strongly Tenant-Friendly · D+58
ZIP-level market 21213
- Home prices YoY
- -0.1%
- Rents YoY
- 5.2%
- Active inventory
- 319
- Price-to-rent
- 3.6×
Monthly cashflow live
- Estimated rent
- $1,873 high interval (Pro) →
- Mortgage (P&I)
- −$420
- Tax from tax record
- −$235 /mo · $2,820/yr
- Insurance
- −$33
- HOA
- −$0
- Vacancy / Maint / Mgmt
- −$393
- Net cashflow
- $792
Break-even live
Sensitivity live
| Price | -10% $837 | -5% $814 | +0% $792 | +5% $769 | +10% $746 |
|---|---|---|---|---|---|
| Rent | -10% $644 | -5% $718 | +0% $792 | +5% $866 | +10% $940 |
| Rate | -1.0pp $832 | -0.5pp $812 | base $792 | +0.5pp $771 | +1.0pp $750 |
UW: 25.0% down · 7.5% · 30yr · 1.5% tax · 5.0% vac · 8.0% maint · 8.0% mgmt
Financing live
Cash to close
- Down payment
- $20,000
- Closing costs
- $2,400
- Reserves months
- —
- Total cash needed
- —
Loan-product check · same deal, 3 products live
Conventional
25% down · 7.5% · 30yr
- Down + closing
- —
- Monthly P&I
- —
- Monthly cashflow
- —
- DSCR
- —
- Eligible?
- —
Personal DTI + credit; lowest rate.
DSCR
20% down · 8.5% · 30yr
- Down + closing
- —
- Monthly P&I
- —
- Monthly cashflow
- —
- DSCR
- —
- Eligible?
- —
No personal income docs; deal must DSCR.
Hard money
10% down · 12.0% · 12mo
- Down + closing
- —
- Monthly P&I
- —
- Monthly cashflow
- —
- DSCR
- —
- Eligible?
- —
Short-term bridge; refi at stabilization.
Rent comps 40 comps
| Address | Beds | Baths | Sqft | Rent | $/sqft | DOM | Units | Dist |
|---|---|---|---|---|---|---|---|---|
| 2828 Lake Ave Baltimore, MD | 3.0 | 2.0 | 1164 | $1,850 | $1.59 | 5d | 1 | 0.09mi |
| 2837 Pelham Ave Baltimore, MD | 4.0 | 2.0 | 1164 | $1,675 | $1.44 | 44d | 1 | 0.14mi |
| 3436 Cardenas Ave Baltimore, MD | 2.0 | 1.0 | 1146 | $1,395 | $1.22 | 44d | 1 | 0.14mi |
| 2848 Pelham Ave Baltimore, MD | 3.0 | 2.0 | 1164 | $1,700 | $1.46 | 44d | 1 | 0.15mi |
| 2817 Pelham Ave Baltimore, MD | 3.0 | 2.0 | 1464 | $1,950 | $1.33 | 24d | 1 | 0.16mi |
| 3515 Parklawn Ave Baltimore, MD | 3.0 | 2.0 | 1240 | $1,700 | $1.37 | 3d | 1 | 0.20mi |
| 3028 Kenyon Ave Baltimore, MD | 2.0 | 2.0 | 1075 | $1,395 | $1.30 | 44d | 1 | 0.24mi |
| 2735 Chesterfield Ave Baltimore, MD | 3.0 | 2.5 | 1536 | $2,000 | $1.30 | 11d | 1 | 0.25mi |
| 3027 Shannon Dr Baltimore, MD | 3.0 | 2.0 | 1950 | $2,500 | $1.28 | 44d | 1 | 0.27mi |
| 3005 Belair Rd Baltimore, MD | 3.0 | 2.0 | 2000 | $1,600 | $0.80 | 18d | 1 | 0.30mi |
| 3305 Dudley Ave Baltimore, MD | 3.0 | 2.0 | 1413 | $1,950 | $1.38 | 44d | 1 | 0.37mi |
| 3300 Dudley Ave Baltimore, MD | 4.0 | 2.0 | 1724 | $2,200 | $1.28 | 44d | 1 | 0.39mi |
| 3519 Kentucky Ave Baltimore, MD | 3.0 | 2.0 | 1536 | $2,100 | $1.37 | 11d | 1 | 0.42mi |
| 3551 Elmley Ave Baltimore, MD | 3.0 | 1.5 | 1872 | $2,095 | $1.12 | 24d | 1 | 0.42mi |
| 3610 Elmley Ave Baltimore, MD | 2.0 | 1.5 | 1200 | $1,550 | $1.29 | 21d | 1 | 0.42mi |
| 3525 Kentucky Ave Baltimore, MD | 3.0 | 1.5 | 1536 | $1,950 | $1.27 | 44d | 1 | 0.42mi |
| 3512 Elmora Ave Baltimore, MD | 3.0 | 1.5 | 1472 | $1,900 | $1.29 | 21d | 1 | 0.49mi |
| 3544 Chesterfield Ave Baltimore, MD | 3.0 | 1.5 | 1200 | $1,635 | $1.36 | 44d | 1 | 0.49mi |
| 3572 Juneway Unit 1 Baltimore, MD | 2.0 | 1.0 | 1800 | $1,200 | $0.67 | 44d | 1 | 0.50mi |
| 3335 Lyndale Ave Baltimore, MD | 2.0 | 2.0 | 1344 | $1,600 | $1.19 | 24d | 1 | 0.51mi |
| 4244 Shamrock Ave Baltimore, MD | 3.0 | 1.5 | 1920 | $1,850 | $0.96 | 24d | 1 | 0.53mi |
| 3213 Elmley Ave Baltimore, MD | 2.0 | 1.0 | 1188 | $1,395 | $1.17 | 44d | 1 | 0.53mi |
| 3326 Elmora Ave Baltimore, MD | 3.0 | 1.0 | 1200 | $1,450 | $1.21 | 24d | 1 | 0.53mi |
| 3222 Lyndale Ave Unit 1 Baltimore, MD | 3.0 | 1.5 | 1500 | $2,200 | $1.47 | 13d | 1 | 0.54mi |
| 3551 Shannon Dr Baltimore, MD | 3.0 | 2.0 | 1485 | $2,358 | $1.59 | 24d | 1 | 0.59mi |
| 4320 Sheldon Ave Baltimore, MD | 3.0 | 1.5 | 1280 | $1,800 | $1.41 | 24d | 1 | 0.59mi |
| 4024 Eierman Ave Baltimore, MD | 3.0 | 2.0 | 1136 | $1,825 | $1.61 | 44d | 1 | 0.59mi |
| 3603 Ravenwood Ave Unit 1 Baltimore, MD | 4.0 | 1.0 | 1566 | $1,600 | $1.02 | 44d | 1 | 0.60mi |
| 3573 Shannon Dr Baltimore, MD | 4.0 | 2.0 | 1493 | $2,300 | $1.54 | 18d | 1 | 0.61mi |
| 3914 Erdman Ave #1 Baltimore, MD | 3.0 | 1.0 | 1200 | $1,319 | $1.10 | 18d | 1 | 0.62mi |
| 2113 Belair Rd Baltimore, MD | 3.0 | 1.0 | 1344 | $1,795 | $1.34 | 44d | 1 | 0.62mi |
| 4400 Asbury Ave Baltimore, MD | 3.0 | 2.0 | 1270 | $1,995 | $1.57 | 5d | 1 | 0.63mi |
| 4104 Erdman Ave Unit 2 Baltimore, MD | 2.0 | 1.0 | 1566 | $1,075 | $0.69 | 5d | 1 | 0.67mi |
| 4116 Raymonn Ave Baltimore, MD | 3.0 | 1.5 | 1244 | $1,950 | $1.57 | 44d | 1 | 0.88mi |
| 1832 E 28th St Baltimore, MD | 3.0 | 1.0 | 1066 | $1,495 | $1.40 | 24d | 1 | 0.95mi |
| 4300 Orchard Ridge Blvd Baltimore, MD | 1.0–3.0 | 1.0–2.0 | 1021 | $1,809 | $1.77 | 44d | 1 | 0.98mi |
| 1829 N Port St Baltimore, MD | 3.0 | 1.5 | 2000 | $1,625 | $0.81 | 44d | 1 | 0.99mi |
| 1802 E 28th St Baltimore, MD | 3.0 | 1.0 | 1300 | $1,600 | $1.23 | 24d | 1 | 0.99mi |
| 2522 E Federal St Baltimore, MD | 2.0 | 2.0 | 1760 | $1,400 | $0.80 | 44d | 1 | 1.08mi |
| 1702 E 32nd St Baltimore, MD | 3.0 | 2.0 | 1344 | $2,300 | $1.71 | 44d | 1 | 1.10mi |
Listing history 49 events
-
2026-06-18days on market $80,000 Active 20 DOM
-
2026-06-17days on market $80,000 Active 19 DOM
-
2026-06-16days on market $80,000 Active 18 DOM
-
2026-06-15days on market $80,000 Active 17 DOM
-
2026-06-13days on market $80,000 Active 15 DOM
-
2026-06-09days on market $80,000 Active 11 DOM
-
2026-06-08days on market $80,000 Active 10 DOM
-
2026-06-07days on market $80,000 Active 9 DOM
-
2026-06-04days on market $80,000 Active 6 DOM
-
2026-06-03days on market $80,000 Active 5 DOM
-
2026-06-02days on market $80,000 Active 4 DOM
-
2026-06-01days on market $80,000 Active 3 DOM
-
2026-05-31days on market $80,000 Active 2 DOM
-
2026-04-21price $169,000 990-char remark
-
2026-04-01status Active 990-char remark
-
2026-03-24historical 990-char remark
-
2026-03-21$179,000 Active 990-char remark
-
2026-03-12historical $179,000 990-char remark
-
2026-03-03historical $1,850
-
2026-01-05historical
-
2025-11-20price $174,000
-
2025-11-12price $179,000
-
2025-09-24price $182,000
-
2024-10-30$187,000 Active
-
2024-07-05$1,850
-
2024-07-05historical
-
2024-06-13price $169,500
-
2024-05-01price $174,500
-
2024-04-24price $179,500
-
2024-04-19price $184,500
-
2024-04-05$189,500 Active
-
2022-06-22soldstatus $103,000
-
2021-07-11historical
-
2021-05-27$109,000 Active
-
2021-04-02historical Active Under Contract
-
2021-02-05price $104,900
-
2020-12-19$113,000 Active
-
2019-09-30historical
-
2019-08-28price $75,000
-
2019-08-22$110,000 Active
-
2005-03-23soldstatus $54,600
-
2001-02-15historical
-
2000-08-02
-
2000-08-02historical
-
2000-05-19
-
1999-02-28soldstatus $22,500
-
1999-01-19historical
-
1998-11-25$27,800
-
1996-07-23soldstatus $45,000
ⓘ Source: listings_history table (triggers on properties + properties_extension) + one-shot
backfill from property_details.listing_events for pre-trigger history.
Tax reassessment forecast MD · Partial reset (capped growth)
- Current annual tax
- $2,820 · $235/mo
- Projected year-2 tax
- $2,820 · $235/mo
- Expected delta
- $0/yr ($0/mo · 0.0%)
ⓘ Screening estimate from a state-policy table — verify with the county assessor before closing.
Climate risk First Street
- Flood 1/10 Low FEMA zone X (unshaded) · 0% chance over 30 yrs
- Wildfire 1/10 Low
- Heat 8/10 Severe 7 d/yr ≥103°F today · 15 d/yr by 30 yrs out
- Wind 6/10 Major 27% chance of damaging wind over 30 yrs
- Air quality 4/10 Moderate 6 unhealthy d/yr today · 7 by 30 yrs out
Nearby sold comps map
Loading sold comps map…
Walkable amenities ~0.75 mi
Loading nearby amenities…
Taxation est. · year 1
- Rental income
- $22,473
- − Mortgage interest
- −$4,481
- − Property taxes
- −$2,820
- − Insurance
- −$400
- − Repairs & maintenance
- −$1,798
- − Management
- −$1,798
- − Depreciation
- −$2,327
- Taxable income
- $8,849
- Est. tax owed @ 24.0%
- −$2,124
- After-tax cash flow
- $7,376/yr
For passive investors: Depreciation is non-cash, so a rental often shows a tax loss while cash-flowing — sheltering income. Rental losses are passive: they offset passive income freely, and up to $25,000/yr can offset ordinary (W-2) income if you actively participate and your MAGI is under $100k (phasing out to $0 by $150k); unused losses carry forward. On sale, claimed depreciation is recaptured at up to 25%, and gains may owe capital-gains tax (a 1031 exchange can defer both). Figures are a year-1 estimate at your 24.0% rate — not tax advice; consult a CPA.
Schools (NCES district)
- District
- Baltimore City Public Schools
- NCES district ID
- 2400090
- Math proficiency
- 7% ▼ -9.00%
- Reading proficiency
- 16% ▼ -5.00%
- Median HH income
- $42,108
- Composite
- 10.08/100
- National rank
- #9805
- State rank
- #24 of 24 in MD
Livability — Baltimore
- Score
- 76/100
- State rank
- #90
- US rank
- #3396
Category grades
Schools grade is shown separately in the Schools card above.
Census & demographics
- Census place
- Baltimore, MD
- County
- Baltimore City · 558,601 people
- City population
- 588,727
- Metro
- Baltimore-Columbia-Towson, MD
- Population (ZIP)
- 28,058
- Household income
- $51,344
- Rent vs Own
- Severe rent burden
- 1868.0
Population outlook (Baltimore County) Hauer SSP2
- Today (2025)
- 624,249 people
- By 2030
- 621,541 · -0.4%
- By 2040
- 609,756 · -2.3%
- By 2050
- 597,249 · -4.3%
- By 2075
- 552,236 · -11.5%
- By 2100
- 513,934 · -17.7%
Race, ethnicity, and origin ACS 2023
- Neighborhood character
- Predominantly Black (86%)
- Race & ethnicity
- Black 86% White 6% Hispanic / Latino 4% Two or more races 3%
- Foreign-born
- 3% · Canada
- Languages at home
- 96% English-only · Spanish 3%
Political lean MEDSL · Baltimore
- 2024 margin
- Solid D (+73.0) · D 85.2% · R 12.2% · Other 2.6%
- 2008→2024 swing
- -2.5pp toward R · 2008: 75.5pp · 2024: 73.0pp
- All cycles
- 2024: D+73.0 2020: D+76.6 2016: D+74.6 2012: D+76.4 2008: D+75.5
Not yet ingested
- Civics
- —
Market trends
- HPI YoY
- ▼ -0.57%
- Current HPI
- 427.4453
- Rent YoY
- ▲ 5.25%
- Metro
- Baltimore-Columbia-Towson, MD
- State GDP YoY
- ▲ 2.97%
- F500 in state
- 12
Industry mix (Fortune 500 HQ in MD)
| Industry | F500 HQs | Revenue |
|---|---|---|
| Aerospace / Defense | 1 | $71B |
|
||
| Utilities | 1 | $25B |
|
||
| Hotels | 1 | $24B |
|
||
| Consumer Goods | 1 | $7B |
|
||
| Real Estate | 1 | $6B |
|
||
| Chemicals | 1 | $2B |
|
||
Price history
+77.8% since first listed38 events — show timeline
- 2026-05-29 Listed $80,000 BRIGHT MLS
- 2026-05-28 Listing Removed — BRIGHT MLS
- 2026-04-21 Price Changed $169,000 BRIGHT MLS
- 2026-04-01 Relisted — BRIGHT MLS
- 2026-03-24 Listing Removed — BRIGHT MLS
- 2026-03-21 Listed $179,000 BRIGHT MLS
- 2026-03-12 Coming Soon — BRIGHT MLS
- 2026-03-03 Rental Removed $1,850 REDFIN
- 2026-01-05 Listing Removed — BRIGHT MLS
- 2025-11-20 Price Changed $174,000 BRIGHT MLS
- 2025-11-12 Price Changed $179,000 BRIGHT MLS
- 2025-09-24 Price Changed $182,000 BRIGHT MLS
- 2024-10-30 Listed $187,000 BRIGHT MLS
- 2024-07-05 Listed for Rent $1,850 REDFIN
- 2024-07-05 Listing Removed — BRIGHT MLS
- 2024-06-13 Price Changed $169,500 BRIGHT MLS
- 2024-05-01 Price Changed $174,500 BRIGHT MLS
- 2024-04-24 Price Changed $179,500 BRIGHT MLS
- 2024-04-19 Price Changed $184,500 BRIGHT MLS
- 2024-04-05 Listed $189,500 BRIGHT MLS
- 2022-06-22 Sold (Public Records) $103,000 Public Records
- 2021-07-11 Listing Removed — BRIGHT MLS
- 2021-05-27 Listed $109,000 BRIGHT MLS
- 2021-04-02 Contingent — BRIGHT MLS
- 2021-02-05 Price Changed $104,900 BRIGHT MLS
- 2020-12-19 Listed $113,000 BRIGHT MLS
- 2019-09-30 Listing Removed — BRIGHT MLS
- 2019-08-28 Price Changed $75,000 BRIGHT MLS
- 2019-08-22 Listed $110,000 BRIGHT MLS
- 2005-03-23 Sold (Public Records) $54,600 Public Records
- 2001-02-15 Delisted — MRIS
- 2000-08-02 Delisted — MRIS
- 2000-08-02 Listed — MRIS
- 2000-05-19 Listed — MRIS
- 1999-02-28 Sold (MLS) $22,500 MRIS
- 1999-01-19 Delisted — MRIS
- 1998-11-25 Listed $27,800 MRIS
- 1996-07-23 Sold (Public Records) $45,000 Public Records
Property tax history
-0.1%/yrLatest (2025): $2,820 · +12.3% YoY. Source: county tax records.
Cash-flow waterfall
monthlySold comps — $/sqft
last 12 mo · ≤1 miLoading sold comps…