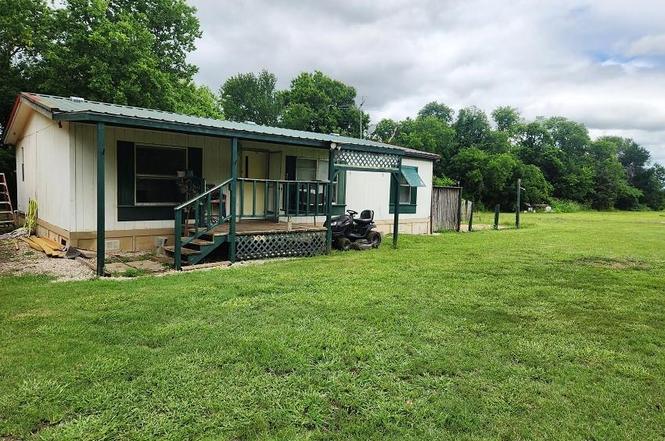
1664 County Road 4925 · Trenton, TX
Flood risk No data
- FEMA flood zone
- —
- Chance of flooding over 30 yrs
- —
- Est. flood insurance / yr
- —
Fire risk No data
- Est. fire insurance / yr
- —
Heat risk No data
- Hot days now (above threshold)
- —
- Hot days in 30 yrs
- —
Wind risk No data
- Chance of severe wind over 30 yrs
- —
Air-quality risk No data
- Unhealthy air days now
- —
- Unhealthy air days in 30 yrs
- —
Risk factors via First Street. Map © Google.
Why this score? — see what drove the C- grade
The composite is a weighted blend of 9 inputs, each scored 0–100. Each bar is that input's sub-score; the figure is the points it added to the 100-point composite (weight × sub-score).
- Cash flow +14.8/30.0
- Appreciation +10.0/10.0
- ARV discount +7.5/15.0
- DSCR +4.5/10.0
- 1% rule +3.3/10.0
- Schools +3.1/10.0
- Livability +3.0/5.0
- Rent growth +2.5/5.0
- Condition / age +2.5/5.0
$249,900
🖨 Deal sheet 📄 Offer letter ✓ Due diligence
Listing remarks
Beautiful 2.054 acres with a 30X50 Shop, concrete floor, engine lift, ceiling is insulated, with electric, 16X8 storage room within. Car port in front of workshop. Attached awning on the side. 1999 Doublewide, 1176 sq ft, 3 bedrooms with 2 baths can be lived in while dream home is built. 12X12X8 out building being built for extra storage. Lots of potential out of the City Limits. Sheep on premises in a large fenced in area. Can go with property sale. No Known Restrictions. Make an Appointment and Come out and take a look around.
Key facts
- Car port
- 16x8 storage room
- Engine lift
Tags
Property features AI
Finance
- Other: No known restrictions; Possession at closing/funding or subject to lease; Survey available
- HOA & community: No homeowners association
Exterior
- Parking: Attached garage with 4 spaces; Covered parking for 4 vehicles; 2-car carport; Gravel parking area; Workshop space in the garage
- Utilities: Aerobic septic; Co-op electric; Co-op water; Outside city limits
- Home design: Single-family residence; One story
- Construction: Built in 1999; Metal roof; Block foundation
- Exterior features: Storage; Other exterior features; Acreage lot (about 2.05 acres)
Interior
- Kitchen: Dishwasher; Disposal; Electric range; Refrigerator; Electric water heater
- Bedrooms: 3 bedrooms on the main level (including a primary bedroom)
- Bathrooms: 2 full bathrooms
- Heating & cooling: Central heating (electric); Window cooling units
- Interior features: Eat-in kitchen; One living area; One dining area; Room count: 5
- Laundry & utility: Full-size washer/dryer area; Electric dryer hookup; Utility room
Neighborhood map
What this means for you Summary
Snapshot
- This is a 3-bed/2.0-bath manufactured listed at $250k.
Deal economics
- At list price, monthly cash flow is $70 ($846/yr) — positive.
- The deal already cash-flows at list — no discount required.
- To meet the 1% rule (rent ≥ 1% of price), the offer needs to be $207k (17.2% below list).
- Recommended offer: $207k (17.2% below list) — sets the bar for 1% rule.
- Cap rate 6.6% vs local median 2.7% in Trenton — top-decile yield for the area; either an underpriced asset or a hidden risk that comps aren't pricing in. Stress-test before assuming the spread holds.
Location & tenants
- Location reads 59/100 on livability (#1,108 in TX) — a working-class tenant base; expect higher turnover. Strengths: cost of living A+, housing A+, employment B+; Watch: crime D, amenities F, commute F.
- Trenton ISD (rural): math 27% / reading 43% proficiency, ranked #483 of 826 in TX (top 58%) — families likely to look elsewhere, expect single-tenant / working-renter base with shorter leases.
- Zoned schools: Trenton El (math 22% / reading 32%, grade F, #2,791 of 4,322 statewide, top 68%, 299 students, 46% FRL).
- Market conditions: 165 active listings in the ZIP; 82 units permitted in Fannin County in 2024 (0 in 5+ unit buildings).
Forward outlook
- In year one you build about $27k of equity ($2k loan paydown + $25k appreciation (10.0% local appreciation)).
- Fannin County population projected to shrink 6% by 2050 — rents likely to lag national; underwrite the cash flow, not the appreciation.
- At projected returns (10.0% appreciation + 3.0% rent growth), your $70k cash investment doubles in ~3 years — after that, you're playing with house money.
- By year 2, paydown + projected appreciation supports a ~$43k cash-out refi (75% LTV) — recoverable capital for the next deal without selling this one.
Negotiation context
- Only 4 days on market — expect competitive offers; lowballing is unlikely to land.
Questions for the listing agent
- Is there a deadline driving the sale (1031 exchange, divorce, estate, relocation)? That informs how much negotiation room exists.
- Crime grade is D in this area — have there been break-ins, vandalism, or insurance claims at this property in the last 3 years? What carrier currently insures it and at what premium?
- What's the average days-on-market for RENTAL listings here right now (not sales)? A rising rental-DOM trend means longer vacancies and softer asking-rent achievability than the comps imply.
- What's the recent tenant-quality profile in this submarket — average credit score on applications, eviction rate, late-payment / NSF rate, and stable-employment percentage? A property-management company in the area should have these aggregated.
- How much new for-sale + rental construction is in the pipeline within 1–3 miles? Heavy new supply typically softens prices + rents 12–24 months out; constrained supply supports both.
Investment metrics
- 1% rule
- 0.83% ✗
- Cap rate
- 6.63%
- Cash-on-cash
- 1.21%
- DSCR
- 1.05
- GRM
- 10.1
CMA / ARV
No comps found within radius.
Projected returns pro-forma
10.0% appreciation · 3.0% rent growth · sell at horizon
- IRR
- 25.1%
- Equity multiple
- 3.01×
- Total profit
- $140,523
- Equity at exit
- $225,130
- IRR
- 22.2%
- Equity multiple
- 6.86×
- Total profit
- $410,147
- Equity at exit
- $485,501
Cash invested: $69,972 (down + closing). Projections, not guarantees.
Landlord ↔ Tenant lean methodology
- Overall (STATE)
- 87 Strongly Landlord-Friendly
- State Texas
- 87 Strongly Landlord-Friendly · R+5
- County
- — inherits STATE
- City
- — inherits STATE
ZIP-level market 75490
- Home prices YoY
- 5.6%
- Active inventory
- 165
- Price-to-rent
- 10.1×
Monthly cashflow live
- Estimated rent
- $2,068 medium interval (Pro) →
- Mortgage (P&I)
- −$1,311
- Tax from tax record
- −$149 /mo · $1,787/yr
- Insurance
- −$104
- HOA
- −$0
- Vacancy / Maint / Mgmt
- −$434
- Net cashflow
- $70
Break-even live
UW: 25.0% down · 7.5% · 30yr · 1.5% tax · 5.0% vac · 8.0% maint · 8.0% mgmt
Financing live
Cash to close
- Down payment
- $62,475
- Closing costs
- $7,497
- Reserves months
- —
- Total cash needed
- —
Loan-product check · same deal, 3 products live
Conventional
25% down · 7.5% · 30yr
- Down + closing
- —
- Monthly P&I
- —
- Monthly cashflow
- —
- DSCR
- —
- Eligible?
- —
Personal DTI + credit; lowest rate.
DSCR
20% down · 8.5% · 30yr
- Down + closing
- —
- Monthly P&I
- —
- Monthly cashflow
- —
- DSCR
- —
- Eligible?
- —
No personal income docs; deal must DSCR.
Hard money
10% down · 12.0% · 12mo
- Down + closing
- —
- Monthly P&I
- —
- Monthly cashflow
- —
- DSCR
- —
- Eligible?
- —
Short-term bridge; refi at stabilization.
Listing history 5 events
-
2026-06-18days on market $249,900 Active 4 DOM
-
2026-06-17days on market $249,900 Active 3 DOM
-
2026-06-16days on market $249,900 Active 2 DOM
-
2026-06-15remarks 534-char remark
-
2026-06-15$249,900 Active 1 DOM
ⓘ Source: listings_history table (triggers on properties + properties_extension) + one-shot
backfill from property_details.listing_events for pre-trigger history.
Tax reassessment forecast TX · Resets to sale price
- Current annual tax
- $1,787 · $149/mo
- Projected year-2 tax
- $4,573 · $381/mo
- Expected delta
- +$2,786/yr (+$232/mo · 155.9%)
ⓘ Screening estimate from a state-policy table — verify with the county assessor before closing.
Nearby sold comps map
Loading sold comps map…
Walkable amenities ~0.75 mi
Loading nearby amenities…
Taxation est. · year 1
- Rental income
- $24,821
- − Mortgage interest
- −$13,998
- − Property taxes
- −$1,787
- − Insurance
- −$1,250
- − Repairs & maintenance
- −$1,986
- − Management
- −$1,986
- − Depreciation
- −$7,270
- Taxable loss
- −$3,455
- Est. tax savings @ 24.0%
- +$829
- After-tax cash flow
- $1,675/yr
For passive investors: Depreciation is non-cash, so a rental often shows a tax loss while cash-flowing — sheltering income. Rental losses are passive: they offset passive income freely, and up to $25,000/yr can offset ordinary (W-2) income if you actively participate and your MAGI is under $100k (phasing out to $0 by $150k); unused losses carry forward. On sale, claimed depreciation is recaptured at up to 25%, and gains may owe capital-gains tax (a 1031 exchange can defer both). Figures are a year-1 estimate at your 24.0% rate — not tax advice; consult a CPA.
Schools (NCES district)
- District
- Trenton ISD
- NCES district ID
- 4843140
- Math proficiency
- 27% ▼ -16.00%
- Reading proficiency
- 43% ▼ -11.00%
- Median HH income
- $61,383
- Composite
- 31.38/100
- National rank
- #5993
- State rank
- #483 of 826 in TX
Livability — Trenton
- Score
- 59/100
- State rank
- #1108
- US rank
- #19614
Category grades
Schools grade is shown separately in the Schools card above.
Census & demographics
- Population (ZIP)
- 3,024
Population outlook (Fannin County) Hauer SSP2
- Today (2025)
- 33,423 people
- By 2030
- 33,035 · -1.2%
- By 2040
- 32,250 · -3.5%
- By 2050
- 31,462 · -5.9%
- By 2075
- 29,447 · -11.9%
- By 2100
- 25,459 · -23.8%
Race, ethnicity, and origin ACS 2023
- Neighborhood character
- Predominantly White (84%)
- Race & ethnicity
- White 84% Hispanic / Latino 10% Two or more races 8% Black 5%
- Hispanic origin (detail)
- Mexican 8%
- Common ancestry
- Slovak 1%
- Foreign-born
- 3% · Canada, Dominican Republic
- Languages at home
- 95% English-only · Spanish 5%
Political lean MEDSL · Fannin
- 2024 margin
- Solid R (+67.4) · D 15.9% · R 83.3%
- 2008→2024 swing
- -27.8pp toward R · 2008: -39.6pp · 2024: -67.4pp
- All cycles
- 2024: R+67.4 2020: R+63.4 2016: R+61.9 2012: R+52.5 2008: R+39.6
Not yet ingested
- Civics
- —
Market trends
- HPI YoY
- ▲ 16.09%
- Current HPI
- 301.2127
- Rent YoY
- —
- Metro
- —
- State GDP YoY
- ▲ 3.95%
- F500 in state
- 110
Industry mix (Fortune 500 HQ in TX)
| Industry | F500 HQs | Revenue |
|---|---|---|
| Energy | 16 | $1,198B |
|
||
| Technology | 5 | $198B |
|
||
| Engineering / Construction | 4 | $72B |
|
||
| Energy Services | 3 | $60B |
|
||
| Utilities | 3 | $41B |
|
||
| Healthcare | 2 | $330B |
|
||
Price history
4 events — show timeline
- 2026-06-14 Listed $249,900 NTREIS
- 2026-01-30 Sold (Public Records) — Public Records
- 2018-04-06 Sold (Public Records) — Public Records
- 2004-03-31 Sold (Public Records) — Public Records
Property tax history
+5.8%/yrLatest (2025): $1,787 · +4.7% YoY. Source: county tax records.
Cash-flow waterfall
monthlySold comps — $/sqft
last 12 mo · ≤1 miLoading sold comps…