 Duplex
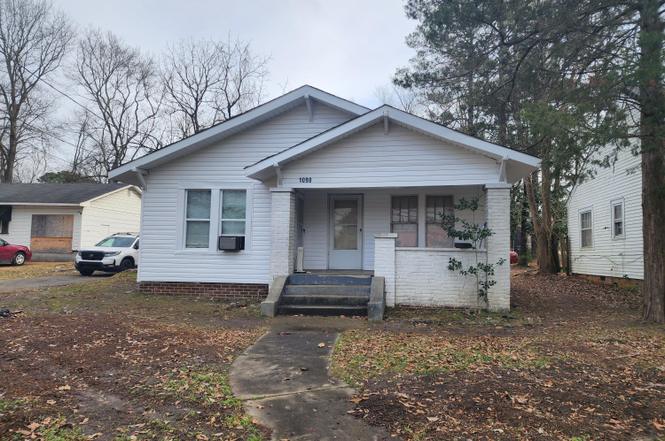
1098 N Royal St · Jackson, TN
Flood risk 1/10 · Minimal
- FEMA flood zone
- X (unshaded)
- Chance of flooding over 30 yrs
- 0.0%
- Est. flood insurance / yr
- $507 – $1,088
Fire risk 1/10 · Minimal
- Est. fire insurance / yr
- $949 – $1,763
Heat risk 6/10 · Moderate
- Hot days now (above 108°F)
- 7 days/yr
- Hot days in 30 yrs
- 20 days/yr
Wind risk 4/10 · Minor
- Chance of severe wind over 30 yrs
- 16.0%
Air-quality risk 1/10 · Minimal
- Unhealthy air days now
- 0 days/yr
- Unhealthy air days in 30 yrs
- 0 days/yr
Risk factors via First Street. Map © Google.
Why this score? — see what drove the B+ grade
The composite is a weighted blend of 9 inputs, each scored 0–100. Each bar is that input's sub-score; the figure is the points it added to the 100-point composite (weight × sub-score).
- Cash flow +30.0/30.0
- ARV discount +15.0/15.0
- 1% rule +10.0/10.0
- DSCR +10.0/10.0
- Rent growth +3.8/5.0
- Livability +3.1/5.0
- Condition / age +2.5/5.0
- Schools +1.2/10.0
- Appreciation +0.0/10.0
$89,000
🖨 Deal sheet 📄 Offer letter ✓ Due diligence
Multi-family units
County records classify this as Multi-Family (2-4 Unit). Listing-text estimate: 2 units. confirmed
Listing remarks
Attention all investors. Duplex with 1 bedroom and 1 bathroom in each unit. Roof installed 2024. Vinyl siding installed 2026. Long term tenants in place. There is another building on the property that easily can be 1-2 bedrooms that needs to be finished. Work has already been started. MUST HAVE APPOINTMENT. 24 Hour notice required!
Key facts
- Roof installed
- 0.28 acre lot
- 4 parking spots
Tags
Property features AI
Finance
- Financial info: Two rental units (total rent reported $1,200; actual rent listed as $600 per unit)
Exterior
- Parking: 4 outdoor parking spaces
- Utilities: Public water; Public sewer; Electricity connected
- Home design: Duplex residential income property; One-level / single-story
- Construction: Vinyl siding
- Exterior features: Covered front porch; Guest house on the property; Road frontage on a city street; Publicly maintained road access
Interior
- Kitchen: Refrigerator
- Flooring: Hardwood floors; Linoleum; Vinyl flooring
- Bathrooms: 2 bathrooms
- Interior features: Refrigerator included
Neighborhood map
What this means for you Summary
Snapshot
- This is a 2 × 1-bed/1.0-bath units multifamily listed at $89k.
Deal economics
- At list price, monthly cash flow is $1k ($13k/yr) — positive. Per door: $555/mo.
- The deal already cash-flows at list — no discount required.
- Meets the 1% rule at list price ($2k rent vs $89k).
- Recommended offer: $81k (9.0% below list) — sets the bar for market timing.
- Cap rate 21.3% vs local median 3.5% in Jackson — top-decile yield for the area; either an underpriced asset or a hidden risk that comps aren't pricing in. Stress-test before assuming the spread holds.
Location & tenants
- Location reads 62/100 on livability (#216 in TN) — a middle-class / working-renter tenant base. Strengths: cost of living A+, housing A+; Watch: health & safety C-, schools F, crime F.
- Madison County (urban): math 10% / reading 17% proficiency, ranked #131 of 139 in TN (top 94%) — low school quality limits family demand, transient renter base, plan for 1-2y turnover; 68% free/reduced lunch — lower-income household profile, screen leases tightly.
- Market conditions: Rents rising fast (+5.2%/yr); 253 active listings in the ZIP; 2 comparable units currently listed for rent nearby; lower-income renter base — watch delinquency; 247 units permitted in Madison County in 2024 (0 in 5+ unit buildings).
- At $2,112/mo this rent would consume 59% of the median local household income ($43k/yr) (locally 1701% of renters already pay >50% of income on rent) — very limited rent-growth headroom before tenants either downsize or default.
Forward outlook
- Local home prices are declining (-3.0%/yr); year-one equity from $615 of loan paydown is wiped out by about $3k of value loss. Plan a longer hold.
- Madison County population projected at -12% by 2050 — secular population decline; favor cash flow + early exit over multi-decade hold.
- At projected returns (-3.0% appreciation + 5.2% rent growth), your $25k cash investment doubles in ~3 years — after that, you're playing with house money.
Negotiation context
- It's been on market 120 days — a 9% lower offer ($81k) is reasonable based on typical stale-listing flexibility.
- Current owner paid $40k; list at $89k implies a 123% gain — meaningful room to come down on a strong offer.
Risks & watch-outs
- Watch-outs: built in 1929 — expect roof / HVAC / electrical / plumbing capex.
- Climate carrying-cost: extreme-heat days projected 7→20/yr by 2055 (HVAC capex compounding) — expect insurance premiums to compound above CPI over the hold.
Questions for the listing agent
- It's been on market 120 days. Have you received any prior offers? Is the seller open to a 9% concession, seller financing, or rate buy-down credit?
- Can we see the unit-by-unit rent roll, current vacancy, and any below-market leases? What's the average tenancy length?
- What capital expenditures (roof, boiler, parking lot, exteriors) have been made in the last 5 years, and what's planned in the next 2?
- Built in 1929 — when were the roof, HVAC, electrical panel, plumbing, and water heater last replaced?
- Why hasn't it sold? Are there any deal-killer items the seller is aware of (foundation, flood, title, zoning, code violations)?
- Is there a deadline driving the sale (1031 exchange, divorce, estate, relocation)? That informs how much negotiation room exists.
- Schools are F-rated, which usually means shorter tenancies and higher turnover. Who's the typical renter profile here, and what's been the actual vacancy rate?
- Crime grade is F in this area — have there been break-ins, vandalism, or insurance claims at this property in the last 3 years? What carrier currently insures it and at what premium?
- What's the average days-on-market for RENTAL listings here right now (not sales)? A rising rental-DOM trend means longer vacancies and softer asking-rent achievability than the comps imply.
- What's the recent tenant-quality profile in this submarket — average credit score on applications, eviction rate, late-payment / NSF rate, and stable-employment percentage? A property-management company in the area should have these aggregated.
- How much new apartment / multifamily construction is in the pipeline within 1–3 miles? Heavy new supply (>2% of stock underway) typically softens rents 12–24 months out; light construction supports rent growth.
Investment metrics
- 1% rule
- 2.37% ✓
- Cap rate
- 21.27%
- Cash-on-cash
- 53.48%
- DSCR
- 3.38
- GRM
- 3.5
CMA / ARV
- ARV (on-the-fly)
- $128,160
- Comps found
- 4
Show comp detail 4 sales within ~0.75 mi
| Address | Dist | Beds/Ba | Sqft | Sold | Price | $/sf | Match |
|---|---|---|---|---|---|---|---|
| 1098 N Royal St | 0.00mi | —/12.0 | 1,602 (0%) | 0mo | $75,000 | $47 | 80 |
| 217 Walnut Street St | 0.65mi | 2/2.0 | 1,467 (-8%) | 13mo | $143,000 | $97 | 45 |
| 220 Division Ave | 0.75mi | —/— | 1,470 (-8%) | 13mo | $55,000 | $37 | 41 |
| 120 Laconte St | 0.73mi | 6/2.0 | 1,767 (+10%) | 16mo | $141,667 | $80 | 36 |
Match score weights: distance 35% · size 25% · config 20% · recency 20%. Top-matched comps best support the ARV.
Projected returns pro-forma
-3.0% appreciation · 5.19% rent growth · sell at horizon
- IRR
- 54.0%
- Equity multiple
- 3.45×
- Total profit
- $61,059
- Equity at exit
- $13,270
- IRR
- 59.9%
- Equity multiple
- 7.61×
- Total profit
- $164,639
- Equity at exit
- $7,695
Cash invested: $24,920 (down + closing). Projections, not guarantees.
Landlord ↔ Tenant lean methodology
- Overall (STATE)
- 87 Strongly Landlord-Friendly
- State Tennessee
- 87 Strongly Landlord-Friendly · R+13
- County
- — inherits STATE
- City
- — inherits STATE
ZIP-level market 38301
- Rents YoY
- 5.2%
- Active inventory
- 253
- Price-to-rent
- 7.0×
Monthly cashflow live
- Estimated rent
- $2,112 medium interval (Pro) →
- Mortgage (P&I)
- −$467
- Tax from tax record
- −$54 /mo · $650/yr
- Insurance
- −$37
- HOA
- −$0
- Vacancy / Maint / Mgmt
- −$444
- Net cashflow
- $1,111
Break-even live
2-unit breakdown (identical units grouped — click to expand)
| Units | Beds | Baths | Est. rent |
|---|---|---|---|
| 2× units | 1 | 1 | $2,112 |
| #1 | 1 | 1 | $1,056 |
| #2 | 1 | 1 | $1,056 |
| Total (2 units) | $2,112 | ||
UW: 25.0% down · 7.5% · 30yr · 1.5% tax · 5.0% vac · 8.0% maint · 8.0% mgmt
Financing live
Cash to close
- Down payment
- $22,250
- Closing costs
- $2,670
- Reserves months
- —
- Total cash needed
- —
Loan-product check · same deal, 3 products live
Conventional
25% down · 7.5% · 30yr
- Down + closing
- —
- Monthly P&I
- —
- Monthly cashflow
- —
- DSCR
- —
- Eligible?
- —
Personal DTI + credit; lowest rate.
DSCR
20% down · 8.5% · 30yr
- Down + closing
- —
- Monthly P&I
- —
- Monthly cashflow
- —
- DSCR
- —
- Eligible?
- —
No personal income docs; deal must DSCR.
Hard money
10% down · 12.0% · 12mo
- Down + closing
- —
- Monthly P&I
- —
- Monthly cashflow
- —
- DSCR
- —
- Eligible?
- —
Short-term bridge; refi at stabilization.
Rent comps 2 comps
| Address | Beds | Baths | Sqft | Rent | $/sqft | DOM | Units | Dist |
|---|---|---|---|---|---|---|---|---|
| 102 Jackson Walk Plz Jackson, TN | 1.0–3.0 | 1.0–2.5 | 1082 | $1,868 | $1.73 | 43d | 1 | 1.25mi |
| 100 Parkridge Dr Jackson, TN | 1.0–3.0 | 1.0–2.0 | 1085 | $1,237 | $1.14 | 43d | 10 | 1.43mi |
Listing history 6 events
-
2026-05-09status Pending
-
2026-03-30price $89,000
-
2026-03-12price $99,000
-
2026-01-26price $109,900
-
2026-01-10$119,900 Active
-
2017-08-03soldstatus $40,000
ⓘ Source: listings_history table (triggers on properties + properties_extension) + one-shot
backfill from property_details.listing_events for pre-trigger history.
Tax reassessment forecast TN · Resets to sale price
- Current annual tax
- $650 · $54/mo
- Projected year-2 tax
- $650 · $54/mo
- Expected delta
- $0/yr ($0/mo · 0.0%)
ⓘ Screening estimate from a state-policy table — verify with the county assessor before closing.
Climate risk First Street
- Flood 1/10 Low FEMA zone X (unshaded) · 0% chance over 30 yrs
- Wildfire 1/10 Low
- Heat 6/10 Major 7 d/yr ≥108°F today · 20 d/yr by 30 yrs out
- Wind 4/10 Moderate 16% chance of damaging wind over 30 yrs
- Air quality 1/10 Low 0 unhealthy d/yr today · 0 by 30 yrs out
Nearby sold comps map
Loading sold comps map…
Walkable amenities ~0.75 mi
Loading nearby amenities…
Taxation est. · year 1
- Rental income
- $25,344
- − Mortgage interest
- −$4,985
- − Property taxes
- −$650
- − Insurance
- −$445
- − Repairs & maintenance
- −$2,028
- − Management
- −$2,028
- − Depreciation
- −$2,589
- Taxable income
- $12,619
- Est. tax owed @ 24.0%
- −$3,029
- After-tax cash flow
- $10,297/yr
For passive investors: Depreciation is non-cash, so a rental often shows a tax loss while cash-flowing — sheltering income. Rental losses are passive: they offset passive income freely, and up to $25,000/yr can offset ordinary (W-2) income if you actively participate and your MAGI is under $100k (phasing out to $0 by $150k); unused losses carry forward. On sale, claimed depreciation is recaptured at up to 25%, and gains may owe capital-gains tax (a 1031 exchange can defer both). Figures are a year-1 estimate at your 24.0% rate — not tax advice; consult a CPA.
Schools (NCES district)
- District
- Madison County
- NCES district ID
- 4702580
- Math proficiency
- 10% ▼ -11.00%
- Reading proficiency
- 17% ▼ -4.00%
- Median HH income
- $42,015
- Composite
- 11.74/100
- National rank
- #9687
- State rank
- #131 of 139 in TN
Livability — Jackson
- Score
- 62/100
- State rank
- #216
- US rank
- #16488
Category grades
Schools grade is shown separately in the Schools card above.
Census & demographics
- Census place
- Jackson, TN
- County
- Madison County · 87,024 people
- City population
- 87,024
- Metro
- Jackson, TN
- Population (ZIP)
- 33,536
- Household income
- $43,227
- Rent vs Own
- Severe rent burden
- 1701.0
Population outlook (Madison County) Hauer SSP2
- Today (2025)
- 95,952 people
- By 2030
- 94,264 · -1.8%
- By 2040
- 89,607 · -6.6%
- By 2050
- 84,133 · -12.3%
- By 2075
- 72,215 · -24.7%
- By 2100
- 62,062 · -35.3%
Race, ethnicity, and origin ACS 2023
- Neighborhood character
- Diverse neighborhood (Simpson 0.57)
- Race & ethnicity
- Black 50% White 42% Two or more races 5% Hispanic / Latino 4%
- Common ancestry
- Slovak 1% Serbian 1% Portuguese 1%
- Foreign-born
- 3% · Canada
- Languages at home
- 96% English-only · Spanish 3%
Political lean MEDSL · Madison
- 2024 margin
- R (+18.2) · D 40.3% · R 58.5% · Other 1.2%
- 2008→2024 swing
- +3.4pp toward D · 2008: -21.6pp · 2024: -18.2pp
- All cycles
- 2024: R+18.2 2020: R+12.9 2016: R+15.6 2012: R+8.9 2008: R+21.6
Not yet ingested
- Civics
- —
Market trends
- HPI YoY
- ▼ -112.26%
- Current HPI
- 162.2273
- Rent YoY
- ▲ 5.19%
- Metro
- Jackson, TN
- State GDP YoY
- ▲ 2.78%
- F500 in state
- 22
Industry mix (Fortune 500 HQ in TN)
| Industry | F500 HQs | Revenue |
|---|---|---|
| Healthcare | 3 | $91B |
|
||
| Retail | 3 | $72B |
|
||
| Transportation / Logistics | 1 | $88B |
|
||
| Paper / Packaging | 1 | $19B |
|
||
| Insurance | 1 | $13B |
|
||
| Energy | 1 | $12B |
|
||
Price history
+122.5% since first listed6 events — show timeline
- 2026-05-09 Pending — CWTAR
- 2026-03-30 Price Changed $89,000 CWTAR
- 2026-03-12 Price Changed $99,000 CWTAR
- 2026-01-26 Price Changed $109,900 CWTAR
- 2026-01-10 Listed $119,900 CWTAR
- 2017-08-03 Sold (Public Records) $40,000 Public Records
Property tax history
+1.7%/yrLatest (2025): $650 · +0.2% YoY. Source: county tax records.
Cash-flow waterfall
monthlySold comps — $/sqft
last 12 mo · ≤1 miLoading sold comps…