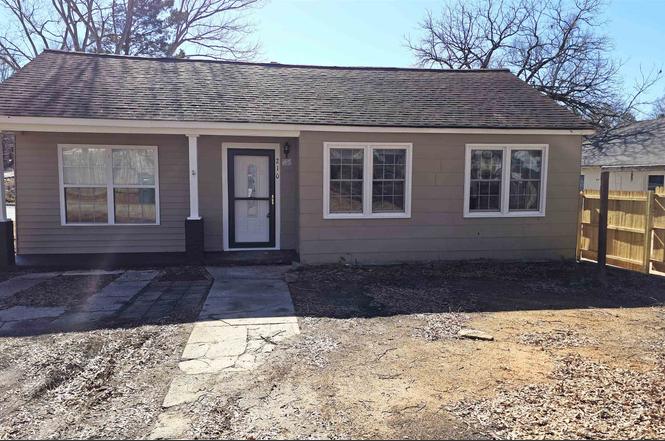
210 James St · Union, SC
Flood risk 1/10 · Minimal
- FEMA flood zone
- X (unshaded)
- Chance of flooding over 30 yrs
- 0.0%
- Est. flood insurance / yr
- $507 – $1,088
Fire risk 4/10 · Minor
- Est. fire insurance / yr
- $783 – $1,453
Heat risk 6/10 · Moderate
- Hot days now (above 107°F)
- 7 days/yr
- Hot days in 30 yrs
- 16 days/yr
Wind risk 4/10 · Minor
- Chance of severe wind over 30 yrs
- 12.0%
Air-quality risk 2/10 · Minimal
- Unhealthy air days now
- 1 days/yr
- Unhealthy air days in 30 yrs
- 2 days/yr
Risk factors via First Street. Map © Google.
Why this score? — see what drove the D grade
The composite is a weighted blend of 9 inputs, each scored 0–100. Each bar is that input's sub-score; the figure is the points it added to the 100-point composite (weight × sub-score).
- Cash flow +18.1/30.0
- ARV discount +7.5/15.0
- DSCR +5.7/10.0
- 1% rule +3.8/10.0
- Livability +2.6/5.0
- Rent growth +2.5/5.0
- Condition / age +2.5/5.0
- Schools +2.3/10.0
- Appreciation +0.0/10.0
$121,250
🖨 Deal sheet (PDF) 📄 Offer letter ✓ Due diligence
Listing remarks
Charming Cottage on a quiet street! This adorable 3 Bedroom 1 Bath Home has been recently renovated and is ready for a new owner to call it home. From the moment you step in the homes welcoming and cavernous Greatroom you will feel right at home. The main living area is spacious with some built in shelves and has plenty of room for both funiture and guest; it is not only large enough to entertain without feeling cramped but also still feels cozy and warm. Just through the french doors is a welcoming dinning space that connects to the Galley Style kitchen that provides ample cabinets and freshly done custom epoxy countertops. The real show stopper is out the back door where you will find lar
Key facts
- Built in shelves
- 14x10 deck
- Galley style kitchen
Tags
Property features AI
Exterior
- Utilities: Public water; Public sewer
- Home design: Single-family residence; One-story
- Construction: Slab foundation
- Exterior features: Deck; Porch; Level, wooded lot; Lot dimensions approximately 52 x 100 x 51 x 111
Interior
- Flooring: Carpet; Hardwood; Vinyl
- Bathrooms: 1 full bathroom
- Heating & cooling: Heat pump for heating and cooling
- Interior features: Gas water heater
- Laundry & utility: Main-level laundry closet with washer and electric dryer hookups
Neighborhood map
What this means for you Summary
Snapshot
- This is a 3-bed/1.0-bath other listed at $121k.
Deal economics
- At list price, monthly cash flow is $105 ($1k/yr) — positive.
- The deal already cash-flows at list — no discount required.
- To meet the 1% rule (rent ≥ 1% of price), the offer needs to be $107k (12.0% below list).
- Recommended offer: $107k (12.0% below list) — sets the bar for 1% rule.
- Cap rate 7.3% vs local median 2.9% in Union — top-decile yield for the area; either an underpriced asset or a hidden risk that comps aren't pricing in. Stress-test before assuming the spread holds.
Location & tenants
- Location reads 52/100 on livability (#359 in SC) — a working-class tenant base; expect higher turnover. Strengths: cost of living A+, housing A; Watch: crime F, amenities F, commute F.
- Union 01 (town): math 23% / reading 33% proficiency, ranked #60 of 80 in SC (top 75%) — low school quality limits family demand, transient renter base, plan for 1-2y turnover; 64% free/reduced lunch — lower-income household profile, screen leases tightly.
- Zoned schools: Foster Park Elementary (math 23% / reading 23%, grade F, #469 of 597 statewide, top 79%, 456 students, 100% FRL); Sims Middle (math 14% / reading 25%, grade F, #182 of 229 statewide, top 80%, 672 students, 100% FRL); Union County High (math 31% / reading 71%, grade D+, #148 of 196 statewide, top 76%, 1,069 students, 100% FRL) — zoned schools average 100% FRL vs 64% district-wide (36 pts higher); higher-poverty schools than district average — tighter screening recommended.
- Market conditions: 124 active listings in the ZIP; 57 units permitted in Union County in 2024 (0 in 5+ unit buildings).
Forward outlook
- Local home prices are declining (-3.0%/yr); year-one equity from $838 of loan paydown is wiped out by about $4k of value loss. Plan a longer hold.
- Union County population projected at -28% by 2050 — secular population decline; favor cash flow + early exit over multi-decade hold.
Negotiation context
- It's been on market 92 days — a 9% lower offer ($110k) is reasonable based on typical stale-listing flexibility.
- 2 sale attempts with the ask held roughly flat each time — persistent listings suggest the price (not the market) is what's stuck; bring a comps-based counter.
Risks & watch-outs
- Watch-outs: built in 1930 — expect roof / HVAC / electrical / plumbing capex.
- Climate carrying-cost: extreme-heat days projected 7→16/yr by 2055 (HVAC capex compounding) — expect insurance premiums to compound above CPI over the hold.
Questions for the listing agent
- It's been on market 92 days. Have you received any prior offers? Is the seller open to a 12% concession, seller financing, or rate buy-down credit?
- Built in 1930 — when were the roof, HVAC, electrical panel, plumbing, and water heater last replaced?
- Why hasn't it sold? Are there any deal-killer items the seller is aware of (foundation, flood, title, zoning, code violations)?
- Is there a deadline driving the sale (1031 exchange, divorce, estate, relocation)? That informs how much negotiation room exists.
- Schools are F-rated, which usually means shorter tenancies and higher turnover. Who's the typical renter profile here, and what's been the actual vacancy rate?
- Crime grade is F in this area — have there been break-ins, vandalism, or insurance claims at this property in the last 3 years? What carrier currently insures it and at what premium?
- The area grade is low — what's the realistic commute time and amenity access for the typical tenant pool here? Any planned neighborhood developments (good or bad) we should know about?
- What's the average days-on-market for RENTAL listings here right now (not sales)? A rising rental-DOM trend means longer vacancies and softer asking-rent achievability than the comps imply.
- What's the recent tenant-quality profile in this submarket — average credit score on applications, eviction rate, late-payment / NSF rate, and stable-employment percentage? A property-management company in the area should have these aggregated.
- How much new for-sale + rental construction is in the pipeline within 1–3 miles? Heavy new supply typically softens prices + rents 12–24 months out; constrained supply supports both.
Investment metrics
- 1% rule
- 0.88% ✗
- Cap rate
- 7.34%
- Cash-on-cash
- 3.73%
- DSCR
- 1.17
- GRM
- 9.5
CMA / ARV
No comps found within radius.
Projected returns pro-forma
-3.0% appreciation · 3.0% rent growth · sell at horizon
- IRR
- -10.5%
- Equity multiple
- 0.62×
- Total profit
- $-12,975
- Equity at exit
- $18,079
- IRR
- -1.2%
- Equity multiple
- 0.92×
- Total profit
- $-2,834
- Equity at exit
- $10,483
Cash invested: $33,950 (down + closing). Projections, not guarantees.
Landlord ↔ Tenant lean methodology
- Overall (STATE)
- 90 Strongly Landlord-Friendly
- State South Carolina
- 90 Strongly Landlord-Friendly · R+6
- County
- — inherits STATE
- City
- — inherits STATE
ZIP-level market 29379
- Home prices YoY
- -31.6%
- Active inventory
- 124
- Price-to-rent
- 9.5×
Monthly cashflow live
- Estimated rent
- $1,067 medium interval (Pro) →
- Mortgage (P&I)
- −$636
- Tax from tax record
- −$51 /mo · $610/yr
- Insurance
- −$51
- HOA
- −$0
- Vacancy / Maint / Mgmt
- −$224
- Net cashflow
- $105
Break-even live
Sensitivity live
| Price | -10% $174 | -5% $140 | +0% $105 | +5% $71 | +10% $37 |
|---|---|---|---|---|---|
| Rent | -10% $21 | -5% $63 | +0% $105 | +5% $148 | +10% $190 |
| Rate | -1.0pp $167 | -0.5pp $136 | base $105 | +0.5pp $74 | +1.0pp $42 |
UW: 25.0% down · 7.5% · 30yr · 1.5% tax · 5.0% vac · 8.0% maint · 8.0% mgmt
Financing live
Cash to close
- Down payment
- $30,312
- Closing costs
- $3,638
- Reserves months
- —
- Total cash needed
- —
Loan-product check · same deal, 3 products live
Conventional
25% down · 7.5% · 30yr
- Down + closing
- —
- Monthly P&I
- —
- Monthly cashflow
- —
- DSCR
- —
- Eligible?
- —
Personal DTI + credit; lowest rate.
DSCR
20% down · 8.5% · 30yr
- Down + closing
- —
- Monthly P&I
- —
- Monthly cashflow
- —
- DSCR
- —
- Eligible?
- —
No personal income docs; deal must DSCR.
Hard money
10% down · 12.0% · 12mo
- Down + closing
- —
- Monthly P&I
- —
- Monthly cashflow
- —
- DSCR
- —
- Eligible?
- —
Short-term bridge; refi at stabilization.
Listing history 18 events
-
2026-06-21days on market $121,250 Active 92 DOM
-
2026-06-19days on market $121,250 Active 90 DOM
-
2026-06-18days on market $121,250 Active 89 DOM
-
2026-06-17days on market $121,250 Active 88 DOM
-
2026-06-17status $121,250 Active 87 DOM
-
2026-06-07statusdays on market $121,250 Pending 87 DOM
-
2026-06-05days on market $121,250 Active 86 DOM
-
2026-06-03days on market $121,250 Active 85 DOM
-
2026-06-02days on market $121,250 Active 84 DOM
-
2026-06-01days on market $121,250 Active 83 DOM
-
2026-05-31days on market $121,250 Active 82 DOM
-
2026-05-30days on market $121,250 Active 81 DOM
-
2026-05-11price $121,250
-
2026-03-10$124,900 Active
-
2026-01-13price $124,900
-
2025-10-27price $132,500
-
2025-04-10price $142,500
-
2025-01-30$149,900 Active
ⓘ Source: listings_history table (triggers on properties + properties_extension) + one-shot
backfill from property_details.listing_events for pre-trigger history.
Tax reassessment forecast SC · Resets to sale price
- Current annual tax
- $610 · $51/mo
- Projected year-2 tax
- $691 · $58/mo
- Expected delta
- +$81/yr (+$7/mo · 13.3%)
ⓘ Screening estimate from a state-policy table — verify with the county assessor before closing.
Climate risk First Street
- Flood 1/10 Low FEMA zone X (unshaded) · 0% chance over 30 yrs
- Wildfire 4/10 Moderate
- Heat 6/10 Major 7 d/yr ≥107°F today · 16 d/yr by 30 yrs out
- Wind 4/10 Moderate 12% chance of damaging wind over 30 yrs
- Air quality 2/10 Low 1 unhealthy d/yr today · 2 by 30 yrs out
Nearby sold comps map
Loading sold comps map…
Walkable amenities ~0.75 mi
Loading nearby amenities…
Taxation est. · year 1
- Rental income
- $12,801
- − Mortgage interest
- −$6,792
- − Property taxes
- −$610
- − Insurance
- −$606
- − Repairs & maintenance
- −$1,024
- − Management
- −$1,024
- − Depreciation
- −$3,527
- Taxable loss
- −$783
- Est. tax savings @ 24.0%
- +$188
- After-tax cash flow
- $1,454/yr
For passive investors: Depreciation is non-cash, so a rental often shows a tax loss while cash-flowing — sheltering income. Rental losses are passive: they offset passive income freely, and up to $25,000/yr can offset ordinary (W-2) income if you actively participate and your MAGI is under $100k (phasing out to $0 by $150k); unused losses carry forward. On sale, claimed depreciation is recaptured at up to 25%, and gains may owe capital-gains tax (a 1031 exchange can defer both). Figures are a year-1 estimate at your 24.0% rate — not tax advice; consult a CPA.
Schools (NCES district)
- District
- Union 01
- NCES district ID
- 4503750
- Math proficiency
- 23% ▼ -9.00%
- Reading proficiency
- 33% ▬ 0.00%
- Median HH income
- $34,709
- Composite
- 23.05/100
- National rank
- #7971
- State rank
- #60 of 80 in SC
Livability — Union
- Score
- 52/100
- State rank
- #359
- US rank
- #25100
Category grades
Schools grade is shown separately in the Schools card above.
Census & demographics
- Census place
- Union, SC
- Population (ZIP)
- 17,580
Population outlook (Union County) Hauer SSP2
- Today (2025)
- 25,518 people
- By 2030
- 24,099 · -5.6%
- By 2040
- 21,133 · -17.2%
- By 2050
- 18,314 · -28.2%
- By 2075
- 13,235 · -48.1%
- By 2100
- 9,565 · -62.5%
Race, ethnicity, and origin ACS 2023
- Neighborhood character
- Majority White (62%)
- Race & ethnicity
- White 62% Black 31% Two or more races 5% Hispanic / Latino 2%
- Common ancestry
- Lithuanian 1% Serbian 1% Slovak 1%
- Foreign-born
- 1% · Canada
- Languages at home
- 98% English-only · Spanish 1%
Political lean MEDSL · Union
- 2024 margin
- Solid R (+32.7) · D 33.2% · R 65.9%
- 2008→2024 swing
- -21.5pp toward R · 2008: -11.2pp · 2024: -32.7pp
- All cycles
- 2024: R+32.7 2020: R+24.5 2016: R+19.3 2012: R+6.5 2008: R+11.2
Not yet ingested
- Civics
- —
Market trends
- HPI YoY
- ▼ -72.94%
- Current HPI
- 158.1075
- Rent YoY
- —
- Metro
- —
- State GDP YoY
- ▲ 4.51%
- F500 in state
- 2
Industry mix (Fortune 500 HQ in SC)
| Industry | F500 HQs | Revenue |
|---|---|---|
| Packaging | 1 | $7B |
|
||
Price history
-19.1% since first listed6 events — show timeline
- 2026-05-11 Price Changed $121,250 SPMLS
- 2026-03-10 Listed $124,900 SPMLS
- 2026-01-13 Price Changed $124,900 SPMLS
- 2025-10-27 Price Changed $132,500 SPMLS
- 2025-04-10 Price Changed $142,500 SPMLS
- 2025-01-30 Listed $149,900 SPMLS
Property tax history
+9.4%/yrLatest (2025): $610 · +7.2% YoY. Source: county tax records.
Cash-flow waterfall
monthlySold comps — $/sqft
last 12 mo · ≤1 miLoading sold comps…