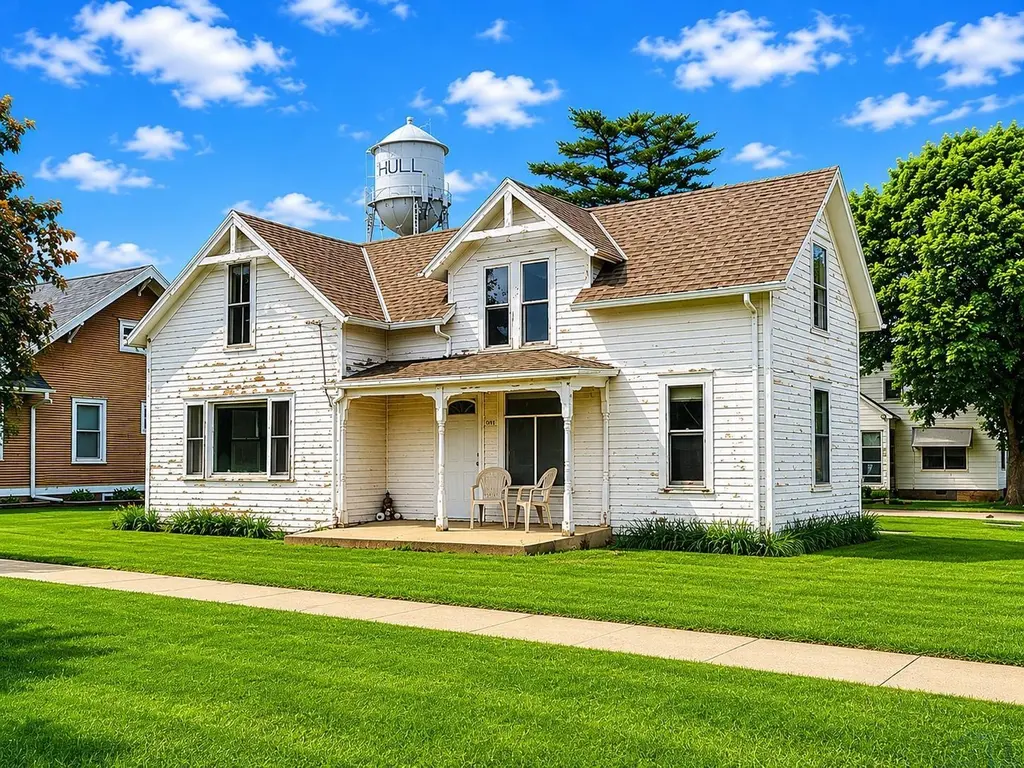
1025 2nd St · Hull, IA
Flood risk 1/10 · Minimal
- FEMA flood zone
- X (unshaded)
- Chance of flooding over 30 yrs
- 0.0%
- Est. flood insurance / yr
- $473 – $860
Fire risk 1/10 · Minimal
- Est. fire insurance / yr
- $902 – $1,676
Heat risk 3/10 · Minor
- Hot days now (above 101°F)
- 7 days/yr
- Hot days in 30 yrs
- 15 days/yr
Wind risk 2/10 · Minimal
- Chance of severe wind over 30 yrs
- —
Air-quality risk 2/10 · Minimal
- Unhealthy air days now
- 0 days/yr
- Unhealthy air days in 30 yrs
- 1 days/yr
Risk factors via First Street. Map © Google.
Why this score? — see what drove the B grade
The composite is a weighted blend of 9 inputs, each scored 0–100. Each bar is that input's sub-score; the figure is the points it added to the 100-point composite (weight × sub-score).
- Cash flow +30.0/30.0
- 1% rule +10.0/10.0
- DSCR +10.0/10.0
- ARV discount +7.5/15.0
- Schools +5.9/10.0
- Livability +4.2/5.0
- Rent growth +2.5/5.0
- Condition / age +2.5/5.0
- Appreciation +0.0/10.0
$65,000
🖨 Deal sheet (PDF) 📄 Offer letter ✓ Due diligence
Listing remarks
Opportunity awaits with this 4-bedroom, 1-bath handyman special offering 1,253 sq. ft. of potential! This home is being sold "AS-IS" and is ready for someone with vision to make it their own. Features include half of a shared garage plus a garden shed for extra storage. Whether you’re looking for an investment property, fixer-upper, or project home, this could be the perfect chance to build equity!
Key facts
- Investment property
- Shared garage
- Garden shed
Tags
Property features AI
Exterior
- Parking: Detached concrete garage with 1 garage space
- Utilities: Public water; Public sewer
- Home design: Single-family residence; Residential property
- Construction: Wood siding
- Exterior features: Shingle roof; Lot is approximately 0.14 acres; Zoned residential
Interior
- Bathrooms: 1 full bathroom
- Heating & cooling: Natural gas forced air heating; Window air conditioning units
- Interior features: Master suite on the main level
- Laundry & utility: Main-level laundry
Neighborhood map
What this means for you Summary
Snapshot
- This is a 4-bed/1.0-bath single-family listed at $65k.
Deal economics
- At list price, monthly cash flow is $544 ($7k/yr) — positive.
- The deal already cash-flows at list — no discount required.
- Meets the 1% rule at list price ($1k rent vs $65k).
- Recommended offer: $64k (1.5% below list) — sets the bar for market timing.
Location & tenants
- Location reads 83/100 on livability (#38 in IA, #1,018 nationally) — a professional / high-income tenant draw. Strengths: crime A+, cost of living A+, housing A+; Watch: amenities F, commute F.
- Boyden-Hull Community School District (rural): math 69% / reading 68% proficiency, ranked #150 of 289 in IA (top 52%) — acceptable for families but not a draw, mixed tenant base, ~2y average lease.
- Zoned schools: Boyden-Hull Elementary School (math 72% / reading 62%, grade B+, #273 of 616 statewide, top 51%, 312 students, 38% FRL); Boyden-Hull High School (math 68% / reading 72%, grade B+, #146 of 336 statewide, top 45%, 291 students, 39% FRL) — zoned schools average 38% FRL vs 23% district-wide (15 pts higher); higher-poverty schools than district average — tighter screening recommended.
- Market conditions: 8 active listings in the ZIP; 201 units permitted in Sioux County in 2024 (52 in 5+ unit buildings).
Forward outlook
- Local home prices are declining (-3.0%/yr); year-one equity from $449 of loan paydown is wiped out by about $2k of value loss. Plan a longer hold.
- Sioux County population projected at +6% by 2050 — modest demand growth; plan on rents tracking national, not racing it.
- At projected returns (-3.0% appreciation + 3.0% rent growth), your $18k cash investment doubles in ~4 years — after that, you're playing with house money.
Negotiation context
- It's been on market 26 days — a 2% lower offer ($64k) is reasonable based on typical stale-listing flexibility.
Risks & watch-outs
- Watch-outs: built in 1905 — expect roof / HVAC / electrical / plumbing capex.
Questions for the listing agent
- Built in 1905 — when were the roof, HVAC, electrical panel, plumbing, and water heater last replaced?
- Is there a deadline driving the sale (1031 exchange, divorce, estate, relocation)? That informs how much negotiation room exists.
- Schools are A-rated — typically a magnet for longer-tenancy family renters. What's the average tenant stay here, and is there a school-zone premium baked into asking?
- What's the average days-on-market for RENTAL listings here right now (not sales)? A rising rental-DOM trend means longer vacancies and softer asking-rent achievability than the comps imply.
- What's the recent tenant-quality profile in this submarket — average credit score on applications, eviction rate, late-payment / NSF rate, and stable-employment percentage? A property-management company in the area should have these aggregated.
- How much new for-sale + rental construction is in the pipeline within 1–3 miles? Heavy new supply typically softens prices + rents 12–24 months out; constrained supply supports both.
Investment metrics
- 1% rule
- 2.00% ✓
- Cap rate
- 16.34%
- Cash-on-cash
- 35.88%
- DSCR
- 2.60
- GRM
- 4.2
CMA / ARV
- ARV (on-the-fly)
- $185,444
- Comps found
- 9
Show comp detail 9 sales within ~0.75 mi
| Address | Dist | Beds/Ba | Sqft | Sold | Price | $/sf | Match |
|---|---|---|---|---|---|---|---|
| 1219 3rd St | 0.15mi | 4/1.0 | 1,242 (-1%) | 3mo | $105,000 | $85 | 89 |
| 1415 Locust St | 0.22mi | 3/1.0 (-1) | 1,270 (+1%) | 8mo | $75,500 | $59 | 76 |
| 1210 Elm St | 0.16mi | 3/2.0 (-1) | 1,251 (-0%) | 12mo | $185,000 | $148 | 73 |
| 1208 2nd St | 0.11mi | 3/1.0 (-1) | 1,128 (-10%) | 1mo | $200,000 | $177 | 72 |
| 1608 1st St | 0.40mi | 4/2.0 | 1,300 (+4%) | 10mo | $200,000 | $154 | 62 |
| 1326 3rd St | 0.22mi | 3/1.0 (-1) | 1,332 (+6%) | 16mo | $150,000 | $113 | 61 |
| 1214 2nd St | 0.13mi | 3/2.0 (-1) | 1,414 (+13%) | 3mo | $216,000 | $153 | 61 |
| 1313 4th St | 0.23mi | 3/2.5 (-1) | 1,372 (+10%) | 10mo | $260,500 | $190 | 54 |
| 1215 Division St | 0.27mi | 3/1.0 (-1) | 1,165 (-7%) | 24mo | $132,000 | $113 | 51 |
Match score weights: distance 35% · size 25% · config 20% · recency 20%. Top-matched comps best support the ARV.
Projected returns pro-forma
-3.0% appreciation · 3.0% rent growth · sell at horizon
- IRR
- 31.6%
- Equity multiple
- 2.33×
- Total profit
- $24,167
- Equity at exit
- $9,692
- IRR
- 38.7%
- Equity multiple
- 4.62×
- Total profit
- $65,841
- Equity at exit
- $5,620
Cash invested: $18,200 (down + closing). Projections, not guarantees.
Landlord ↔ Tenant lean methodology
- Overall (STATE)
- 83 Strongly Landlord-Friendly
- State Iowa
- 83 Strongly Landlord-Friendly · R+6
- County
- — inherits STATE
- City
- — inherits STATE
ZIP-level market 51239
- Active inventory
- 8
- Price-to-rent
- 4.2×
Monthly cashflow live
- Estimated rent
- $1,302 medium interval (Pro) →
- Mortgage (P&I)
- −$341
- Tax from tax record
- −$116 /mo · $1,398/yr
- Insurance
- −$27
- HOA
- −$0
- Vacancy / Maint / Mgmt
- −$273
- Net cashflow
- $544
Break-even live
Sensitivity live
| Price | -10% $581 | -5% $563 | +0% $544 | +5% $526 | +10% $507 |
|---|---|---|---|---|---|
| Rent | -10% $441 | -5% $493 | +0% $544 | +5% $596 | +10% $647 |
| Rate | -1.0pp $577 | -0.5pp $561 | base $544 | +0.5pp $527 | +1.0pp $510 |
UW: 25.0% down · 7.5% · 30yr · 1.5% tax · 5.0% vac · 8.0% maint · 8.0% mgmt
Financing live
Cash to close
- Down payment
- $16,250
- Closing costs
- $1,950
- Reserves months
- —
- Total cash needed
- —
Loan-product check · same deal, 3 products live
Conventional
25% down · 7.5% · 30yr
- Down + closing
- —
- Monthly P&I
- —
- Monthly cashflow
- —
- DSCR
- —
- Eligible?
- —
Personal DTI + credit; lowest rate.
DSCR
20% down · 8.5% · 30yr
- Down + closing
- —
- Monthly P&I
- —
- Monthly cashflow
- —
- DSCR
- —
- Eligible?
- —
No personal income docs; deal must DSCR.
Hard money
10% down · 12.0% · 12mo
- Down + closing
- —
- Monthly P&I
- —
- Monthly cashflow
- —
- DSCR
- —
- Eligible?
- —
Short-term bridge; refi at stabilization.
Listing history 19 events
-
2026-06-21days on market $65,000 Active 26 DOM
-
2026-06-21days on market $65,000 Active 25 DOM
-
2026-06-18days on market $65,000 Active 23 DOM
-
2026-06-17days on market $65,000 Active 22 DOM
-
2026-06-16days on market $65,000 Active 21 DOM
-
2026-06-15days on market $65,000 Active 20 DOM
-
2026-06-13days on market $65,000 Active 18 DOM
-
2026-06-12days on market $65,000 Active 17 DOM
-
2026-06-09days on market $65,000 Active 14 DOM
-
2026-06-08days on market $65,000 Active 13 DOM
-
2026-06-07days on market $65,000 Active 12 DOM
-
2026-06-07days on market $65,000 Active 11 DOM
-
2026-06-04days on market $65,000 Active 8 DOM
-
2026-06-02days on market $65,000 Active 7 DOM
-
2026-06-01days on market $65,000 Active 6 DOM
-
2026-05-31days on market $65,000 Active 5 DOM
-
2026-05-31days on market $65,000 Active 4 DOM
-
2026-05-26$65,000 Active
-
2017-10-03soldstatus $64,875
ⓘ Source: listings_history table (triggers on properties + properties_extension) + one-shot
backfill from property_details.listing_events for pre-trigger history.
Tax reassessment forecast IA · Partial reset (capped growth)
- Current annual tax
- $1,398 · $116/mo
- Projected year-2 tax
- $1,398 · $116/mo
- Expected delta
- $0/yr ($0/mo · 0.0%)
ⓘ Screening estimate from a state-policy table — verify with the county assessor before closing.
Climate risk First Street
- Flood 1/10 Low FEMA zone X (unshaded) · 0% chance over 30 yrs
- Wildfire 1/10 Low
- Heat 3/10 Moderate 7 d/yr ≥101°F today · 15 d/yr by 30 yrs out
- Wind 2/10 Low
- Air quality 2/10 Low 0 unhealthy d/yr today · 1 by 30 yrs out
Nearby sold comps map
Loading sold comps map…
Walkable amenities ~0.75 mi
Loading nearby amenities…
Taxation est. · year 1
- Rental income
- $15,625
- − Mortgage interest
- −$3,641
- − Property taxes
- −$1,398
- − Insurance
- −$325
- − Repairs & maintenance
- −$1,250
- − Management
- −$1,250
- − Depreciation
- −$1,891
- Taxable income
- $5,870
- Est. tax owed @ 24.0%
- −$1,409
- After-tax cash flow
- $5,121/yr
For passive investors: Depreciation is non-cash, so a rental often shows a tax loss while cash-flowing — sheltering income. Rental losses are passive: they offset passive income freely, and up to $25,000/yr can offset ordinary (W-2) income if you actively participate and your MAGI is under $100k (phasing out to $0 by $150k); unused losses carry forward. On sale, claimed depreciation is recaptured at up to 25%, and gains may owe capital-gains tax (a 1031 exchange can defer both). Figures are a year-1 estimate at your 24.0% rate — not tax advice; consult a CPA.
Schools (NCES district)
- District
- Boyden-Hull Community School District
- NCES district ID
- 1905190
- Math proficiency
- 69% ▼ -9.00%
- Reading proficiency
- 68% ▼ -10.00%
- Median HH income
- $59,147
- Composite
- 59.01/100
- National rank
- #961
- State rank
- #150 of 289 in IA
Livability — Hull
- Score
- 83/100
- State rank
- #38
- US rank
- #1018
Category grades
Schools grade is shown separately in the Schools card above.
Census & demographics
- Census place
- Hull, IA
- Population (ZIP)
- 2,947
Population outlook (Sioux County) Hauer SSP2
- Today (2025)
- 35,762 people
- By 2030
- 36,317 · +1.6%
- By 2040
- 37,204 · +4.0%
- By 2050
- 37,990 · +6.2%
- By 2075
- 39,504 · +10.5%
- By 2100
- 39,809 · +11.3%
Race, ethnicity, and origin ACS 2023
- Neighborhood character
- Predominantly White (88%)
- Race & ethnicity
- White 88% Hispanic / Latino 12% Two or more races 5%
- Hispanic origin (detail)
- Mexican 10%
- Common ancestry
- Iranian 53% Portuguese 2% Serbian 2%
- Foreign-born
- 6% · Canada
- Languages at home
- 91% English-only · Spanish 9%
Political lean MEDSL · Sioux
- 2024 margin
- Solid R (+71.1) · D 13.9% · R 85.0% · Other 1.1%
- 2008→2024 swing
- -8.3pp toward R · 2008: -62.8pp · 2024: -71.1pp
- All cycles
- 2024: R+71.1 2020: R+66.5 2016: R+69.3 2012: R+68.0 2008: R+62.8
Not yet ingested
- Civics
- —
Market trends
- HPI YoY
- ▼ -165.18%
- Current HPI
- 189.8388
- Rent YoY
- —
- Metro
- —
- State GDP YoY
- ▲ 2.48%
- F500 in state
- 4
Industry mix (Fortune 500 HQ in IA)
| Industry | F500 HQs | Revenue |
|---|---|---|
| Financial Services | 1 | $16B |
|
||
| Retail / Convenience | 1 | $15B |
|
||
Price history
+0.2% since first listed2 events — show timeline
- 2026-05-26 Listed $65,000 NWIA
- 2017-10-03 Sold (Public Records) $64,875 Public Records
Property tax history
+5.3%/yrLatest (2025): $1,398 · +1.5% YoY. Source: county tax records.
Cash-flow waterfall
monthlySold comps — $/sqft
last 12 mo · ≤1 miLoading sold comps…