84619 11th St · Searles Valley, CA
Flood risk 1/10 · Minimal
- FEMA flood zone
- D
- Chance of flooding over 30 yrs
- 0.0%
- Est. flood insurance / yr
- $544 – $1,084
Fire risk 4/10 · Minor
- Est. fire insurance / yr
- $659 – $1,223
Heat risk 9/10 · Severe
- Hot days now (above 108°F)
- 7 days/yr
- Hot days in 30 yrs
- 19 days/yr
Wind risk 1/10 · Minimal
- Chance of severe wind over 30 yrs
- —
Air-quality risk 4/10 · Minor
- Unhealthy air days now
- 4 days/yr
- Unhealthy air days in 30 yrs
- 5 days/yr
Risk factors via First Street. Map © Google.
Why this score? — see what drove the C+ grade
The composite is a weighted blend of 9 inputs, each scored 0–100. Each bar is that input's sub-score; the figure is the points it added to the 100-point composite (weight × sub-score).
- Cash flow +30.0/30.0
- DSCR +10.0/10.0
- 1% rule +8.3/10.0
- Appreciation +5.0/10.0
- Livability +3.1/5.0
- Schools +3.0/10.0
- Rent growth +2.5/5.0
- Condition / age +2.5/5.0
- ARV discount +0.0/15.0
$119,000
🖨 Deal sheet (PDF) 📄 Offer letter ✓ Due diligence
Listing remarks MLS
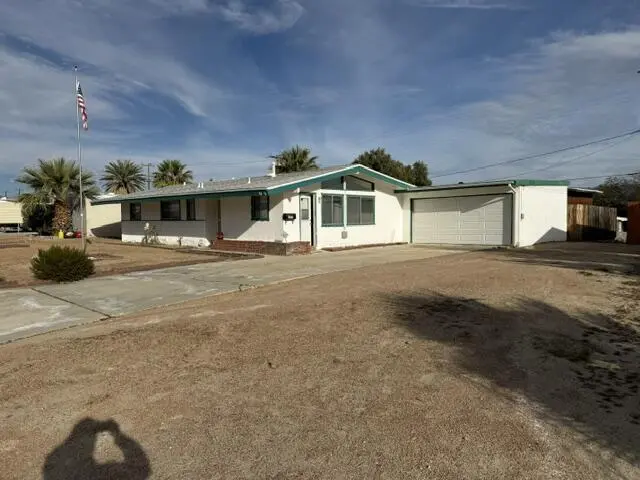
Located in the Pioneer Point neighborhood of Trona, this 3-bedroom, 2-bath home offers comfortable living with smart, low-fuss features. With approximately 1,150 sq ft of living space, a 2-car garage, and a storage shed, there's room for daily life, parking, and extra storage. Set on a 0.26-acre lot, the property includes a fenced yard-ideal for pets, privacy, and outdoor space you can actually use. Designed for minimal maintenance, this is a great option for buyers who want more time enjoying the desert lifestyle and less time working on upkeep. Plus, you're close to outdoor riding trails, making it easy to get out and explore whenever the mood hits. Additional highlights include a sewer connection and a practical layout that works well for full-time living, a weekend place, or an investment.
Key facts
- Sewer connection
- Practical layout
- Fenced in yard
Tags
Neighborhood map
What this means for you Summary
Snapshot
- This is a 4-bed/2.0-bath single-family listed at $119k.
Deal economics
- At list price, monthly cash flow is $530 ($6k/yr) — positive.
- The deal already cash-flows at list — no discount required.
- Meets the 1% rule at list price ($2k rent vs $119k).
- Recommended offer: $108k (9.0% below list) — sets the bar for market timing.
Location & tenants
- Location reads 62/100 on livability (#500 in CA) — a middle-class / working-renter tenant base. Strengths: cost of living A+, housing A+, crime B; Watch: health & safety C-, schools F, amenities F.
- Trona Joint Unified (rural): math 25% / reading 40% proficiency, ranked #1,004 of 1,400 in CA (top 72%) — families likely to look elsewhere, expect single-tenant / working-renter base with shorter leases; 61% free/reduced lunch — lower-income household profile, screen leases tightly.
- Market conditions: 56 active listings in the ZIP; 5,458 units permitted in San Bernardino County in 2024 (1,500 in 5+ unit buildings).
Forward outlook
- In year one you build about $4k of equity ($823 loan paydown + $4k appreciation (3.0% local appreciation)).
- San Bernardino County population projected at +15% by 2050 — modest demand growth; plan on rents tracking national, not racing it.
- At projected returns (3.0% appreciation + 3.0% rent growth), your $33k cash investment doubles in ~3 years — after that, you're playing with house money.
- By year 8, paydown + projected appreciation supports a ~$32k cash-out refi (75% LTV) — recoverable capital for the next deal without selling this one.
Negotiation context
- It's been on market 110 days — a 9% lower offer ($108k) is reasonable based on typical stale-listing flexibility.
- 3 sale attempts with the ask held roughly flat each time — persistent listings suggest the price (not the market) is what's stuck; bring a comps-based counter.
Risks & watch-outs
- Watch-outs: built in 1956 — expect roof / HVAC / electrical / plumbing capex.
- Climate carrying-cost: extreme-heat days projected 7→19/yr by 2055 (HVAC capex compounding) — expect insurance premiums to compound above CPI over the hold.
Questions for the listing agent
- It's been on market 110 days. Have you received any prior offers? Is the seller open to a 9% concession, seller financing, or rate buy-down credit?
- Built in 1956 — when were the roof, HVAC, electrical panel, plumbing, and water heater last replaced?
- Why hasn't it sold? Are there any deal-killer items the seller is aware of (foundation, flood, title, zoning, code violations)?
- Is there a deadline driving the sale (1031 exchange, divorce, estate, relocation)? That informs how much negotiation room exists.
- Schools are F-rated, which usually means shorter tenancies and higher turnover. Who's the typical renter profile here, and what's been the actual vacancy rate?
- What's the average days-on-market for RENTAL listings here right now (not sales)? A rising rental-DOM trend means longer vacancies and softer asking-rent achievability than the comps imply.
- What's the recent tenant-quality profile in this submarket — average credit score on applications, eviction rate, late-payment / NSF rate, and stable-employment percentage? A property-management company in the area should have these aggregated.
- How much new for-sale + rental construction is in the pipeline within 1–3 miles? Heavy new supply typically softens prices + rents 12–24 months out; constrained supply supports both.
Investment metrics
- 1% rule
- 1.33% ✓
- Cap rate
- 11.64%
- Cash-on-cash
- 19.10%
- DSCR
- 1.85
- GRM
- 6.2
CMA / ARV
- ARV (median comp)
- $98,267
- List price
- $119,000
- Delta
- 21.10%
- Verdict
- OVERPRICED
- Comps
- 20 within 1.0 mi
Show comp detail 10 sales within ~0.75 mi
| Address | Dist | Beds/Ba | Sqft | Sold | Price | $/sf | Match |
|---|---|---|---|---|---|---|---|
| 84673 9th St | 0.09mi | 4/2.0 | 1,150 (0%) | 11mo | $40,500 | $35 | 87 |
| 84607 11th St | 0.02mi | 3/2.0 (-1) | 1,150 (0%) | 10mo | $160,000 | $139 | 86 |
| 84640 11th St | 0.04mi | 4/2.0 | 1,150 (0%) | 16mo | $129,000 | $112 | 85 |
| 13876 Elm St | 0.11mi | 4/2.0 | 1,150 (0%) | 17mo | $155,000 | $135 | 81 |
| 84537 9th St | 0.12mi | 3/2.0 (-1) | 1,227 (+7%) | 1mo | $88,000 | $72 | 78 |
| 13600 Elm St | 0.37mi | 3/2.0 (-1) | 1,132 (-2%) | 9mo | $77,000 | $68 | 68 |
| 13610 Elm St | 0.36mi | 3/2.0 (-1) | 1,116 (-3%) | 12mo | $130,000 | $116 | 63 |
| 13548 Dogwood St | 0.41mi | 3/1.0 (-1) | 1,134 (-1%) | 12mo | $115,000 | $101 | 60 |
| 84565 9th St St | 0.08mi | 3/1.0 (-1) | 1,020 (-11%) | 13mo | $100,000 | $98 | 58 |
| 13527 Cedar St | 0.40mi | 3/1.5 (-1) | 1,084 (-6%) | 10mo | $79,000 | $73 | 57 |
Match score weights: distance 35% · size 25% · config 20% · recency 20%. Top-matched comps best support the ARV.
Projected returns pro-forma
3.0% appreciation · 3.0% rent growth · sell at horizon
- IRR
- 25.4%
- Equity multiple
- 2.44×
- Total profit
- $48,072
- Equity at exit
- $53,508
- IRR
- 26.2%
- Equity multiple
- 4.71×
- Total profit
- $123,768
- Equity at exit
- $82,462
Cash invested: $33,320 (down + closing). Projections, not guarantees.
Landlord ↔ Tenant lean methodology
- Overall (STATE)
- 18 Strongly Tenant-Friendly
- State California
- 18 Strongly Tenant-Friendly · D+13
- County
- — inherits STATE
- City
- — inherits STATE
ZIP-level market 93562
- Active inventory
- 56
- Price-to-rent
- 6.2×
Monthly cashflow live
- Estimated rent
- $1,588 medium interval (Pro) →
- Mortgage (P&I)
- −$624
- Tax from tax record
- −$51 /mo · $607/yr
- Insurance
- −$50
- HOA
- −$0
- Vacancy / Maint / Mgmt
- −$333
- Net cashflow
- $530
Break-even live
Sensitivity live
| Price | -10% $598 | -5% $564 | +0% $530 | +5% $497 | +10% $463 |
|---|---|---|---|---|---|
| Rent | -10% $405 | -5% $468 | +0% $530 | +5% $593 | +10% $656 |
| Rate | -1.0pp $590 | -0.5pp $561 | base $530 | +0.5pp $499 | +1.0pp $468 |
UW: 25.0% down · 7.5% · 30yr · 1.5% tax · 5.0% vac · 8.0% maint · 8.0% mgmt
Financing live
Cash to close
- Down payment
- $29,750
- Closing costs
- $3,570
- Reserves months
- —
- Total cash needed
- —
Loan-product check · same deal, 3 products live
Conventional
25% down · 7.5% · 30yr
- Down + closing
- —
- Monthly P&I
- —
- Monthly cashflow
- —
- DSCR
- —
- Eligible?
- —
Personal DTI + credit; lowest rate.
DSCR
20% down · 8.5% · 30yr
- Down + closing
- —
- Monthly P&I
- —
- Monthly cashflow
- —
- DSCR
- —
- Eligible?
- —
No personal income docs; deal must DSCR.
Hard money
10% down · 12.0% · 12mo
- Down + closing
- —
- Monthly P&I
- —
- Monthly cashflow
- —
- DSCR
- —
- Eligible?
- —
Short-term bridge; refi at stabilization.
Listing history 18 events
-
2026-06-18days on market $119,000 Active 110 DOM
-
2026-06-17days on market $119,000 Active 109 DOM
-
2026-06-16days on market $119,000 Active 108 DOM
-
2026-06-15days on market $119,000 Active 107 DOM
-
2026-06-14days on market $119,000 Active 105 DOM
-
2026-06-13days on market $119,000 Active 104 DOM
-
2026-06-10days on market $119,000 Active 102 DOM
-
2026-06-09days on market $119,000 Active 101 DOM
-
2026-06-08days on market $119,000 Active 100 DOM
-
2026-06-07days on market $119,000 Active 99 DOM
-
2026-06-05days on market $119,000 Active 96 DOM
-
2026-06-03days on market $119,000 Active 95 DOM
-
2026-06-03days on market $119,000 Active 94 DOM
-
2026-06-01days on market $119,000 Active 93 DOM
-
2026-05-31days on market $119,000 Active 92 DOM
-
2026-03-08status Active 804-char remark
Show marketing remark (804 chars)
Located in the Pioneer Point neighborhood of Trona, this 3-bedroom, 2-bath home offers comfortable living with smart, low-fuss features. With approximately 1,150 sq ft of living space, a 2-car garage, and a storage shed, there's room for daily life, parking, and extra storage. Set on a 0.26-acre lot, the property includes a fenced yard-ideal for pets, privacy, and outdoor space you can actually use. Designed for minimal maintenance, this is a great option for buyers who want more time enjoying the desert lifestyle and less time working on upkeep. Plus, you're close to outdoor riding trails, making it easy to get out and explore whenever the mood hits. Additional highlights include a sewer connection and a practical layout that works well for full-time living, a weekend place, or an investment.
-
2026-02-28$119,000 Active 795-char remark
Show marketing remark (795 chars)
Located in Pioneer Point neighborhood of Trona, this 3 bedroom 2 bath home offers comfortable living with smart low fuss features. With approx 1150 sq ft of living space, a 2 car garage, and storage shed there is plenty of room for daily life, parking, and extra storage. Set on a 0.26 acre lot, the property includes a fenced in yard ideal for pets, privacy, and outdoor space you can actually use. Designed for minimal maintenance this is a great option for buyers who want more time to enhou the desert lifestyle and less time working on upkeep. Plus, you're close to outdoor riding trails making it easy to get out and explore whenever the mood hits, Additional highlights include a sewer connection and a practical layout that works well for full time living, weekend escape, or investment.
-
2026-02-06$119,000 Active 804-char remark
Show marketing remark (804 chars)
Located in the Pioneer Point neighborhood of Trona, this 3-bedroom, 2-bath home offers comfortable living with smart, low-fuss features. With approximately 1,150 sq ft of living space, a 2-car garage, and a storage shed, there's room for daily life, parking, and extra storage. Set on a 0.26-acre lot, the property includes a fenced yard-ideal for pets, privacy, and outdoor space you can actually use. Designed for minimal maintenance, this is a great option for buyers who want more time enjoying the desert lifestyle and less time working on upkeep. Plus, you're close to outdoor riding trails, making it easy to get out and explore whenever the mood hits. Additional highlights include a sewer connection and a practical layout that works well for full-time living, a weekend place, or an investment.
ⓘ Source: listings_history table (triggers on properties + properties_extension) + one-shot
backfill from property_details.listing_events for pre-trigger history.
Tax reassessment forecast CA · Resets to sale price
- Current annual tax
- $607 · $51/mo
- Projected year-2 tax
- $904 · $75/mo
- Expected delta
- +$298/yr (+$25/mo · 49.0%)
ⓘ Screening estimate from a state-policy table — verify with the county assessor before closing.
Climate risk First Street
- Flood 1/10 Low FEMA zone D · 0% chance over 30 yrs
- Wildfire 4/10 Moderate
- Heat 9/10 Extreme 7 d/yr ≥108°F today · 19 d/yr by 30 yrs out
- Wind 1/10 Low
- Air quality 4/10 Moderate 4 unhealthy d/yr today · 5 by 30 yrs out
Nearby sold comps map
Loading sold comps map…
Walkable amenities ~0.75 mi
Loading nearby amenities…
Taxation est. · year 1
- Rental income
- $19,055
- − Mortgage interest
- −$6,666
- − Property taxes
- −$607
- − Insurance
- −$595
- − Repairs & maintenance
- −$1,524
- − Management
- −$1,524
- − Depreciation
- −$3,462
- Taxable income
- $4,677
- Est. tax owed @ 24.0%
- −$1,122
- After-tax cash flow
- $5,241/yr
For passive investors: Depreciation is non-cash, so a rental often shows a tax loss while cash-flowing — sheltering income. Rental losses are passive: they offset passive income freely, and up to $25,000/yr can offset ordinary (W-2) income if you actively participate and your MAGI is under $100k (phasing out to $0 by $150k); unused losses carry forward. On sale, claimed depreciation is recaptured at up to 25%, and gains may owe capital-gains tax (a 1031 exchange can defer both). Figures are a year-1 estimate at your 24.0% rate — not tax advice; consult a CPA.
Schools (NCES district)
- District
- Trona Joint Unified
- NCES district ID
- 0639840
- Math proficiency
- 25% ▲ 5.00%
- Reading proficiency
- 40% ▲ 5.00%
- Median HH income
- $35,514
- Composite
- 29.6/100
- National rank
- #11751
- State rank
- #1004 of 1400 in CA
Livability — Searles Valley
- Score
- 62/100
- State rank
- #500
- US rank
- #16976
Category grades
Schools grade is shown separately in the Schools card above.
Census & demographics
- Census place
- Searles Valley, CA
- Population (ZIP)
- 1,822
Population outlook (San Bernardino County) Hauer SSP2
- Today (2025)
- 2,300,329 people
- By 2030
- 2,378,907 · +3.4%
- By 2040
- 2,523,137 · +9.7%
- By 2050
- 2,642,388 · +14.9%
- By 2075
- 2,880,769 · +25.2%
- By 2100
- 2,909,436 · +26.5%
Race, ethnicity, and origin ACS 2023
- Neighborhood character
- Predominantly White (65%)
- Race & ethnicity
- White 65% Hispanic / Latino 22% Two or more races 14% Black 2% Native American 2% Asian 1%
- Hispanic origin (detail)
- Mexican 16% Cuban 2%
- Common ancestry
- Italian 6% Slovak 2% Russian 1%
- Foreign-born
- 2% · Canada, China
- Languages at home
- 94% English-only · Spanish 4% Chinese 1%
Political lean MEDSL · San Bernardino
- 2024 margin
- Toss-up / Even · D 47.5% · R 49.7% · Other 2.8%
- 2008→2024 swing
- -8.5pp toward R · 2008: 6.3pp · 2024: -2.1pp
- All cycles
- 2024: R+2.1 2020: D+10.7 2016: D+9.8 2012: D+5.4 2008: D+6.3
Not yet ingested
- Civics
- —
Market trends
- HPI YoY
- —
- Current HPI
- —
- Rent YoY
- —
- Metro
- —
- State GDP YoY
- ▲ 3.21%
- F500 in state
- 116
Industry mix (Fortune 500 HQ in CA)
| Industry | F500 HQs | Revenue |
|---|---|---|
| Technology | 27 | $1,492B |
|
||
| Financial Services | 3 | $174B |
|
||
| Retail | 3 | $44B |
|
||
| Insurance | 3 | $26B |
|
||
| Media / Entertainment | 2 | $115B |
|
||
| Pharmaceuticals / Biotech | 2 | $62B |
|
||
Price history
+0.0% since first listed3 events — show timeline
- 2026-03-08 Relisted — SSMLS
- 2026-02-28 Listed $119,000 GPSMLS
- 2026-02-06 Listed $119,000 SSMLS
Property tax history
+3.6%/yrLatest (2025): $607 · +2.1% YoY. Source: county tax records.
Cash-flow waterfall
monthlySold comps — $/sqft
last 12 mo · ≤1 miLoading sold comps…