23015 Bellini Dr · Magnolia, TX
Flood risk 1/10 · Minimal
- FEMA flood zone
- X (unshaded)
- Chance of flooding over 30 yrs
- 0.0%
- Est. flood insurance / yr
- $507 – $1,088
Fire risk 5/10 · Moderate
- Est. fire insurance / yr
- $1,222 – $2,270
Heat risk 8/10 · Major
- Hot days now (above 111°F)
- 7 days/yr
- Hot days in 30 yrs
- 23 days/yr
Wind risk 8/10 · Major
- Chance of severe wind over 30 yrs
- 99.0%
Air-quality risk 2/10 · Minimal
- Unhealthy air days now
- 1 days/yr
- Unhealthy air days in 30 yrs
- 1 days/yr
Risk factors via First Street. Map © Google.
Why this score? — see what drove the D- grade
The composite is a weighted blend of 9 inputs, each scored 0–100. Each bar is that input's sub-score; the figure is the points it added to the 100-point composite (weight × sub-score).
- Cash flow +11.9/30.0
- ARV discount +7.5/15.0
- Schools +3.9/10.0
- Livability +3.7/5.0
- 1% rule +3.6/10.0
- DSCR +3.5/10.0
- Rent growth +2.5/5.0
- Condition / age +2.5/5.0
- Appreciation +0.0/10.0
$204,000
🖨 Deal sheet 📄 Offer letter ✓ Due diligence
Listing remarks MLS
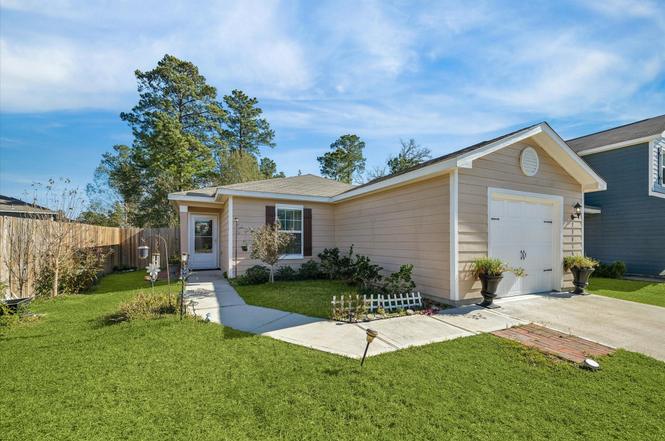
Walnut Plan by LGI Homes. This charming one-story home features a functional layout with 3 bedrooms, 2 baths and an attached one-car garage. The open kitchen and breakfast room overlook an expansive living room, providing a perfect layout for entertaining. This home also features a private owner’s retreat with ceiling fan, two secondary bedrooms and a second full bathroom. Each home in Williams Trace includes designer upgrades including a full set of kitchen appliances, refrigerator with ice maker, granite countertops, brushed nickel hardware throughout and a backyard patio. Williams Trace by LGI Homes features a variety of floor plans and onsite amenities, including a playground, splash pad, picnic area and more!
Key facts
- Walk-in closets
- Extended driveway
- Granite countertops
Tags
Neighborhood map
What this means for you Summary
Snapshot
- This is a 3-bed/2.0-bath single-family listed at $204k.
Deal economics
- At list price, monthly cash flow is $-53 ($-639/yr) — negative.
- To cash-flow at today's rent, offer at most $195k (4.6% below list).
- To meet the 1% rule (rent ≥ 1% of price), the offer needs to be $175k (14.0% below list).
- Recommended offer: $175k (14.0% below list) — sets the bar for 1% rule.
- Cap rate 6.0% vs local median 3.4% in Magnolia — top-decile yield for the area; either an underpriced asset or a hidden risk that comps aren't pricing in. Stress-test before assuming the spread holds.
Location & tenants
- Location reads 73/100 on livability (#222 in TX) — a middle-class / working-renter tenant base. Strengths: crime A+, cost of living A+, housing A+; Watch: amenities F, commute F.
- Magnolia ISD (rural): math 42% / reading 45% proficiency, ranked #247 of 826 in TX (top 30%) — families likely to look elsewhere, expect single-tenant / working-renter base with shorter leases.
- Zoned schools: Nichols Sawmill El (math 37% / reading 47%, grade F, #1,335 of 4,322 statewide, top 33%, 562 students, 44% FRL); Magnolia West H S (math 41% / reading 53%, grade D-, #591 of 1,632 statewide, top 38%, 2,208 students, 52% FRL).
- Market conditions: 553 active listings in the ZIP; 9 comparable units currently listed for rent nearby; rentals at typical pace (median 22d on market — plan ~3-4 weeks tenant-placement turnaround); solid renter incomes; 13,259 units permitted in Montgomery County in 2024 (1,402 in 5+ unit buildings).
Forward outlook
- Local home prices are declining (-3.0%/yr); year-one equity from $1k of loan paydown is wiped out by about $6k of value loss. Plan a longer hold.
- Montgomery County population projected at +65% by 2050 — long-run rental-demand tailwind backs the buy-and-hold thesis.
Negotiation context
- It's been on market 53 days — a 3% lower offer ($198k) is reasonable based on typical stale-listing flexibility.
- 3 sale attempts since 6y ago with the ask held roughly flat each time — persistent listings suggest the price (not the market) is what's stuck; bring a comps-based counter.
Risks & watch-outs
- Climate carrying-cost: severe wind risk, 99% chance of damaging wind over 30y; moderate wildfire risk; extreme-heat days projected 7→23/yr by 2055 (HVAC capex compounding) — expect insurance premiums to compound above CPI over the hold.
Questions for the listing agent
- What do current leases actually rent for vs. the listed asking? Can we see a recent rent roll and the last 12 months of T-12 income?
- It's been on market 53 days. Have you received any prior offers? Is the seller open to a 14% concession, seller financing, or rate buy-down credit?
- What does the HOA fee cover, when was the last increase, and are there any pending special assessments or reserve-fund shortfalls?
- Is there a deadline driving the sale (1031 exchange, divorce, estate, relocation)? That informs how much negotiation room exists.
- Schools are D-rated, which usually means shorter tenancies and higher turnover. Who's the typical renter profile here, and what's been the actual vacancy rate?
- The area grade is low — what's the realistic commute time and amenity access for the typical tenant pool here? Any planned neighborhood developments (good or bad) we should know about?
- What's the average days-on-market for RENTAL listings here right now (not sales)? A rising rental-DOM trend means longer vacancies and softer asking-rent achievability than the comps imply.
- What's the recent tenant-quality profile in this submarket — average credit score on applications, eviction rate, late-payment / NSF rate, and stable-employment percentage? A property-management company in the area should have these aggregated.
- How much new for-sale + rental construction is in the pipeline within 1–3 miles? Heavy new supply typically softens prices + rents 12–24 months out; constrained supply supports both.
Investment metrics
- 1% rule
- 0.86% ✗
- Cap rate
- 5.98%
- Cash-on-cash
- -1.12%
- DSCR
- 0.95
- GRM
- 9.7
CMA / ARV
- ARV (on-the-fly)
- $203,904
- Comps found
- 9
Show comp detail 9 sales within ~0.75 mi
| Address | Dist | Beds/Ba | Sqft | Sold | Price | $/sf | Match |
|---|---|---|---|---|---|---|---|
| 23015 Bellini Dr | 0.00mi | 3/2.0 | 1,152 (0%) | 0mo | $204,000 | $177 | 100 |
| 28025 Irving Dr | 0.13mi | 3/2.0 | 1,162 (+1%) | 1mo | $187,000 | $161 | 92 |
| 27010 Poets Dr | 0.16mi | 3/2.0 | 1,152 (0%) | 13mo | $219,900 | $191 | 82 |
| 23585 Joseph Rd | 0.29mi | 2/1.0 (-1) | 1,080 (-6%) | 13mo | $315,000 | $292 | 56 |
| 40830 Hawthorne Glades | 0.51mi | 3/2.0 | 1,280 (+11%) | 6mo | $242,990 | $190 | 53 |
| 26540 Restful Holw | 0.51mi | 2/1.0 (-1) | 1,160 (+1%) | 19mo | $275,000 | $237 | 50 |
| 26424 Leisure Ln | 0.67mi | 3/1.0 | 1,152 (0%) | 23mo | $132,000 | $115 | 46 |
| — | 0.49mi | 2/2.0 (-1) | 1,303 (+13%) | 13mo | $162,500 | $125 | 40 |
| 26405 Easy St | 0.73mi | 2/1.0 (-1) | 1,303 (+13%) | 9mo | $215,000 | $165 | 27 |
Match score weights: distance 35% · size 25% · config 20% · recency 20%. Top-matched comps best support the ARV.
Projected returns pro-forma
-3.0% appreciation · 3.0% rent growth · sell at horizon
- IRR
- -18.1%
- Equity multiple
- 0.36×
- Total profit
- $-36,406
- Equity at exit
- $30,417
- IRR
- -10.3%
- Equity multiple
- 0.37×
- Total profit
- $-35,891
- Equity at exit
- $17,638
Cash invested: $57,120 (down + closing). Projections, not guarantees.
Landlord ↔ Tenant lean methodology
- Overall (STATE)
- 87 Strongly Landlord-Friendly
- State Texas
- 87 Strongly Landlord-Friendly · R+5
- County
- — inherits STATE
- City
- — inherits STATE
ZIP-level market 77355
- Home prices YoY
- -30.3%
- Active inventory
- 553
- Price-to-rent
- 9.7×
Monthly cashflow live
- Estimated rent
- $1,754 high interval (Pro) →
- Mortgage (P&I)
- −$1,070
- Tax from tax record
- −$253 /mo · $3,041/yr
- Insurance
- −$85
- HOA
- −$31
- Vacancy / Maint / Mgmt
- −$368
- Net cashflow
- $-53
Break-even live
UW: 25.0% down · 7.5% · 30yr · 1.5% tax · 5.0% vac · 8.0% maint · 8.0% mgmt
Financing live
Cash to close
- Down payment
- $51,000
- Closing costs
- $6,120
- Reserves months
- —
- Total cash needed
- —
Loan-product check · same deal, 3 products live
Conventional
25% down · 7.5% · 30yr
- Down + closing
- —
- Monthly P&I
- —
- Monthly cashflow
- —
- DSCR
- —
- Eligible?
- —
Personal DTI + credit; lowest rate.
DSCR
20% down · 8.5% · 30yr
- Down + closing
- —
- Monthly P&I
- —
- Monthly cashflow
- —
- DSCR
- —
- Eligible?
- —
No personal income docs; deal must DSCR.
Hard money
10% down · 12.0% · 12mo
- Down + closing
- —
- Monthly P&I
- —
- Monthly cashflow
- —
- DSCR
- —
- Eligible?
- —
Short-term bridge; refi at stabilization.
Rent comps 9 comps
| Address | Beds | Baths | Sqft | Rent | $/sqft | DOM | Units | Dist |
|---|---|---|---|---|---|---|---|---|
| 23022 Bellini Dr Magnolia, TX | 3.0 | 2.0 | 1414 | $1,549 | $1.10 | 20d | 1 | 0.05mi |
| 25238 Dickens Dr Magnolia, TX | 3.0 | 2.0 | 1152 | $1,585 | $1.38 | 43d | 1 | 0.11mi |
| 25194 Dickens Dr Magnolia, TX | 3.0 | 2.0 | 1152 | $1,570 | $1.36 | 20d | 1 | 0.14mi |
| 26323 Michelangelo Dr Magnolia, TX | 3.0 | 2.0 | 1152 | $1,480 | $1.28 | 43d | 1 | 0.14mi |
| 26327 Michelangelo Dr Magnolia, TX | 3.0 | 2.0 | 1366 | $1,580 | $1.16 | 20d | 1 | 0.15mi |
| 27032 Leonardo Dr Magnolia, TX | 3.0 | 2.0 | 1366 | $1,560 | $1.14 | 24d | 1 | 0.17mi |
| 27016 Leonardo Dr Magnolia, TX | 3.0 | 2.0 | 1364 | $1,539 | $1.13 | 21d | 1 | 0.18mi |
| 24053 Wilde Dr Magnolia, TX | 3.0 | 2.0 | 1152 | $1,495 | $1.30 | 2d | 1 | 0.29mi |
| 21163 Titian Dr Magnolia, TX | 3.0 | 2.0 | 1366 | $1,540 | $1.13 | 43d | 1 | 0.31mi |
HOA detail
- Monthly dues
- $31 · $372/yr
Listing history 16 events
-
2026-05-02status Pending
-
2026-04-21status Pending
-
2026-03-02historical
-
2026-02-08price $204,000
-
2026-01-19$210,000 Active
-
2025-12-09historical
-
2025-12-01price $217,200
-
2025-11-07price $217,800
-
2025-10-30price $217,900
-
2025-10-19price $218,600
-
2025-10-10price $219,100
-
2025-09-30price $219,000
-
2025-09-14$225,000 Active
-
2020-07-31soldstatus Sold 737-char remark
Show marketing remark (737 chars)
Walnut Plan by LGI Homes. This charming one-story home features a functional layout with 3 bedrooms, 2 baths and an attached one-car garage. The open kitchen and breakfast room overlook an expansive living room, providing a perfect layout for entertaining. This home also features a private owner’s retreat with ceiling fan, two secondary bedrooms and a second full bathroom. Each home in Williams Trace includes designer upgrades including a full set of kitchen appliances, refrigerator with ice maker, granite countertops, brushed nickel hardware throughout and a backyard patio. Williams Trace by LGI Homes features a variety of floor plans and onsite amenities, including a playground, splash pad, picnic area and more!
-
2020-06-29status Pending 737-char remark
Show marketing remark (737 chars)
Walnut Plan by LGI Homes. This charming one-story home features a functional layout with 3 bedrooms, 2 baths and an attached one-car garage. The open kitchen and breakfast room overlook an expansive living room, providing a perfect layout for entertaining. This home also features a private owner’s retreat with ceiling fan, two secondary bedrooms and a second full bathroom. Each home in Williams Trace includes designer upgrades including a full set of kitchen appliances, refrigerator with ice maker, granite countertops, brushed nickel hardware throughout and a backyard patio. Williams Trace by LGI Homes features a variety of floor plans and onsite amenities, including a playground, splash pad, picnic area and more!
-
2020-06-10$179,900 Active 737-char remark
Show marketing remark (737 chars)
Walnut Plan by LGI Homes. This charming one-story home features a functional layout with 3 bedrooms, 2 baths and an attached one-car garage. The open kitchen and breakfast room overlook an expansive living room, providing a perfect layout for entertaining. This home also features a private owner’s retreat with ceiling fan, two secondary bedrooms and a second full bathroom. Each home in Williams Trace includes designer upgrades including a full set of kitchen appliances, refrigerator with ice maker, granite countertops, brushed nickel hardware throughout and a backyard patio. Williams Trace by LGI Homes features a variety of floor plans and onsite amenities, including a playground, splash pad, picnic area and more!
ⓘ Source: listings_history table (triggers on properties + properties_extension) + one-shot
backfill from property_details.listing_events for pre-trigger history.
Tax reassessment forecast TX · Resets to sale price
- Current annual tax
- $3,041 · $253/mo
- Projected year-2 tax
- $3,733 · $311/mo
- Expected delta
- +$692/yr (+$58/mo · 22.8%)
ⓘ Screening estimate from a state-policy table — verify with the county assessor before closing.
Climate risk First Street
- Flood 1/10 Low FEMA zone X (unshaded) · 0% chance over 30 yrs
- Wildfire 5/10 Major
- Heat 8/10 Severe 7 d/yr ≥111°F today · 23 d/yr by 30 yrs out
- Wind 8/10 Severe 99% chance of damaging wind over 30 yrs
- Air quality 2/10 Low 1 unhealthy d/yr today · 1 by 30 yrs out
Nearby sold comps map
Loading sold comps map…
Walkable amenities ~0.75 mi
Loading nearby amenities…
Taxation est. · year 1
- Rental income
- $21,052
- − Mortgage interest
- −$11,427
- − Property taxes
- −$3,041
- − Insurance
- −$1,020
- − Repairs & maintenance
- −$1,684
- − Management
- −$1,684
- − HOA
- −$372
- − Depreciation
- −$5,935
- Taxable loss
- −$4,111
- Est. tax savings @ 24.0%
- +$987
- After-tax cash flow
- $347/yr
For passive investors: Depreciation is non-cash, so a rental often shows a tax loss while cash-flowing — sheltering income. Rental losses are passive: they offset passive income freely, and up to $25,000/yr can offset ordinary (W-2) income if you actively participate and your MAGI is under $100k (phasing out to $0 by $150k); unused losses carry forward. On sale, claimed depreciation is recaptured at up to 25%, and gains may owe capital-gains tax (a 1031 exchange can defer both). Figures are a year-1 estimate at your 24.0% rate — not tax advice; consult a CPA.
Schools (NCES district)
- District
- Magnolia ISD
- NCES district ID
- 4828740
- Math proficiency
- 42% ▼ -7.00%
- Reading proficiency
- 45% ▼ -4.00%
- Median HH income
- $71,692
- Composite
- 39.46/100
- National rank
- #3958
- State rank
- #247 of 826 in TX
Livability — Magnolia
- Score
- 73/100
- State rank
- #222
- US rank
- #5442
Category grades
Schools grade is shown separately in the Schools card above.
Census & demographics
- County
- Montgomery County · 663,713 people
- City population
- 32,847
- Metro
- Houston-The Woodlands-Sugar Land, TX
- Population (ZIP)
- 32,847
- Household income
- $102,066
- Rent vs Own
- Severe rent burden
- 209.0
Population outlook (Montgomery County) Hauer SSP2
- Today (2025)
- 713,896 people
- By 2030
- 805,263 · +12.8%
- By 2040
- 992,708 · +39.1%
- By 2050
- 1,179,590 · +65.2%
- By 2075
- 1,628,084 · +128.1%
- By 2100
- 1,937,880 · +171.5%
Race, ethnicity, and origin ACS 2023
- Neighborhood character
- Predominantly White (68%)
- Race & ethnicity
- White 68% Hispanic / Latino 25% Two or more races 14% Black 2% Native American 2%
- Hispanic origin (detail)
- Mexican 18%
- Common ancestry
- Slovak 4% Serbian 2% Romanian 2%
- Foreign-born
- 7% · Canada, Jamaica
- Languages at home
- 82% English-only · Spanish 17%
Political lean MEDSL · Montgomery
- 2024 margin
- Solid R (+45.5) · D 26.8% · R 72.3%
- 2008→2024 swing
- +7.2pp toward D · 2008: -52.7pp · 2024: -45.5pp
- All cycles
- 2024: R+45.5 2020: R+43.8 2016: R+51.4 2012: R+60.7 2008: R+52.7
Not yet ingested
- Civics
- —
Market trends
- HPI YoY
- ▼ -116.90%
- Current HPI
- 268.5845
- Rent YoY
- —
- Metro
- Houston-The Woodlands-Sugar Land, TX
- State GDP YoY
- ▲ 3.95%
- F500 in state
- 110
Industry mix (Fortune 500 HQ in TX)
| Industry | F500 HQs | Revenue |
|---|---|---|
| Energy | 16 | $1,198B |
|
||
| Technology | 5 | $198B |
|
||
| Engineering / Construction | 4 | $72B |
|
||
| Energy Services | 3 | $60B |
|
||
| Utilities | 3 | $41B |
|
||
| Healthcare | 2 | $330B |
|
||
Price history
+13.4% since first listed16 events — show timeline
- 2026-05-02 Pending — HARMLS
- 2026-04-21 Pending — HARMLS
- 2026-03-02 Listing Removed — HARMLS
- 2026-02-08 Price Changed $204,000 HARMLS
- 2026-01-19 Listed $210,000 HARMLS
- 2025-12-09 Listing Removed — HARMLS
- 2025-12-01 Price Changed $217,200 HARMLS
- 2025-11-07 Price Changed $217,800 HARMLS
- 2025-10-30 Price Changed $217,900 HARMLS
- 2025-10-19 Price Changed $218,600 HARMLS
- 2025-10-10 Price Changed $219,100 HARMLS
- 2025-09-30 Price Changed $219,000 HARMLS
- 2025-09-14 Listed $225,000 HARMLS
- 2020-07-31 Sold (MLS) — HARMLS
- 2020-06-29 Pending — HARMLS
- 2020-06-10 Listed $179,900 HARMLS
Property tax history
+38.0%/yrLatest (2025): $3,041 · -6.0% YoY. Source: county tax records.
Cash-flow waterfall
monthlySold comps — $/sqft
last 12 mo · ≤1 miLoading sold comps…