1934 Haynie Dr · Augusta-Richmond County consolidated government (balance), GA
Flood risk 1/10 · Minimal
- FEMA flood zone
- X (unshaded)
- Chance of flooding over 30 yrs
- 0.0%
- Est. flood insurance / yr
- $507 – $1,088
Fire risk 1/10 · Minimal
- Est. fire insurance / yr
- $963 – $1,789
Heat risk 7/10 · Major
- Hot days now (above 107°F)
- 7 days/yr
- Hot days in 30 yrs
- 17 days/yr
Wind risk 6/10 · Moderate
- Chance of severe wind over 30 yrs
- 67.0%
Air-quality risk 3/10 · Minor
- Unhealthy air days now
- 3 days/yr
- Unhealthy air days in 30 yrs
- 3 days/yr
Risk factors via First Street. Map © Google.
Why this score? — see what drove the C+ grade
The composite is a weighted blend of 9 inputs, each scored 0–100. Each bar is that input's sub-score; the figure is the points it added to the 100-point composite (weight × sub-score).
- Cash flow +25.3/30.0
- ARV discount +12.1/15.0
- DSCR +8.3/10.0
- 1% rule +6.1/10.0
- Rent growth +3.6/5.0
- Livability +2.5/5.0
- Condition / age +2.5/5.0
- Schools +1.3/10.0
- Appreciation +0.0/10.0
$109,900
🖨 Deal sheet 📄 Offer letter ✓ Due diligence
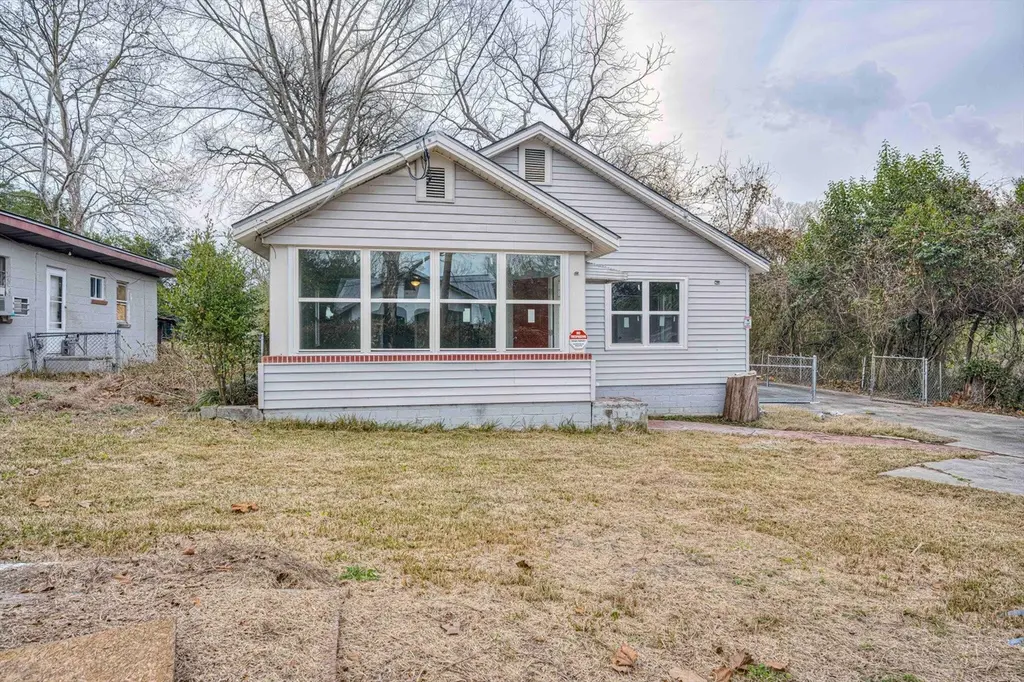
Listing remarks
This charming, fully updated 2-bedroom cottage offers move-in-ready living in a prime central Augusta location, boasting brand new windows, fresh paint, new LVP, updated kitchen/baths with granite, and potential income generation, making it perfect for homeowners or investors near AU, the medical district, and downtown amenities.
Key facts
- 0.24 acre lot
- Built 1941
Neighborhood map
What this means for you Summary
Snapshot
- This is a 2-bed/1.0-bath single-family listed at $110k.
Deal economics
- At list price, monthly cash flow is $251 ($3k/yr) — positive.
- The deal already cash-flows at list — no discount required.
- Meets the 1% rule at list price ($1k rent vs $110k).
- Cap rate 9.0% vs local median 5.3% in Augusta-Richmond County consolidated government (balance) — top-decile yield for the area; either an underpriced asset or a hidden risk that comps aren't pricing in. Stress-test before assuming the spread holds.
Location & tenants
- Location reads: area grade C — affects rentability + tenant quality, not the cash-flow math above.
- Richmond County (urban): math 12% / reading 20% proficiency, ranked #154 of 174 in GA (top 88%) — low school quality limits family demand, transient renter base, plan for 1-2y turnover; 72% free/reduced lunch — lower-income household profile, screen leases tightly.
- Zoned schools: Bayvale Elementary School (math 12% / reading 8%, grade F, #1,092 of 1,228 statewide, top 91%, 377 students, 98% FRL) — zoned schools average 98% FRL vs 72% district-wide (26 pts higher); higher-poverty schools than district average — tighter screening recommended.
- Market conditions: Rents rising fast (+4.3%/yr); 222 active listings in the ZIP; 40 comparable units currently listed for rent nearby; rentals lingering (median 44d on market — plan ~5-8 weeks vacancy on turnover, expect pricing pressure); 50% of comp listings sitting > 30 days — soft ceiling on asking rent; 561 units permitted in Richmond County in 2024 (0 in 5+ unit buildings).
- This rent runs 31% of the median local income ($47k/yr) — at the standard rent-burdened threshold; future hikes will face affordability resistance.
Forward outlook
- Local home prices are declining (-3.0%/yr); year-one equity from $760 of loan paydown is wiped out by about $3k of value loss. Plan a longer hold.
- Richmond County population projected to shrink 5% by 2050 — rents likely to lag national; underwrite the cash flow, not the appreciation.
- At projected returns (-3.0% appreciation + 4.3% rent growth), your $31k cash investment doubles in ~10 years — after that, you're playing with house money.
Negotiation context
- Only 0 days on market — expect competitive offers; lowballing is unlikely to land.
- 2 sale attempts with the ask held roughly flat each time — persistent listings suggest the price (not the market) is what's stuck; bring a comps-based counter.
Risks & watch-outs
- Watch-outs: built in 1941 — expect roof / HVAC / electrical / plumbing capex.
- Climate carrying-cost: major wind risk, 67% chance of damaging wind over 30y; extreme-heat days projected 7→17/yr by 2055 (HVAC capex compounding) — expect insurance premiums to compound above CPI over the hold.
Questions for the listing agent
- Built in 1941 — when were the roof, HVAC, electrical panel, plumbing, and water heater last replaced?
- Is there a deadline driving the sale (1031 exchange, divorce, estate, relocation)? That informs how much negotiation room exists.
- What's the average days-on-market for RENTAL listings here right now (not sales)? A rising rental-DOM trend means longer vacancies and softer asking-rent achievability than the comps imply.
- What's the recent tenant-quality profile in this submarket — average credit score on applications, eviction rate, late-payment / NSF rate, and stable-employment percentage? A property-management company in the area should have these aggregated.
- How much new for-sale + rental construction is in the pipeline within 1–3 miles? Heavy new supply typically softens prices + rents 12–24 months out; constrained supply supports both.
Investment metrics
- 1% rule
- 1.11% ✓
- Cap rate
- 9.03%
- Cash-on-cash
- 9.77%
- DSCR
- 1.43
- GRM
- 7.5
CMA / ARV
- ARV (on-the-fly)
- $122,304
- Comps found
- 12
Show comp detail 12 sales within ~0.75 mi
| Address | Dist | Beds/Ba | Sqft | Sold | Price | $/sf | Match |
|---|---|---|---|---|---|---|---|
| 1942 Haynie Dr | 0.06mi | 2/1.0 | 1,116 (-5%) | 3mo | $57,500 | $52 | 86 |
| 1922 Kissingbower Rd | 0.14mi | 2/1.0 | 1,080 (-8%) | 4mo | $69,500 | $64 | 77 |
| 2608 Polo Ct | 0.39mi | 3/2.0 (+1) | 1,221 (+4%) | 7mo | $215,000 | $176 | 60 |
| 2757 Deans Bridge Rd | 0.67mi | 2/1.0 | 1,180 (+0%) | 17mo | $111,000 | $94 | 54 |
| 2013 Shark Dr | 0.70mi | 3/1.0 (+1) | 1,059 (-10%) | 3mo | $133,000 | $126 | 43 |
| 2753 Deans Bridge Rd | 0.65mi | 2/1.0 | 1,051 (-11%) | 12mo | $81,500 | $78 | 42 |
| 2730 Edward Dr | 0.59mi | 3/1.5 (+1) | 1,305 (+11%) | 8mo | $175,000 | $134 | 40 |
| 2008 Tubman Home Rd | 0.74mi | 3/1.0 (+1) | 1,092 (-7%) | 11mo | $76,000 | $70 | 40 |
| 2133 Roosevelt Dr | 0.74mi | 3/2.0 (+1) | 1,200 (+2%) | 17mo | $125,000 | $104 | 39 |
| 2011 Shark Dr | 0.69mi | 3/2.5 (+1) | 1,300 (+10%) | 5mo | $160,000 | $123 | 35 |
| 2425 Bass Ave | 0.66mi | 3/1.0 (+1) | 1,014 (-14%) | 13mo | $156,000 | $154 | 31 |
| 1919 Hopie Rd | 0.57mi | 3/1.0 (+1) | 1,008 (-14%) | 20mo | $20,000 | $20 | 28 |
Match score weights: distance 35% · size 25% · config 20% · recency 20%. Top-matched comps best support the ARV.
Projected returns pro-forma
-3.0% appreciation · 4.29% rent growth · sell at horizon
- IRR
- -0.2%
- Equity multiple
- 0.99×
- Total profit
- $-256
- Equity at exit
- $16,386
- IRR
- 10.7%
- Equity multiple
- 1.88×
- Total profit
- $27,054
- Equity at exit
- $9,502
Cash invested: $30,772 (down + closing). Projections, not guarantees.
Landlord ↔ Tenant lean methodology
- Overall (STATE)
- 90 Strongly Landlord-Friendly
- State Georgia
- 90 Strongly Landlord-Friendly · R+3
- County
- — inherits STATE
- City
- — inherits STATE
ZIP-level market 30904
- Rents YoY
- 4.3%
- Active inventory
- 222
- Price-to-rent
- 7.5×
Monthly cashflow live
- Estimated rent
- $1,222 high interval (Pro) →
- Mortgage (P&I)
- −$576
- Tax from tax record
- −$93 /mo · $1,115/yr
- Insurance
- −$46
- HOA
- −$0
- Vacancy / Maint / Mgmt
- −$257
- Net cashflow
- $251
Break-even live
UW: 25.0% down · 7.5% · 30yr · 1.5% tax · 5.0% vac · 8.0% maint · 8.0% mgmt
Financing live
Cash to close
- Down payment
- $27,475
- Closing costs
- $3,297
- Reserves months
- —
- Total cash needed
- —
Loan-product check · same deal, 3 products live
Conventional
25% down · 7.5% · 30yr
- Down + closing
- —
- Monthly P&I
- —
- Monthly cashflow
- —
- DSCR
- —
- Eligible?
- —
Personal DTI + credit; lowest rate.
DSCR
20% down · 8.5% · 30yr
- Down + closing
- —
- Monthly P&I
- —
- Monthly cashflow
- —
- DSCR
- —
- Eligible?
- —
No personal income docs; deal must DSCR.
Hard money
10% down · 12.0% · 12mo
- Down + closing
- —
- Monthly P&I
- —
- Monthly cashflow
- —
- DSCR
- —
- Eligible?
- —
Short-term bridge; refi at stabilization.
Rent comps 40 comps
| Address | Beds | Baths | Sqft | Rent | $/sqft | DOM | Units | Dist |
|---|---|---|---|---|---|---|---|---|
| 1940 Haynie Dr Unit Main Augusta, GA | 3.0 | 1.5 | 840 | $1,500 | $1.79 | 23d | 1 | 0.06mi |
| 1940 Haynie Dr Unit 2 Augusta, GA | 1.0 | 1.0 | 840 | $850 | $1.01 | 23d | 1 | 0.06mi |
| 1940 Haynie Dr Unit Main Augusta, GA | 3.0 | 1.5 | 840 | $1,500 | $1.79 | 44d | 1 | 0.06mi |
| 2205 Southgate Dr Augusta, GA | 1.0–2.0 | 1.0–1.5 | 770 | $1,099 | $1.43 | 14d | 7 | 0.48mi |
| 2730 Lakewood Dr Augusta, GA | 3.0 | 1.5 | 1460 | $1,550 | $1.06 | 23d | 1 | 0.64mi |
| 2730 Lakewood Dr Augusta, GA | 3.0 | 1.5 | 1460 | $1,550 | $1.06 | 44d | 1 | 0.64mi |
| 2125 Kennedy Dr Augusta, GA | 2.0 | 1.0 | 750 | $795 | $1.06 | 14d | 1 | 0.71mi |
| 2020 Garr Dr Augusta, GA | 3.0 | 1.0 | 1100 | $1,200 | $1.09 | 14d | 1 | 0.71mi |
| 2128 Roosevelt Dr Augusta, GA | 3.0 | 2.0 | 1050 | $1,340 | $1.28 | 23d | 1 | 0.73mi |
| 2726 Landing Loop Dr Augusta, GA | 3.0 | 2.0 | 1008 | $1,025 | $1.02 | 44d | 1 | 0.74mi |
| 2810 Thomas Ln Augusta, GA | 2.0 | 2.0 | 1030 | $975 | $0.95 | 44d | 6 | 0.80mi |
| 2663 Thomas Ln Augusta, GA | 2.0–3.0 | 2.0–2.5 | 1250 | $1,063 | $0.85 | 23d | 3 | 0.85mi |
| 2816 Thomas Ln Augusta, GA | 2.0 | 2.0 | 960 | $950 | $0.99 | 14d | 1 | 0.87mi |
| 2820 Thomas Ln Augusta, GA | 2.0 | 2.0 | 960 | $950 | $0.99 | 44d | 1 | 0.90mi |
| 2818 Gordy Rd Augusta, GA | 2.0 | 1.0 | 888 | $825 | $0.93 | 44d | 1 | 0.93mi |
| 2201 Walden Dr Unit DRIVEA2 Augusta, GA | 2.0 | 1.5 | 1063 | $1,050 | $0.99 | 44d | 1 | 0.93mi |
| 2201 Walden Dr Unit DRIVEB2 Augusta, GA | 2.0 | 1.5 | 1063 | $1,100 | $1.03 | 44d | 1 | 0.93mi |
| 2201 Walden Dr Augusta, GA | 2.0 | 1.0 | 1063 | $1,100 | $1.03 | 44d | 1 | 0.93mi |
| 1914 1/2 Kratha Dr Augusta, GA | 2.0 | 1.0 | 1400 | $995 | $0.71 | 14d | 1 | 0.94mi |
| 2824 Thomas Ln Augusta, GA | 2.0 | 2.0 | 960 | $950 | $0.99 | 44d | 1 | 0.94mi |
| 2826 Thomas Ln Augusta, GA | 2.0 | 1.0 | 1456 | $1,095 | $0.75 | 23d | 1 | 0.96mi |
| 2826 Thomas Ln Augusta, GA | 2.0 | 1.0 | 1456 | $1,095 | $0.75 | 44d | 1 | 0.96mi |
| 526 Richmond Hill Rd W Augusta, GA | 1.0 | 1.0 | 770 | $810 | $1.05 | 14d | 1 | 0.99mi |
| 2219 Walden Dr Unit A6 Augusta, GA | 2.0 | 1.0 | 800 | $850 | $1.06 | 23d | 1 | 1.02mi |
| 2240 Walden Dr Augusta, GA | 3.0 | 2.0 | 1107 | $1,495 | $1.35 | 23d | 1 | 1.03mi |
| 19 Trapp Ct Unit 19 Augusta, GA | 2.0 | 1.5 | 1050 | $995 | $0.95 | 44d | 1 | 1.04mi |
| 2235 Woodward Ave Augusta, GA | 2.0 | 1.0 | 773 | $895 | $1.16 | 44d | 1 | 1.05mi |
| 2339 Walden Dr Augusta, GA | 2.0 | 1.0 | 825 | $975 | $1.18 | 44d | 1 | 1.06mi |
| 2311 Walden Dr Unit E1 Augusta, GA | 2.0 | 1.0 | 960 | $875 | $0.91 | 23d | 1 | 1.07mi |
| 2311 Walden Dr Augusta, GA | 2.0 | 1.0 | 960 | $900 | $0.94 | 23d | 1 | 1.07mi |
| 2851 Rocky Creek Rd Augusta, GA | 2.0 | 1.0 | 1171 | $1,100 | $0.94 | 44d | 1 | 1.07mi |
| 2851 Rocky Creek Rd Augusta, GA | 2.0 | 1.0 | 1171 | $1,100 | $0.94 | 23d | 1 | 1.07mi |
| 2311 Walden Dr Unit A2 Augusta, GA | 2.0 | 1.0 | 960 | $950 | $0.99 | 44d | 1 | 1.07mi |
| 2120 Whitney South Dr Augusta, GA | 2.0 | 2.0 | 1118 | $1,500 | $1.34 | 44d | 1 | 1.11mi |
| 2120 Whitney South Dr Augusta, GA | 2.0 | 2.0 | 1118 | $1,500 | $1.34 | 44d | 1 | 1.11mi |
| 2114 Vandivere Rd Unit B Augusta, GA | 2.0 | 1.0 | 810 | $950 | $1.17 | 23d | 1 | 1.12mi |
| 2114 Vandivere Rd Unit B Augusta, GA | 2.0 | 1.0 | 810 | $950 | $1.17 | 14d | 1 | 1.12mi |
| 2114 Vandivere Rd Unit B Augusta, GA | 2.0 | 1.0 | 810 | $950 | $1.17 | 44d | 1 | 1.12mi |
| 2230 Hollis Rd Augusta, GA | 2.0 | 1.0 | 1000 | $975 | $0.97 | 44d | 1 | 1.20mi |
| 1719 Kissingbower Rd Augusta, GA | 2.0 | 1.0 | 1185 | $1,195 | $1.01 | 21d | 1 | 1.22mi |
Listing history 7 events
-
2026-03-13soldstatus $113,000
-
2026-02-07status Pending
-
2026-02-07historical
-
2026-02-07historical
-
2026-02-04price $109,900
-
2026-01-08$119,000 Active
-
2026-01-08$109,900
ⓘ Source: listings_history table (triggers on properties + properties_extension) + one-shot
backfill from property_details.listing_events for pre-trigger history.
Tax reassessment forecast GA · Resets to sale price
- Current annual tax
- $1,115 · $93/mo
- Projected year-2 tax
- $1,115 · $93/mo
- Expected delta
- $0/yr ($0/mo · 0.0%)
ⓘ Screening estimate from a state-policy table — verify with the county assessor before closing.
Climate risk First Street
- Flood 1/10 Low FEMA zone X (unshaded) · 0% chance over 30 yrs
- Wildfire 1/10 Low
- Heat 7/10 Severe 7 d/yr ≥107°F today · 17 d/yr by 30 yrs out
- Wind 6/10 Major 67% chance of damaging wind over 30 yrs
- Air quality 3/10 Moderate 3 unhealthy d/yr today · 3 by 30 yrs out
Nearby sold comps map
Loading sold comps map…
Walkable amenities ~0.75 mi
Loading nearby amenities…
Taxation est. · year 1
- Rental income
- $14,667
- − Mortgage interest
- −$6,156
- − Property taxes
- −$1,115
- − Insurance
- −$550
- − Repairs & maintenance
- −$1,173
- − Management
- −$1,173
- − Depreciation
- −$3,197
- Taxable income
- $1,302
- Est. tax owed @ 24.0%
- −$313
- After-tax cash flow
- $2,694/yr
For passive investors: Depreciation is non-cash, so a rental often shows a tax loss while cash-flowing — sheltering income. Rental losses are passive: they offset passive income freely, and up to $25,000/yr can offset ordinary (W-2) income if you actively participate and your MAGI is under $100k (phasing out to $0 by $150k); unused losses carry forward. On sale, claimed depreciation is recaptured at up to 25%, and gains may owe capital-gains tax (a 1031 exchange can defer both). Figures are a year-1 estimate at your 24.0% rate — not tax advice; consult a CPA.
Schools (NCES district)
- District
- Richmond County
- NCES district ID
- 1304380
- Math proficiency
- 12% ▼ -9.00%
- Reading proficiency
- 20% ▼ -6.00%
- Median HH income
- $38,069
- Composite
- 13.43/100
- National rank
- #9524
- State rank
- #154 of 174 in GA
Livability — Augusta-Richmond County consolidated government (balance)
No livability data for this city. (Only ~50 U.S. cities are tracked.)
Census & demographics
- Census place
- Augusta-Richmond County consolidated government (balance), GA
- County
- Richmond County · 190,917 people
- City population
- 154,035
- Metro
- Augusta-Richmond County, GA-SC
- Population (ZIP)
- 23,400
- Household income
- $46,696
- Rent vs Own
- Severe rent burden
- 1594.0
Population outlook (Richmond County) Hauer SSP2
- Today (2025)
- 200,753 people
- By 2030
- 200,232 · -0.3%
- By 2040
- 196,813 · -2.0%
- By 2050
- 190,347 · -5.2%
- By 2075
- 172,496 · -14.1%
- By 2100
- 146,284 · -27.1%
Race, ethnicity, and origin ACS 2023
- Neighborhood character
- Diverse neighborhood (Simpson 0.61)
- Race & ethnicity
- Black 47% White 41% Hispanic / Latino 6% Two or more races 6% Asian 2%
- Hispanic origin (detail)
- Mexican 1%
- Common ancestry
- Italian 1% Slovak 1% Romanian 1%
- Foreign-born
- 3% · Canada, South Korea, Jamaica
- Languages at home
- 93% English-only · Spanish 4% Korean 1%
Political lean MEDSL · Richmond
- 2024 margin
- Solid D (+36.1) · D 67.8% · R 31.7%
- 2008→2024 swing
- +4.3pp toward D · 2008: 31.8pp · 2024: 36.1pp
- All cycles
- 2024: D+36.1 2020: D+37.2 2016: D+32.4 2012: D+33.8 2008: D+31.8
Not yet ingested
- Civics
- —
Market trends
- HPI YoY
- ▼ -211.97%
- Current HPI
- 199.0807
- Rent YoY
- ▲ 4.29%
- Metro
- Augusta-Richmond County, GA-SC
- State GDP YoY
- ▲ 2.66%
- F500 in state
- 28
Industry mix (Fortune 500 HQ in GA)
| Industry | F500 HQs | Revenue |
|---|---|---|
| Paper / Packaging | 2 | $29B |
|
||
| Retail | 1 | $160B |
|
||
| Transportation / Logistics | 1 | $91B |
|
||
| Airlines | 1 | $62B |
|
||
| Consumer Goods | 1 | $47B |
|
||
| Utilities | 1 | $25B |
|
||
Price history
-5.0% since first listed7 events — show timeline
- 2026-03-13 Sold (Public Records) $113,000 Public Records
- 2026-02-07 Pending — Hive MLS
- 2026-02-07 Listing Removed — Hive MLS
- 2026-02-07 Listing Removed — Hive MLS
- 2026-02-04 Price Changed $109,900 Hive MLS
- 2026-01-08 Listed $109,900 Hive MLS
- 2026-01-08 Listed $119,000 Hive MLS
Property tax history
+2.6%/yrLatest (2025): $1,115 · +1.4% YoY. Source: county tax records.
Cash-flow waterfall
monthlySold comps — $/sqft
last 12 mo · ≤1 miLoading sold comps…