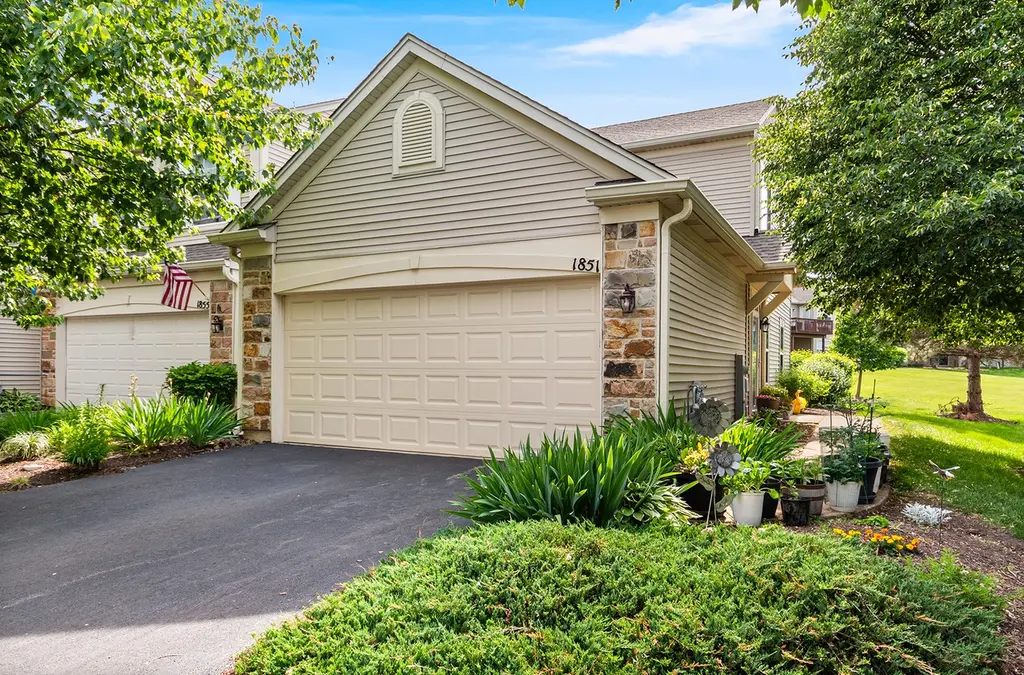
1851 Wisteria Dr · Aurora, IL
Flood risk 4/10 · Minor
- FEMA flood zone
- X (unshaded)
- Chance of flooding over 30 yrs
- 0.22%
- Est. flood insurance / yr
- $507 – $1,088
Fire risk 1/10 · Minimal
- Est. fire insurance / yr
- $804 – $1,492
Heat risk 3/10 · Minor
- Hot days now (above 103°F)
- 7 days/yr
- Hot days in 30 yrs
- 15 days/yr
Wind risk 2/10 · Minimal
- Chance of severe wind over 30 yrs
- 1.0%
Air-quality risk 3/10 · Minor
- Unhealthy air days now
- 3 days/yr
- Unhealthy air days in 30 yrs
- 4 days/yr
Risk factors via First Street. Map © Google.
Why this score? — see what drove the D- grade
The composite is a weighted blend of 9 inputs, each scored 0–100. Each bar is that input's sub-score; the figure is the points it added to the 100-point composite (weight × sub-score).
- Appreciation +10.0/10.0
- Cash flow +6.7/30.0
- Livability +3.8/5.0
- ARV discount +3.7/15.0
- 1% rule +3.1/10.0
- Schools +3.1/10.0
- Rent growth +2.5/5.0
- Condition / age +2.5/5.0
- DSCR +0.9/10.0
$290,000
🖨 Deal sheet (PDF) 📄 Offer letter ✓ Due diligence
Listing remarks MLS
Come See this Amazing End Unit 1-Story Ranch Townhome that is ideally positioned in the sought after Misty Creek subdivision ~ You will love the private entrance to the home! This Gorgeous property has two bedrooms, two full baths, and a large two car garage. The property has been meticulously maintained and boasts many updates and offers great space! Beautiful newer Hardwood floors! The gracious foyer welcomes you to the sun-filled spacious living room. The kitchen boasts 42 inch cabinets, newer counters & backsplash plus under cabinet lighting & opens to a fantastic breakfast area/dining rm with sliders that lead to a private patio. Great sized master suite is complete with a walk-in closet and private bath. The 2nd bedroom has many options for its use! The home also has another full bath found off the main hallway. The sizable laundry/utility room presents more storage possibilities. Out back, you'll find the large patio providing lots of space for gatherings and outdoor entertaining. This area opens to a common area providing privacy to the residence. This great home is in the 308 Oswego school district and is a close to parks, walking and biking trails, great shopping, restaurants, Rte. 59 Metra station & I-88. You are an easy drive to everything you need. See for yourself all this home has to offer.
Key facts
- Large foyer
- Private patio
- Private entrance
Tags
Property features AI
Finance
- HOA & community: Monthly association fee of $215; Association fee covers insurance, exterior maintenance, lawn care and snow removal; Pets allowed (cats and dogs)
Exterior
- Parking: Attached garage (2 spaces); Total 2 parking spaces
- Utilities: Public water service; Public sewer service
- Home design: Attached single — townhouse ranch; Entry level on level 1; Fee simple ownership with homeowners association
- Construction: Built approximately 21–25 years ago; Vinyl siding and stone exterior
- Exterior features: Vinyl siding with stone accents; Public water; Public sewer
Interior
- Kitchen: Range; Microwave; Dishwasher; Refrigerator; Kitchen with eating area (10 x 10)
- Bedrooms: Master bedroom (Main level, 16 x 12) with full bath; Second bedroom (Main level, 12 x 11); Additional bedrooms listed
- Flooring: Hardwood flooring in dining area, kitchen and living room; Carpet in bedrooms; Ceramic tile in foyer; Vinyl in laundry
- Bathrooms: 2 full bathrooms
- Heating & cooling: Natural gas forced-air heating; Central air conditioning
- Interior features: 5 total rooms; Foyer; Dining area combined with kitchen; Family room; Living room (22 x 13)
- Laundry & utility: In-unit laundry with gas dryer hookup; Washer; Dryer; Disposal
Neighborhood map
What this means for you Summary
Snapshot
- This is a 2-bed/2.0-bath townhouse listed at $290k.
Deal economics
- At list price, monthly cash flow is $-465 ($-6k/yr) — negative.
- To cash-flow at today's rent, offer at most $208k (28.3% below list).
- To meet the 1% rule (rent ≥ 1% of price), the offer needs to be $234k (19.4% below list).
- Recommended offer: $208k (28.3% below list) — sets the bar for cash-flow.
- Cap rate 4.4% vs local median 3.5% in Aurora — meaningfully above typical; check what's discounted (condition, days-on-market, listing class) to confirm the premium yield is real.
Location & tenants
- Location reads 75/100 on livability (#232 in IL, #4,272 nationally) — a middle-class / working-renter tenant base. Strengths: commute A+, housing A+, employment A-; Watch: amenities F, health & safety F.
- CUSD 308 (suburban): math 29% / reading 34% proficiency, ranked #179 of 620 in IL (top 29%) — families likely to look elsewhere, expect single-tenant / working-renter base with shorter leases; only 20% free/reduced lunch — higher-income household profile.
- Zoned schools: The Wheatlands Elementary School (math 39% / reading 46%, grade F, #329 of 2,056 statewide, top 16%, 550 students, 0% FRL); Bednarcik Junior High School (math 39% / reading 38%, grade F, #154 of 665 statewide, top 24%, 571 students, 0% FRL); Oswego East High School (math 35% / reading 40%, grade F, #104 of 693 statewide, top 15%, 2,836 students, 0% FRL) — zoned schools average 0% FRL vs 20% district-wide (20 pts lower); this property's tenant base skews higher-income than the district average.
- Market conditions: 122 active listings in the ZIP; 19 comparable units currently listed for rent nearby; rentals at typical pace (median 20d on market — plan ~3-4 weeks tenant-placement turnaround); high-income renter base; 706 units permitted in Kendall County in 2024 (263 in 5+ unit buildings).
Forward outlook
- In year one you build about $31k of equity ($2k loan paydown + $29k appreciation (10.0% local appreciation)).
- Kendall County population projected at +20% by 2050 — long-run rental-demand tailwind backs the buy-and-hold thesis.
- By year 2, paydown + projected appreciation supports a ~$50k cash-out refi (75% LTV) — recoverable capital for the next deal without selling this one.
Negotiation context
- It's been on market 21 days — a 2% lower offer ($286k) is reasonable based on typical stale-listing flexibility.
- 3 sale attempts since 15y ago with the ask held roughly flat each time — persistent listings suggest the price (not the market) is what's stuck; bring a comps-based counter.
- Current owner paid $210k; 38% above their basis — modest negotiation headroom, anchor on the comps not their cost.
Questions for the listing agent
- What do current leases actually rent for vs. the listed asking? Can we see a recent rent roll and the last 12 months of T-12 income?
- What does the HOA fee cover, when was the last increase, and are there any pending special assessments or reserve-fund shortfalls?
- Is there a deadline driving the sale (1031 exchange, divorce, estate, relocation)? That informs how much negotiation room exists.
- Schools are F-rated, which usually means shorter tenancies and higher turnover. Who's the typical renter profile here, and what's been the actual vacancy rate?
- The area grade is low — what's the realistic commute time and amenity access for the typical tenant pool here? Any planned neighborhood developments (good or bad) we should know about?
- What's the average days-on-market for RENTAL listings here right now (not sales)? A rising rental-DOM trend means longer vacancies and softer asking-rent achievability than the comps imply.
- What's the recent tenant-quality profile in this submarket — average credit score on applications, eviction rate, late-payment / NSF rate, and stable-employment percentage? A property-management company in the area should have these aggregated.
- How much new for-sale + rental construction is in the pipeline within 1–3 miles? Heavy new supply typically softens prices + rents 12–24 months out; constrained supply supports both.
Investment metrics
- 1% rule
- 0.81% ✗
- Cap rate
- 4.37%
- Cash-on-cash
- -6.87%
- DSCR
- 0.69
- GRM
- 10.3
CMA / ARV
- ARV (on-the-fly)
- $267,472
- Comps found
- 10
Show comp detail 10 sales within ~0.75 mi
| Address | Dist | Beds/Ba | Sqft | Sold | Price | $/sf | Match |
|---|---|---|---|---|---|---|---|
| 1933 Misty Ridge Ln #0 | 0.13mi | 2/2.0 | 1,169 (+0%) | 24mo | $255,000 | $218 | 74 |
| 1955 Misty Ridge Ct | 0.18mi | 2/1.0 | 1,168 (0%) | 21mo | $250,000 | $214 | 70 |
| 1648 Fredericksburg Ln | 0.58mi | 2/2.0 | 1,168 (0%) | 10mo | $268,000 | $229 | 65 |
| 1657 Fredericksburg Ln #1657 | 0.62mi | 2/2.0 | 1,168 (0%) | 11mo | $275,000 | $235 | 62 |
| 1611 Fredericksburg Ln #0 | 0.66mi | 2/1.0 | 1,168 (0%) | 6mo | $266,000 | $228 | 60 |
| 2321 Twilight Dr | 0.70mi | 2/2.0 | 1,165 (-0%) | 10mo | $315,000 | $270 | 59 |
| 2330 Twilight Dr | 0.68mi | 2/3.0 | 1,165 (-0%) | 6mo | $295,000 | $253 | 58 |
| 1636 Fredericksburg Ln | 0.59mi | 2/2.0 | 1,168 (0%) | 20mo | $265,000 | $227 | 55 |
| 2325 Summerlin Dr #2325 | 0.72mi | 2/2.0 | 1,168 (0%) | 17mo | $270,000 | $231 | 52 |
| 1600 Fredericksburg Ln | 0.66mi | 2/2.0 | 1,168 (0%) | 24mo | $255,555 | $219 | 50 |
Match score weights: distance 35% · size 25% · config 20% · recency 20%. Top-matched comps best support the ARV.
Projected returns pro-forma
10.0% appreciation · 3.0% rent growth · sell at horizon
- IRR
- 19.5%
- Equity multiple
- 2.58×
- Total profit
- $128,552
- Equity at exit
- $261,255
- IRR
- 17.9%
- Equity multiple
- 5.95×
- Total profit
- $402,300
- Equity at exit
- $563,406
Cash invested: $81,200 (down + closing). Projections, not guarantees.
Landlord ↔ Tenant lean methodology
- Overall (STATE)
- 43 Moderately Tenant-Leaning
- State Illinois
- 43 Moderately Tenant-Leaning · D+7
- County
- — inherits STATE
- City
- — inherits STATE
ZIP-level market 60503
- Home prices YoY
- 4.6%
- Active inventory
- 122
- Price-to-rent
- 10.3×
Monthly cashflow live
- Estimated rent
- $2,338 high interval (Pro) →
- Mortgage (P&I)
- −$1,521
- Tax from tax record
- −$456 /mo · $5,468/yr
- Insurance
- −$121
- HOA
- −$215
- Vacancy / Maint / Mgmt
- −$491
- Net cashflow
- $-465
Break-even live
Sensitivity live
| Price | -10% $-301 | -5% $-383 | +0% $-465 | +5% $-547 | +10% $-629 |
|---|---|---|---|---|---|
| Rent | -10% $-650 | -5% $-557 | +0% $-465 | +5% $-373 | +10% $-280 |
| Rate | -1.0pp $-319 | -0.5pp $-391 | base $-465 | +0.5pp $-540 | +1.0pp $-617 |
UW: 25.0% down · 7.5% · 30yr · 1.5% tax · 5.0% vac · 8.0% maint · 8.0% mgmt
Financing live
Cash to close
- Down payment
- $72,500
- Closing costs
- $8,700
- Reserves months
- —
- Total cash needed
- —
Loan-product check · same deal, 3 products live
Conventional
25% down · 7.5% · 30yr
- Down + closing
- —
- Monthly P&I
- —
- Monthly cashflow
- —
- DSCR
- —
- Eligible?
- —
Personal DTI + credit; lowest rate.
DSCR
20% down · 8.5% · 30yr
- Down + closing
- —
- Monthly P&I
- —
- Monthly cashflow
- —
- DSCR
- —
- Eligible?
- —
No personal income docs; deal must DSCR.
Hard money
10% down · 12.0% · 12mo
- Down + closing
- —
- Monthly P&I
- —
- Monthly cashflow
- —
- DSCR
- —
- Eligible?
- —
Short-term bridge; refi at stabilization.
Rent comps 19 comps
| Address | Beds | Baths | Sqft | Rent | $/sqft | DOM | Units | Dist |
|---|---|---|---|---|---|---|---|---|
| 1847 Clubhouse Dr Aurora, IL | 1.0–3.0 | 1.0–2.0 | 1238 | $2,254 | $1.82 | 1d | 23 | 0.59mi |
| 1636 Fredericksburg Ln Aurora, IL | 2.0 | 2.0 | 1168 | $2,250 | $1.93 | 45d | 1 | 0.61mi |
| 669 Lincoln Station Dr #669 Oswego, IL | 3.0 | 2.5 | 1315 | $2,250 | $1.71 | 22d | 1 | 0.85mi |
| 616 Lincoln Station Dr Oswego, IL | 2.0 | 2.5 | 1318 | $2,250 | $1.71 | 26d | 1 | 0.87mi |
| 1419 Farrington Ln Aurora, IL | 3.0 | 1.5 | 1476 | $2,959 | $2.00 | 4d | 1 | 0.88mi |
| 640 Lincoln Station Dr Oswego, IL | 2.0 | 2.5 | 1318 | $2,100 | $1.59 | 45d | 1 | 0.89mi |
| 644 Lincoln Station Dr #644 Oswego, IL | 3.0 | 2.5 | 1318 | $2,250 | $1.71 | 45d | 1 | 0.89mi |
| 690 Lincoln Station Dr Oswego, IL | 3.0 | 2.5 | 1318 | $2,100 | $1.59 | 4d | 1 | 0.90mi |
| 652 Lincoln Station Dr Oswego, IL | 3.0 | 2.5 | 1500 | $1,999 | $1.33 | 5d | 1 | 0.90mi |
| 652 Lincoln Station Dr Oswego, IL | 3.0 | 2.5 | 1500 | $1,999 | $1.33 | 19d | 1 | 0.90mi |
| 2516 Hillsboro Blvd Aurora, IL | 2.0 | 2.5 | 1482 | $2,300 | $1.55 | 19d | 1 | 0.92mi |
| 2598 Hillsboro Blvd Aurora, IL | 3.0 | 2.5 | 1482 | $2,395 | $1.62 | 22d | 1 | 1.05mi |
| 826 Terrace Lake Dr Aurora, IL | 2.0 | 1.5 | 1090 | $2,132 | $1.96 | 0d | 9 | 1.31mi |
| 1111 Brunswick Ln Aurora, IL | 3.0 | 2.0 | 1159 | $2,200 | $1.90 | 8d | 1 | 1.39mi |
| 1111 Brunswick Ln Aurora, IL | 3.0 | 1.5 | 1159 | $2,200 | $1.90 | 14d | 1 | 1.39mi |
| 1914 Spinnaker Ct Aurora, IL | 3.0 | 2.5 | 1412 | $3,000 | $2.12 | 45d | 1 | 1.43mi |
| 337 Devoe Dr #337 Oswego, IL | 3.0 | 2.5 | 1500 | $2,600 | $1.73 | 26d | 1 | 1.44mi |
| 1175 Reading Dr Montgomery, IL | 1.0–2.0 | 1.0–2.0 | 947 | $2,325 | $2.46 | 0d | 20 | 1.45mi |
| 1860 Middlebury Dr Unit 1860 Aurora, IL | 2.0 | 2.5 | 1471 | $2,450 | $1.67 | 21d | 1 | 1.47mi |
HOA detail
- Monthly dues
- $215 · $2,580/yr
Listing history 16 events
-
2026-06-22price $290,000 Active 21 DOM
-
2026-06-21days on market $295,000 Active 21 DOM
-
2026-06-18days on market $295,000 Active 18 DOM
-
2026-06-17days on market $295,000 Active 17 DOM
-
2026-06-16days on market $295,000 Active 16 DOM
-
2026-06-15days on market $295,000 Active 15 DOM
-
2026-06-13days on market $295,000 Active 13 DOM
-
2026-06-10price $295,000 Active 9 DOM
-
2026-06-09days on market $300,000 Active 9 DOM
-
2026-06-08days on market $300,000 Active 8 DOM
-
2026-06-07days on market $300,000 Active 7 DOM
-
2026-06-04days on market $300,000 Active 4 DOM
-
2026-06-03days on market $300,000 Active 3 DOM
-
2026-06-02days on market $300,000 Active 2 DOM
-
2026-06-01remarks 695-char remark
-
2026-06-01$300,000 Active 1 DOM
ⓘ Source: listings_history table (triggers on properties + properties_extension) + one-shot
backfill from property_details.listing_events for pre-trigger history.
Tax reassessment forecast IL · Partial reset (capped growth)
- Current annual tax
- $5,468 · $456/mo
- Projected year-2 tax
- $6,026 · $502/mo
- Expected delta
- +$557/yr (+$46/mo · 10.2%)
ⓘ Screening estimate from a state-policy table — verify with the county assessor before closing.
Climate risk First Street
- Flood 4/10 Moderate FEMA zone X (unshaded) · 22% chance over 30 yrs
- Wildfire 1/10 Low
- Heat 3/10 Moderate 7 d/yr ≥103°F today · 15 d/yr by 30 yrs out
- Wind 2/10 Low 100% chance of damaging wind over 30 yrs
- Air quality 3/10 Moderate 3 unhealthy d/yr today · 4 by 30 yrs out
Nearby sold comps map
Loading sold comps map…
Walkable amenities ~0.75 mi
Loading nearby amenities…
Taxation est. · year 1
- Rental income
- $28,061
- − Mortgage interest
- −$16,245
- − Property taxes
- −$5,468
- − Insurance
- −$1,450
- − Repairs & maintenance
- −$2,245
- − Management
- −$2,245
- − HOA
- −$2,580
- − Depreciation
- −$8,436
- Taxable loss
- −$10,608
- Est. tax savings @ 24.0%
- +$2,546
- After-tax cash flow
- $-3,034/yr
For passive investors: Depreciation is non-cash, so a rental often shows a tax loss while cash-flowing — sheltering income. Rental losses are passive: they offset passive income freely, and up to $25,000/yr can offset ordinary (W-2) income if you actively participate and your MAGI is under $100k (phasing out to $0 by $150k); unused losses carry forward. On sale, claimed depreciation is recaptured at up to 25%, and gains may owe capital-gains tax (a 1031 exchange can defer both). Figures are a year-1 estimate at your 24.0% rate — not tax advice; consult a CPA.
Schools (NCES district)
- District
- CUSD 308
- NCES district ID
- 1730270
- Math proficiency
- 29% ▼ -10.00%
- Reading proficiency
- 34% ▼ -9.00%
- Median HH income
- $89,945
- Composite
- 31.25/100
- National rank
- #6028
- State rank
- #179 of 620 in IL
Livability — Aurora
- Score
- 75/100
- State rank
- #232
- US rank
- #4272
Category grades
Schools grade is shown separately in the Schools card above.
Census & demographics
- Census place
- Aurora, IL
- County
- Will County · 412,448 people
- City population
- 186,692
- Metro
- Chicago-Naperville-Elgin, IL-IN-WI
- Population (ZIP)
- 16,789
- Household income
- $136,726
- Rent vs Own
- Severe rent burden
- 19.0
Population outlook (Kendall County) Hauer SSP2
- Today (2025)
- 138,283 people
- By 2030
- 144,935 · +4.8%
- By 2040
- 156,944 · +13.5%
- By 2050
- 165,424 · +19.6%
- By 2075
- 174,715 · +26.3%
- By 2100
- 168,523 · +21.9%
Race, ethnicity, and origin ACS 2023
- Neighborhood character
- Diverse neighborhood (Simpson 0.69)
- Race & ethnicity
- White 49% Asian 19% Black 14% Hispanic / Latino 14% Two or more races 7%
- Hispanic origin (detail)
- Mexican 11% Puerto Rican 1%
- Common ancestry
- Romanian 10% Scandinavian 3% Italian 1%
- Foreign-born
- 22% · Canada, China, Vietnam
- Languages at home
- 68% English-only · Other Indo-European 11% Spanish 8% Other Asian/Pacific 4%
Political lean MEDSL · Kendall
- 2024 margin
- Toss-up / Even · D 50.0% · R 48.5% · Other 1.6%
- 2008→2024 swing
- -5.7pp toward R · 2008: 7.2pp · 2024: 1.5pp
- All cycles
- 2024: D+1.5 2020: D+5.7 2016: R+1.5 2012: R+4.1 2008: D+7.2
Not yet ingested
- Civics
- —
Market trends
- HPI YoY
- ▲ 10.31%
- Current HPI
- 232.382
- Rent YoY
- —
- Metro
- Chicago-Naperville-Elgin, IL-IN-WI
- State GDP YoY
- ▲ 1.59%
- F500 in state
- 60
Industry mix (Fortune 500 HQ in IL)
| Industry | F500 HQs | Revenue |
|---|---|---|
| Insurance | 4 | $201B |
|
||
| Consumer Goods | 4 | $87B |
|
||
| Industrial Machinery | 3 | $64B |
|
||
| Healthcare | 2 | $55B |
|
||
| Retail / Pharmacy | 1 | $148B |
|
||
| Agriculture / Food | 1 | $86B |
|
||
Price history
+123.9% since first listed11 events — show timeline
- 2026-06-01 Listed $300,000 MRED as Distributed by MLS Grid
- 2022-05-18 Sold (Public Records) $210,000 Public Records
- 2022-05-10 Sold (MLS) $210,000 MRED as Distributed by MLS Grid
- 2022-02-15 Contingent — MRED as Distributed by MLS Grid
- 2022-02-05 Pending — MRED as Distributed by MLS Grid
- 2022-01-29 Listed $210,000 MRED as Distributed by MLS Grid
- 2011-08-10 Sold (Public Records) $120,000 Public Records
- 2011-06-30 Sold (MLS) $120,000 MRED as Distributed by MLS Grid
- 2011-05-25 Contingent — MRED as Distributed by MLS Grid
- 2011-05-07 Price Changed $129,000 MRED as Distributed by MLS Grid
- 2011-04-02 Listed $134,000 MRED as Distributed by MLS Grid
Property tax history
+1.8%/yrLatest (2024): $5,468 · +5.2% YoY. Source: county tax records.
Cash-flow waterfall
monthlySold comps — $/sqft
last 12 mo · ≤1 miLoading sold comps…