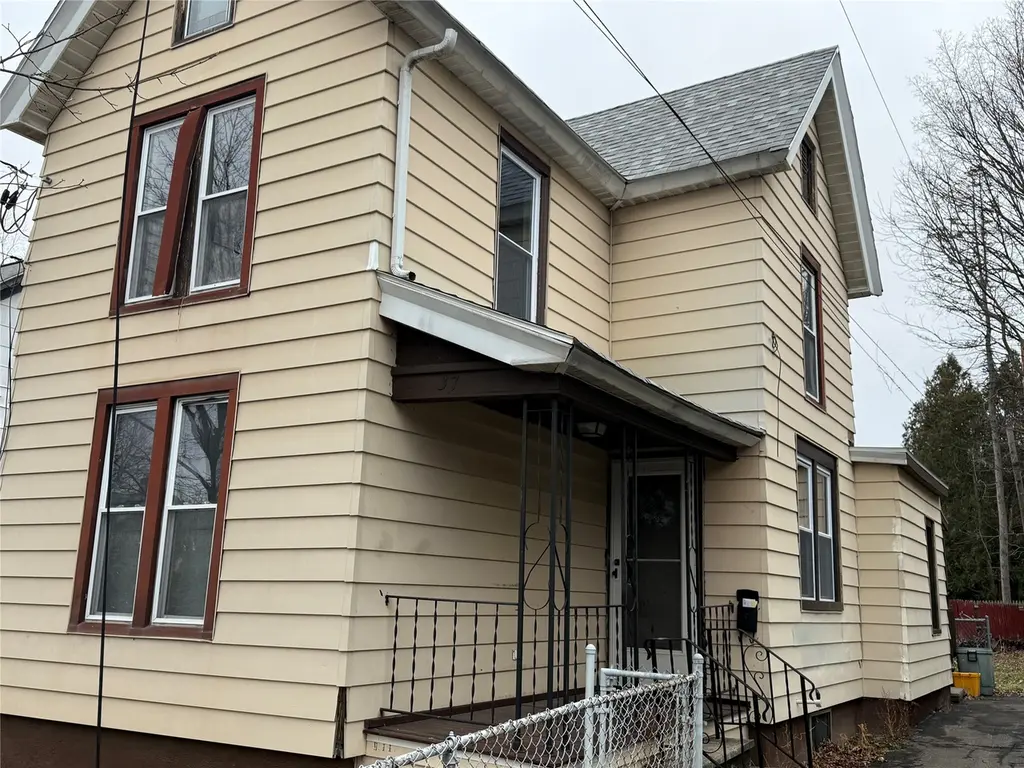
37 Hayes Street St · Binghamton, NY
Flood risk 7/10 · Major
- FEMA flood zone
- X (shaded)
- Chance of flooding over 30 yrs
- 0.95%
- Est. flood insurance / yr
- $473 – $860
Fire risk 1/10 · Minimal
- Est. fire insurance / yr
- $691 – $1,283
Heat risk 3/10 · Minor
- Hot days now (above 92°F)
- 7 days/yr
- Hot days in 30 yrs
- 16 days/yr
Wind risk 2/10 · Minimal
- Chance of severe wind over 30 yrs
- 2.0%
Air-quality risk 2/10 · Minimal
- Unhealthy air days now
- 0 days/yr
- Unhealthy air days in 30 yrs
- 1 days/yr
Risk factors via First Street. Map © Google.
Why this score? — see what drove the C grade
The composite is a weighted blend of 9 inputs, each scored 0–100. Each bar is that input's sub-score; the figure is the points it added to the 100-point composite (weight × sub-score).
- Cash flow +15.0/30.0
- Appreciation +10.0/10.0
- ARV discount +8.1/15.0
- 1% rule +6.1/10.0
- DSCR +4.6/10.0
- Livability +3.9/5.0
- Schools +3.0/10.0
- Rent growth +2.5/5.0
- Condition / age +2.5/5.0
$155,000
🖨 Deal sheet 📄 Offer letter ✓ Due diligence
Listing remarks MLS
Welcome to 37 Hayes Street, a well-kept home with modern touches that make it comfortable and move-in ready. Recent improvements include a new roof along with updated plumbing and electrical systems for added peace of mind. The fenced yard and covered back deck serve as a nice bonus for outdoor enjoyment. Conveniently located near local amenities, the home offers easy access to everyday needs.
Key facts
- Fenced yard
- Covered back deck
- New roof
Tags
Neighborhood map
What this means for you Summary
Snapshot
- This is a 3-bed/1.0-bath single-family listed at $155k.
Deal economics
- At list price, monthly cash flow is $-9 ($-105/yr) — negative.
- To cash-flow at today's rent, offer at most $153k (1.0% below list).
- Meets the 1% rule at list price ($2k rent vs $155k).
- Recommended offer: $141k (9.0% below list) — sets the bar for market timing.
Location & tenants
- Location reads 78/100 on livability (#174 in NY, #2,710 nationally) — a middle-class / working-renter tenant base. Strengths: amenities A+, commute A+, cost of living A+; Watch: schools D, crime F, employment F.
- Binghamton City School District (urban): math 30% / reading 44% proficiency, ranked #557 of 590 in NY (top 94%) — families likely to look elsewhere, expect single-tenant / working-renter base with shorter leases; 61% free/reduced lunch — lower-income household profile, screen leases tightly.
- Market conditions: 112 active listings in the ZIP; 9 comparable units currently listed for rent nearby; rentals lingering (median 44d on market — plan ~5-8 weeks vacancy on turnover, expect pricing pressure); 56% of comp listings sitting > 30 days — soft ceiling on asking rent; 340 units permitted in Broome County in 2024 (269 in 5+ unit buildings).
- This rent runs 31% of the median local income ($66k/yr) — at the standard rent-burdened threshold; future hikes will face affordability resistance.
Forward outlook
- In year one you build about $17k of equity ($1k loan paydown + $16k appreciation (10.0% local appreciation)).
- Broome County population projected at -13% by 2050 — secular population decline; favor cash flow + early exit over multi-decade hold.
- At projected returns (10.0% appreciation + 3.0% rent growth), your $43k cash investment doubles in ~3 years — after that, you're playing with house money.
- By year 3, paydown + projected appreciation supports a ~$42k cash-out refi (75% LTV) — recoverable capital for the next deal without selling this one.
Negotiation context
- It's been on market 117 days — a 9% lower offer ($141k) is reasonable based on typical stale-listing flexibility.
- 3 sale attempts since 21y ago; this cycle's ask has dropped $9k (5%) from the opening price — seller is motivated, your offer sets the floor, not the list.
- Current owner paid $29k; list at $155k implies a 434% gain — meaningful room to come down on a strong offer.
Risks & watch-outs
- Watch-outs: property tax is 3.3% of price; flood insurance adds $56/mo; built in 1899 — expect roof / HVAC / electrical / plumbing capex.
- Climate carrying-cost: major flood risk — expect insurance premiums to compound above CPI over the hold.
Questions for the listing agent
- What do current leases actually rent for vs. the listed asking? Can we see a recent rent roll and the last 12 months of T-12 income?
- It's been on market 117 days. Have you received any prior offers? Is the seller open to a 9% concession, seller financing, or rate buy-down credit?
- Built in 1899 — when were the roof, HVAC, electrical panel, plumbing, and water heater last replaced?
- Property tax is high relative to price — has the assessment been appealed recently, and will the sale trigger a re-assessment?
- What's the actual annual flood-insurance premium (NFIP or private), and is the property in a SFHA with mandatory coverage?
- Why hasn't it sold? Are there any deal-killer items the seller is aware of (foundation, flood, title, zoning, code violations)?
- Is there a deadline driving the sale (1031 exchange, divorce, estate, relocation)? That informs how much negotiation room exists.
- Schools are D-rated, which usually means shorter tenancies and higher turnover. Who's the typical renter profile here, and what's been the actual vacancy rate?
- Crime grade is F in this area — have there been break-ins, vandalism, or insurance claims at this property in the last 3 years? What carrier currently insures it and at what premium?
- What's the average days-on-market for RENTAL listings here right now (not sales)? A rising rental-DOM trend means longer vacancies and softer asking-rent achievability than the comps imply.
- What's the recent tenant-quality profile in this submarket — average credit score on applications, eviction rate, late-payment / NSF rate, and stable-employment percentage? A property-management company in the area should have these aggregated.
- How much new for-sale + rental construction is in the pipeline within 1–3 miles? Heavy new supply typically softens prices + rents 12–24 months out; constrained supply supports both.
Investment metrics
- 1% rule
- 1.11% ✓
- Cap rate
- 6.66%
- Cash-on-cash
- 1.29%
- DSCR
- 1.06
- GRM
- 7.5
CMA / ARV
- ARV (median comp)
- $157,134
- List price
- $155,000
- Delta
- -1.36%
- Verdict
- FAIR
- Comps
- 20 within 1.0 mi
Show comp detail 12 sales within ~0.75 mi
| Address | Dist | Beds/Ba | Sqft | Sold | Price | $/sf | Match |
|---|---|---|---|---|---|---|---|
| 61 Baldwin St | 0.08mi | 3/2.0 | 1,695 (+8%) | 3mo | $185,000 | $109 | 76 |
| 96 Evans St | 0.34mi | 4/2.0 (+1) | 1,551 (-1%) | 3mo | $120,000 | $77 | 71 |
| 79 Pine St St | 0.58mi | 3/1.0 | 1,592 (+2%) | 1mo | $132,500 | $83 | 69 |
| 47 Burr Ave | 0.49mi | 4/2.0 (+1) | 1,566 (-0%) | 1mo | $115,000 | $73 | 67 |
| 14 Broome St | 0.20mi | 3/2.0 | 1,749 (+12%) | 1mo | $120,000 | $69 | 66 |
| 26 Lamont St | 0.41mi | 4/2.0 (+1) | 1,532 (-2%) | 5mo | $66,000 | $43 | 64 |
| 18 Kress St | 0.72mi | 3/1.0 | 1,620 (+3%) | 2mo | $105,000 | $65 | 60 |
| 20 Bigelow St | 0.75mi | 3/2.0 | 1,624 (+4%) | 4mo | $170,000 | $105 | 52 |
| 10 Burton Ave | 0.62mi | 3/1.5 | 1,424 (-9%) | 5mo | $130,000 | $91 | 50 |
| 220 Robinson St | 0.72mi | 4/1.5 (+1) | 1,706 (+9%) | 6mo | $90,000 | $53 | 40 |
| 40 Howard Ave | 0.70mi | 4/1.5 (+1) | 1,725 (+10%) | 5mo | $163,000 | $94 | 40 |
| 135 Susquehanna Street St | 0.71mi | 2/2.0 (-1) | 1,370 (-13%) | 1mo | $55,000 | $40 | 36 |
Match score weights: distance 35% · size 25% · config 20% · recency 20%. Top-matched comps best support the ARV.
Projected returns pro-forma
10.0% appreciation · 3.0% rent growth · sell at horizon
- IRR
- 24.2%
- Equity multiple
- 2.94×
- Total profit
- $84,068
- Equity at exit
- $139,636
- IRR
- 21.4%
- Equity multiple
- 6.72×
- Total profit
- $248,412
- Equity at exit
- $301,131
Cash invested: $43,400 (down + closing). Projections, not guarantees.
Landlord ↔ Tenant lean methodology
- Overall (STATE)
- 15 Strongly Tenant-Friendly
- State New York
- 15 Strongly Tenant-Friendly · D+10
- County
- — inherits STATE
- City
- — inherits STATE
ZIP-level market 13903
- Home prices YoY
- 4.3%
- Active inventory
- 112
- Price-to-rent
- 7.5×
Monthly cashflow live
- Estimated rent
- $1,715 high interval (Pro) →
- Mortgage (P&I)
- −$813
- Tax from tax record
- −$431 /mo · $5,170/yr
- Insurance
- −$65
- Flood insurance flood zone
- −$56 /mo · $666/yr
- HOA
- −$0
- Vacancy / Maint / Mgmt
- −$360
- Net cashflow
- $-9
Break-even live
UW: 25.0% down · 7.5% · 30yr · 1.5% tax · 5.0% vac · 8.0% maint · 8.0% mgmt
Financing live
Cash to close
- Down payment
- $38,750
- Closing costs
- $4,650
- Reserves months
- —
- Total cash needed
- —
Loan-product check · same deal, 3 products live
Conventional
25% down · 7.5% · 30yr
- Down + closing
- —
- Monthly P&I
- —
- Monthly cashflow
- —
- DSCR
- —
- Eligible?
- —
Personal DTI + credit; lowest rate.
DSCR
20% down · 8.5% · 30yr
- Down + closing
- —
- Monthly P&I
- —
- Monthly cashflow
- —
- DSCR
- —
- Eligible?
- —
No personal income docs; deal must DSCR.
Hard money
10% down · 12.0% · 12mo
- Down + closing
- —
- Monthly P&I
- —
- Monthly cashflow
- —
- DSCR
- —
- Eligible?
- —
Short-term bridge; refi at stabilization.
Rent comps 9 comps
| Address | Beds | Baths | Sqft | Rent | $/sqft | DOM | Units | Dist |
|---|---|---|---|---|---|---|---|---|
| 33 Fayette St Unit 22 Binghamton, NY | 2.0 | 1.0 | 1350 | $1,100 | $0.81 | 13d | 1 | 0.71mi |
| 113 Hawley St Binghamton, NY | 4.0 | 1.5 | 1637 | $2,000 | $1.22 | 43d | 1 | 0.87mi |
| 136 Court St Unit 2 Binghamton, NY | 4.0 | 1.0 | 1373 | $3,000 | $2.18 | 43d | 1 | 0.91mi |
| 86 Conklin Ave Binghamton, NY | 3.0 | 1.0 | 1316 | $1,600 | $1.22 | 13d | 1 | 0.94mi |
| 100 Felters Rd Binghamton, NY | 4.0 | 2.5 | 2000 | $2,500 | $1.25 | 43d | 1 | 1.02mi |
| 1 Euclid Ave Unit 1 Binghamton, NY | 3.0 | 1.0 | 1100 | $1,500 | $1.36 | 43d | 1 | 1.03mi |
| 71 Mary St Unit 2 Binghamton, NY | 2.0 | 1.0 | 1100 | $1,300 | $1.18 | 13d | 1 | 1.32mi |
| 528 Chenango St Unit 1 Binghamton, NY | 3.0 | 1.0 | 1250 | $1,500 | $1.20 | 13d | 1 | 1.46mi |
| 14 Dennison Ave Unit 2 Binghamton, NY | 2.0 | 1.0 | 1100 | $1,150 | $1.05 | 43d | 1 | 1.48mi |
Listing history 12 events
-
2026-06-02days on market $155,000 Active 117 DOM
-
2026-06-01days on market $155,000 Active 116 DOM
-
2026-05-31days on market $155,000 Active 115 DOM
-
2026-05-30days on market $155,000 Active 114 DOM
-
2026-05-06price $155,000 396-char remark
Show marketing remark (396 chars)
Welcome to 37 Hayes Street, a well-kept home with modern touches that make it comfortable and move-in ready. Recent improvements include a new roof along with updated plumbing and electrical systems for added peace of mind. The fenced yard and covered back deck serve as a nice bonus for outdoor enjoyment. Conveniently located near local amenities, the home offers easy access to everyday needs.
-
2026-02-05$164,000 Active 396-char remark
Show marketing remark (396 chars)
Welcome to 37 Hayes Street, a well-kept home with modern touches that make it comfortable and move-in ready. Recent improvements include a new roof along with updated plumbing and electrical systems for added peace of mind. The fenced yard and covered back deck serve as a nice bonus for outdoor enjoyment. Conveniently located near local amenities, the home offers easy access to everyday needs.
-
2025-11-10price $175,000
-
2025-07-22price $179,000
-
2025-07-21price $159,000
-
2025-07-17$159,900 Active
-
2006-06-09soldstatus $29,000
-
2005-11-10$34,500
ⓘ Source: listings_history table (triggers on properties + properties_extension) + one-shot
backfill from property_details.listing_events for pre-trigger history.
Tax reassessment forecast NY · Partial reset (capped growth)
- Current annual tax
- $5,170 · $431/mo
- Projected year-2 tax
- $5,170 · $431/mo
- Expected delta
- $0/yr ($0/mo · 0.0%)
ⓘ Screening estimate from a state-policy table — verify with the county assessor before closing.
Climate risk First Street
- Flood 7/10 Severe FEMA zone X (shaded) · 95% chance over 30 yrs
- Wildfire 1/10 Low
- Heat 3/10 Moderate 7 d/yr ≥92°F today · 16 d/yr by 30 yrs out
- Wind 2/10 Low 2% chance of damaging wind over 30 yrs
- Air quality 2/10 Low 0 unhealthy d/yr today · 1 by 30 yrs out
Nearby sold comps map
Loading sold comps map…
Walkable amenities ~0.75 mi
Loading nearby amenities…
Taxation est. · year 1
- Rental income
- $20,584
- − Mortgage interest
- −$8,682
- − Property taxes
- −$5,170
- − Insurance
- −$1,442
- − Repairs & maintenance
- −$1,647
- − Management
- −$1,647
- − Depreciation
- −$4,509
- Taxable loss
- −$2,513
- Est. tax savings @ 24.0%
- +$603
- After-tax cash flow
- $499/yr
For passive investors: Depreciation is non-cash, so a rental often shows a tax loss while cash-flowing — sheltering income. Rental losses are passive: they offset passive income freely, and up to $25,000/yr can offset ordinary (W-2) income if you actively participate and your MAGI is under $100k (phasing out to $0 by $150k); unused losses carry forward. On sale, claimed depreciation is recaptured at up to 25%, and gains may owe capital-gains tax (a 1031 exchange can defer both). Figures are a year-1 estimate at your 24.0% rate — not tax advice; consult a CPA.
Schools (NCES district)
- District
- Binghamton City School District
- NCES district ID
- 3604870
- Math proficiency
- 30% ▬ 0.00%
- Reading proficiency
- 44% ▲ 15.00%
- Median HH income
- $30,475
- Composite
- 30.09/100
- National rank
- #6342
- State rank
- #557 of 590 in NY
Livability — Binghamton
- Score
- 78/100
- State rank
- #174
- US rank
- #2710
Category grades
Schools grade is shown separately in the Schools card above.
Census & demographics
- Census place
- Binghamton, NY
- County
- Broome County · 126,805 people
- City population
- 65,170
- Metro
- Binghamton, NY
- Population (ZIP)
- 17,569
- Household income
- $66,278
- Rent vs Own
- Severe rent burden
- 602.0
Population outlook (Broome County) Hauer SSP2
- Today (2025)
- 187,989 people
- By 2030
- 183,066 · -2.6%
- By 2040
- 172,228 · -8.4%
- By 2050
- 163,161 · -13.2%
- By 2075
- 153,641 · -18.3%
- By 2100
- 140,851 · -25.1%
Race, ethnicity, and origin ACS 2023
- Neighborhood character
- Predominantly White (80%)
- Race & ethnicity
- White 80% Black 9% Two or more races 6% Hispanic / Latino 4% Asian 1%
- Common ancestry
- Romanian 6% Slovak 2% Scotch-Irish 2%
- Foreign-born
- 5% · Canada
- Languages at home
- 94% English-only · Spanish 2% Other Indo-European 1% Arabic 1%
Political lean MEDSL · Broome
- 2024 margin
- Toss-up / Even · D 50.2% · R 49.8%
- 2008→2024 swing
- -7.6pp toward R · 2008: 8.0pp · 2024: 0.4pp
- All cycles
- 2024: D+0.4 2020: D+3.5 2016: R+3.7 2012: D+4.6 2008: D+8.0
Not yet ingested
- Civics
- —
Market trends
- HPI YoY
- ▲ 11.68%
- Current HPI
- 286.1001
- Rent YoY
- —
- Metro
- Binghamton, NY
- State GDP YoY
- ▲ 2.60%
- F500 in state
- 92
Industry mix (Fortune 500 HQ in NY)
| Industry | F500 HQs | Revenue |
|---|---|---|
| Financial Services | 10 | $950B |
|
||
| Consumer Goods | 9 | $162B |
|
||
| Insurance | 4 | $225B |
|
||
| Telecommunications | 2 | $144B |
|
||
| Pharmaceuticals | 2 | $112B |
|
||
| Media / Entertainment | 2 | $69B |
|
||
Price history
+349.3% since first listed8 events — show timeline
- 2026-05-06 Price Changed $155,000 GBAOR
- 2026-02-05 Listed $164,000 GBAOR
- 2025-11-10 Price Changed $175,000 GBAOR
- 2025-07-22 Price Changed $179,000 GBAOR
- 2025-07-21 Price Changed $159,000 GBAOR
- 2025-07-17 Listed $159,900 GBAOR
- 2006-06-09 Sold (MLS) $29,000 GBAOR
- 2005-11-10 Listed $34,500 GBAOR
Property tax history
+4.7%/yrLatest (2025): $5,170 · +0.9% YoY. Source: county tax records.
Cash-flow waterfall
monthlySold comps — $/sqft
last 12 mo · ≤1 miLoading sold comps…