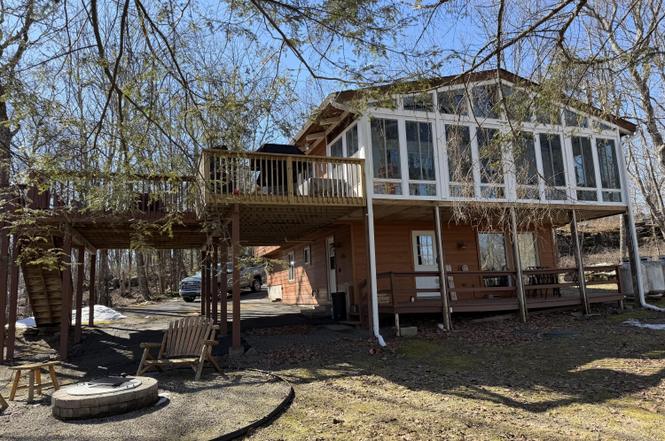
109 Ridge Rd · Hemlock Farms, PA
Flood risk 1/10 · Minimal
- FEMA flood zone
- X (unshaded)
- Chance of flooding over 30 yrs
- 0.0%
- Est. flood insurance / yr
- $473 – $860
Fire risk 5/10 · Moderate
- Est. fire insurance / yr
- $511 – $949
Heat risk 2/10 · Minimal
- Hot days now (above 91°F)
- 7 days/yr
- Hot days in 30 yrs
- 14 days/yr
Wind risk 3/10 · Minor
- Chance of severe wind over 30 yrs
- 6.0%
Air-quality risk 2/10 · Minimal
- Unhealthy air days now
- 1 days/yr
- Unhealthy air days in 30 yrs
- 2 days/yr
Risk factors via First Street. Map © Google.
Why this score? — see what drove the C- grade
The composite is a weighted blend of 9 inputs, each scored 0–100. Each bar is that input's sub-score; the figure is the points it added to the 100-point composite (weight × sub-score).
- Cash flow +14.5/30.0
- Appreciation +10.0/10.0
- ARV discount +7.4/15.0
- DSCR +4.4/10.0
- 1% rule +4.3/10.0
- Schools +4.2/10.0
- Livability +3.4/5.0
- Rent growth +2.5/5.0
- Condition / age +2.5/5.0
$395,000
🖨 Deal sheet (PDF) 📄 Offer letter ✓ Due diligence
Listing remarks
Tucked away on 3.12 acres backing up to State land in amenity-rich Hemlock Farms neighborhood with great security, fire and rescue and gated entrance, this 3 bedroom 2 bathroom home offers great country decor with lots of windows and treetop views. Updated Kitchen and bathrooms, open layout and familyroom, plus a sunroom with propane stove. Living room offers a brick wall fireplace, hardwood floors and split heating/airconditioning unit. Large open deck for outdoor entertaining! Bring the family and enjoy country living!
Key facts
- Brick wall fireplace
- 3.12 acres
- Gated entrance
Tags
Neighborhood map
What this means for you Summary
Snapshot
- This is a 3-bed/2.0-bath single-family listed at $395k.
Deal economics
- At list price, monthly cash flow is $88 ($1k/yr) — positive.
- The deal already cash-flows at list — no discount required.
- To meet the 1% rule (rent ≥ 1% of price), the offer needs to be $365k (7.5% below list).
- Recommended offer: $365k (7.5% below list) — sets the bar for 1% rule.
Location & tenants
- Location reads 68/100 on livability (#884 in PA) — a middle-class / working-renter tenant base. Strengths: crime A+, housing A+, health & safety A+; Watch: schools C-, amenities F, commute F.
- Wallenpaupack Area SD (rural): math 39% / reading 59% proficiency, ranked #192 of 539 in PA (top 36%) — families likely to look elsewhere, expect single-tenant / working-renter base with shorter leases.
- Market conditions: 374 active listings in the ZIP; 4 comparable units currently listed for rent nearby; rentals leasing fast (median 5d on market — plan ~1-2 weeks tenant-placement turnaround); 213 units permitted in Pike County in 2024 (0 in 5+ unit buildings).
Forward outlook
- In year one you build about $42k of equity ($3k loan paydown + $40k appreciation (10.0% local appreciation)).
- Pike County population projected at -25% by 2050 — secular population decline; favor cash flow + early exit over multi-decade hold.
- At projected returns (10.0% appreciation + 3.0% rent growth), your $111k cash investment doubles in ~3 years — after that, you're playing with house money.
- By year 2, paydown + projected appreciation supports a ~$68k cash-out refi (75% LTV) — recoverable capital for the next deal without selling this one.
Negotiation context
- It's been on market 24 days — a 2% lower offer ($389k) is reasonable based on typical stale-listing flexibility.
- Current owner paid $195k; list at $395k implies a 103% gain — meaningful room to come down on a strong offer.
Risks & watch-outs
- Climate carrying-cost: moderate wildfire risk — expect insurance premiums to compound above CPI over the hold.
Questions for the listing agent
- Built in 1979 — when were the roof, HVAC, electrical panel, plumbing, and water heater last replaced?
- What does the HOA fee cover, when was the last increase, and are there any pending special assessments or reserve-fund shortfalls?
- Is there a deadline driving the sale (1031 exchange, divorce, estate, relocation)? That informs how much negotiation room exists.
- What's the average days-on-market for RENTAL listings here right now (not sales)? A rising rental-DOM trend means longer vacancies and softer asking-rent achievability than the comps imply.
- What's the recent tenant-quality profile in this submarket — average credit score on applications, eviction rate, late-payment / NSF rate, and stable-employment percentage? A property-management company in the area should have these aggregated.
- How much new for-sale + rental construction is in the pipeline within 1–3 miles? Heavy new supply typically softens prices + rents 12–24 months out; constrained supply supports both.
Investment metrics
- 1% rule
- 0.93% ✗
- Cap rate
- 6.56%
- Cash-on-cash
- 0.96%
- DSCR
- 1.04
- GRM
- 9.0
CMA / ARV
- ARV (on-the-fly)
- $394,048
- Comps found
- 12
Show comp detail 12 sales within ~0.75 mi
| Address | Dist | Beds/Ba | Sqft | Sold | Price | $/sf | Match |
|---|---|---|---|---|---|---|---|
| 219 Mountain View Dr | 0.37mi | 3/2.0 | 2,012 (-4%) | 6mo | $455,000 | $226 | 71 |
| 107 Rimrock Ln | 0.43mi | 3/2.0 | 2,000 (-5%) | 5mo | $250,000 | $125 | 68 |
| 125 Broadmoor Dr | 0.48mi | 3/2.5 | 2,152 (+3%) | 5mo | $335,000 | $156 | 67 |
| 107 Long Spur Ln | 0.43mi | 3/2.5 | 2,010 (-4%) | 6mo | $430,000 | $214 | 66 |
| 216 Canoebrook Dr | 0.67mi | 3/2.5 | 2,083 (-1%) | 1mo | $405,000 | $194 | 65 |
| 217 Canoebrook Dr | 0.66mi | 3/2.0 | 2,181 (+4%) | 2mo | $359,999 | $165 | 61 |
| 111 Bluestone Dr | 0.60mi | 3/2.0 | 2,016 (-4%) | 9mo | $380,000 | $188 | 58 |
| 140 Long Ridge Dr | 0.64mi | 3/2.0 | 2,153 (+3%) | 11mo | $405,000 | $188 | 57 |
| 105 Canoebrook Dr | 0.20mi | 3/2.0 | 2,405 (+15%) | 12mo | $385,000 | $160 | 56 |
| 803 Widgeon Ct | 0.55mi | 4/3.0 (+1) | 2,152 (+3%) | 8mo | $702,500 | $326 | 54 |
| 809 Widgeon Ct | 0.63mi | 3/3.0 | 1,911 (-9%) | 6mo | $730,000 | $382 | 46 |
| 113 Whipple Tree Ln | 0.57mi | 3/2.0 | 1,892 (-10%) | 16mo | $309,000 | $163 | 43 |
Match score weights: distance 35% · size 25% · config 20% · recency 20%. Top-matched comps best support the ARV.
Projected returns pro-forma
10.0% appreciation · 3.0% rent growth · sell at horizon
- IRR
- 25.0%
- Equity multiple
- 3.00×
- Total profit
- $220,838
- Equity at exit
- $355,847
- IRR
- 22.0%
- Equity multiple
- 6.84×
- Total profit
- $646,111
- Equity at exit
- $767,398
Cash invested: $110,600 (down + closing). Projections, not guarantees.
Landlord ↔ Tenant lean methodology
- Overall (STATE)
- 62 Landlord-Friendly
- State Pennsylvania
- 62 Landlord-Friendly · EVEN
- County
- — inherits STATE
- City
- — inherits STATE
ZIP-level market 18428
- Home prices YoY
- 9.2%
- Active inventory
- 374
- Price-to-rent
- 9.0×
Monthly cashflow live
- Estimated rent
- $3,654 medium interval (Pro) →
- Mortgage (P&I)
- −$2,071
- Tax from tax record
- −$313 /mo · $3,752/yr
- Insurance
- −$165
- HOA
- −$250
- Vacancy / Maint / Mgmt
- −$767
- Net cashflow
- $88
Break-even live
Sensitivity live
| Price | -10% $312 | -5% $200 | +0% $88 | +5% $-24 | +10% $-135 |
|---|---|---|---|---|---|
| Rent | -10% $-201 | -5% $-56 | +0% $88 | +5% $232 | +10% $377 |
| Rate | -1.0pp $287 | -0.5pp $189 | base $88 | +0.5pp $-14 | +1.0pp $-118 |
UW: 25.0% down · 7.5% · 30yr · 1.5% tax · 5.0% vac · 8.0% maint · 8.0% mgmt
Financing live
Cash to close
- Down payment
- $98,750
- Closing costs
- $11,850
- Reserves months
- —
- Total cash needed
- —
Loan-product check · same deal, 3 products live
Conventional
25% down · 7.5% · 30yr
- Down + closing
- —
- Monthly P&I
- —
- Monthly cashflow
- —
- DSCR
- —
- Eligible?
- —
Personal DTI + credit; lowest rate.
DSCR
20% down · 8.5% · 30yr
- Down + closing
- —
- Monthly P&I
- —
- Monthly cashflow
- —
- DSCR
- —
- Eligible?
- —
No personal income docs; deal must DSCR.
Hard money
10% down · 12.0% · 12mo
- Down + closing
- —
- Monthly P&I
- —
- Monthly cashflow
- —
- DSCR
- —
- Eligible?
- —
Short-term bridge; refi at stabilization.
Rent comps 4 comps
| Address | Beds | Baths | Sqft | Rent | $/sqft | DOM | Units | Dist |
|---|---|---|---|---|---|---|---|---|
| 101 Pommel Dr Hawley, PA | 3.0 | 2.0 | 1691 | $4,400 | $2.60 | 2d | 1 | 1.12mi |
| 402 Canoe Brook Dr Hawley, PA | 3.0 | 2.0 | 2055 | $3,500 | $1.70 | 0d | 1 | 1.30mi |
| 106 Corral Ln Hawley, PA | 3.0 | 2.0 | 2150 | $4,000 | $1.86 | 4d | 1 | 1.30mi |
| 131 Surrey Dr Hawley, PA | 4.0 | 2.0 | 1952 | $2,650 | $1.36 | 44d | 1 | 1.37mi |
HOA detail
- Monthly dues
- $250 · $3,000/yr
- Likely covers
- security
Listing history 4 events
-
2026-03-30status Pending
-
2026-03-06$395,000 Active
-
2015-04-23soldstatus $195,000
-
2003-06-25soldstatus $200,000
ⓘ Source: listings_history table (triggers on properties + properties_extension) + one-shot
backfill from property_details.listing_events for pre-trigger history.
Tax reassessment forecast PA · Partial reset (capped growth)
- Current annual tax
- $3,752 · $313/mo
- Projected year-2 tax
- $4,997 · $416/mo
- Expected delta
- +$1,244/yr (+$104/mo · 33.2%)
ⓘ Screening estimate from a state-policy table — verify with the county assessor before closing.
Climate risk First Street
- Flood 1/10 Low FEMA zone X (unshaded) · 0% chance over 30 yrs
- Wildfire 5/10 Major
- Heat 2/10 Low 7 d/yr ≥91°F today · 14 d/yr by 30 yrs out
- Wind 3/10 Moderate 6% chance of damaging wind over 30 yrs
- Air quality 2/10 Low 1 unhealthy d/yr today · 2 by 30 yrs out
Nearby sold comps map
Loading sold comps map…
Walkable amenities ~0.75 mi
Loading nearby amenities…
Taxation est. · year 1
- Rental income
- $43,850
- − Mortgage interest
- −$22,126
- − Property taxes
- −$3,752
- − Insurance
- −$1,975
- − Repairs & maintenance
- −$3,508
- − Management
- −$3,508
- − HOA
- −$3,000
- − Depreciation
- −$11,491
- Taxable loss
- −$5,510
- Est. tax savings @ 24.0%
- +$1,322
- After-tax cash flow
- $2,380/yr
For passive investors: Depreciation is non-cash, so a rental often shows a tax loss while cash-flowing — sheltering income. Rental losses are passive: they offset passive income freely, and up to $25,000/yr can offset ordinary (W-2) income if you actively participate and your MAGI is under $100k (phasing out to $0 by $150k); unused losses carry forward. On sale, claimed depreciation is recaptured at up to 25%, and gains may owe capital-gains tax (a 1031 exchange can defer both). Figures are a year-1 estimate at your 24.0% rate — not tax advice; consult a CPA.
Schools (NCES district)
- District
- Wallenpaupack Area SD
- NCES district ID
- 4224750
- Math proficiency
- 39% ▼ -10.00%
- Reading proficiency
- 59% ▼ -5.00%
- Median HH income
- $51,027
- Composite
- 41.97/100
- National rank
- #3345
- State rank
- #192 of 539 in PA
Livability — Hemlock Farms
- Score
- 68/100
- State rank
- #884
- US rank
- #9421
Category grades
Schools grade is shown separately in the Schools card above.
Census & demographics
- Census place
- Hemlock Farms, PA
- Population (ZIP)
- 12,446
Population outlook (Pike County) Hauer SSP2
- Today (2025)
- 53,548 people
- By 2030
- 51,622 · -3.6%
- By 2040
- 46,490 · -13.2%
- By 2050
- 40,372 · -24.6%
- By 2075
- 31,951 · -40.3%
- By 2100
- 26,821 · -49.9%
Race, ethnicity, and origin ACS 2023
- Neighborhood character
- Predominantly White (85%)
- Race & ethnicity
- White 85% Hispanic / Latino 8% Two or more races 6% Black 1% Asian 1%
- Hispanic origin (detail)
- Puerto Rican 5%
- Common ancestry
- Romanian 5% Portuguese 3% Italian 2%
- Foreign-born
- 5% · Canada
- Languages at home
- 91% English-only · Spanish 5% Russian/Polish/Slavic 1% Other Asian/Pacific 1%
Political lean MEDSL · Pike
- 2024 margin
- Strong R (+24.1) · D 37.6% · R 61.6%
- 2008→2024 swing
- -19.8pp toward R · 2008: -4.2pp · 2024: -24.1pp
- All cycles
- 2024: R+24.1 2020: R+19.0 2016: R+26.0 2012: R+11.0 2008: R+4.2
Not yet ingested
- Civics
- —
Market trends
- HPI YoY
- ▲ 28.60%
- Current HPI
- 340.8254
- Rent YoY
- —
- Metro
- —
- State GDP YoY
- ▲ 1.68%
- F500 in state
- 34
Industry mix (Fortune 500 HQ in PA)
| Industry | F500 HQs | Revenue |
|---|---|---|
| Healthcare | 2 | $309B |
|
||
| Insurance | 2 | $27B |
|
||
| Telecommunications / Media | 1 | $124B |
|
||
| Industrial Distribution | 1 | $22B |
|
||
| Financial Services | 1 | $20B |
|
||
| Chemicals / Materials | 1 | $18B |
|
||
Price history
+97.5% since first listed4 events — show timeline
- 2026-03-30 Pending — PWMLS
- 2026-03-06 Listed $395,000 PWMLS
- 2015-04-23 Sold (Public Records) $195,000 Public Records
- 2003-06-25 Sold (Public Records) $200,000 Public Records
Property tax history
+2.8%/yrLatest (2026): $3,752 · +3.0% YoY. Source: county tax records.
Cash-flow waterfall
monthlySold comps — $/sqft
last 12 mo · ≤1 miLoading sold comps…