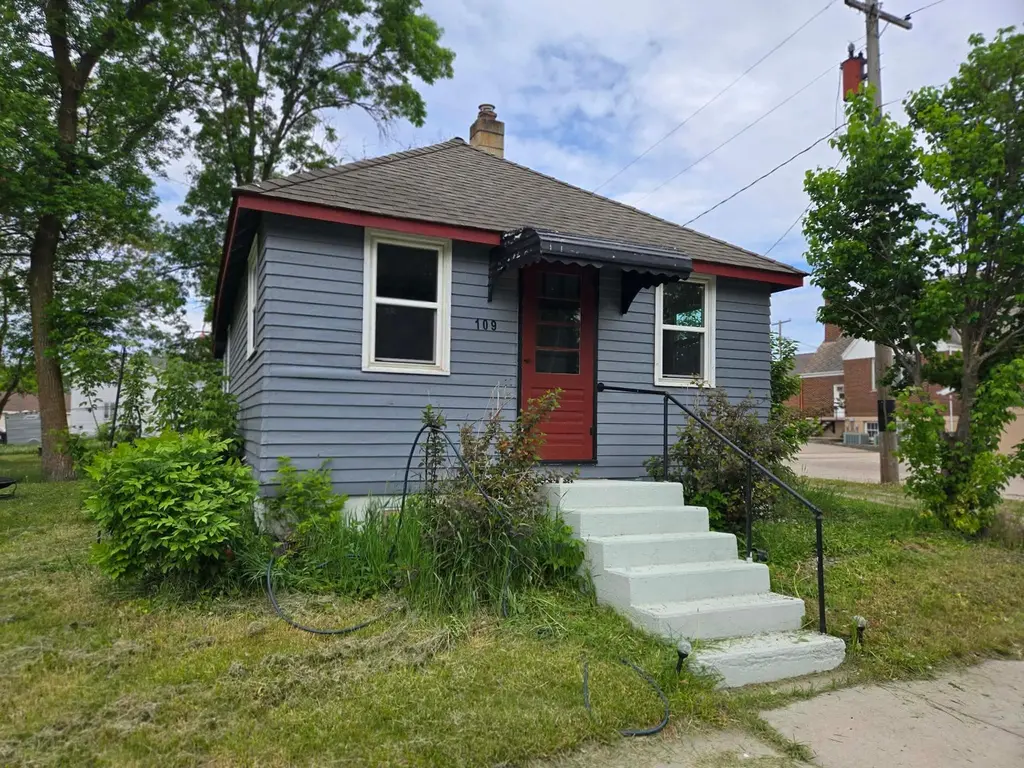
109 S Central Ave · Dalton, MN
Flood risk 1/10 · Minimal
- FEMA flood zone
- —
- Chance of flooding over 30 yrs
- 0.0%
- Est. flood insurance / yr
- —
Fire risk 3/10 · Minor
- Est. fire insurance / yr
- $888 – $1,650
Heat risk 1/10 · Minimal
- Hot days now (above 97°F)
- 7 days/yr
- Hot days in 30 yrs
- 13 days/yr
Wind risk 2/10 · Minimal
- Chance of severe wind over 30 yrs
- —
Air-quality risk 3/10 · Minor
- Unhealthy air days now
- 3 days/yr
- Unhealthy air days in 30 yrs
- 3 days/yr
Risk factors via First Street. Map © Google.
Why this score? — see what drove the C grade
The composite is a weighted blend of 9 inputs, each scored 0–100. Each bar is that input's sub-score; the figure is the points it added to the 100-point composite (weight × sub-score).
- Cash flow +18.4/30.0
- Appreciation +7.8/10.0
- ARV discount +7.5/15.0
- DSCR +5.8/10.0
- Schools +5.1/10.0
- 1% rule +4.1/10.0
- Livability +3.2/5.0
- Rent growth +2.5/5.0
- Condition / age +2.5/5.0
$84,900
🖨 Deal sheet (PDF) 📄 Offer letter ✓ Due diligence
Listing remarks
Welcome home to this charming 1-bedroom, 1-bath single-level residence in the heart of Dalton! Ideally located near the city park, the Central Lakes Trail, downtown shopping, and local dining, this property offers the perfect blend of small-town charm and convenient access to everyday amenities in Minnesota's beautiful lakes country. Recent updates include a newer electrical panel, updated windows, flooring improvements, and a wheelchair-accessible ramp, adding comfort and functionality to the home. Whether you're searching for an affordable place to call home, a seasonal retreat, or an investment property with rental potential, this home offers plenty of possibilities. Don't miss the oppor
Key facts
- Updated windows
- Downtown shopping
- Central lakes trail
Tags
Property features AI
Finance
- Other: Living area approx. 740 sq ft (above grade finished area); Below-grade area approx. 289; Total building area approx. 1,049; Accessibility features included
Exterior
- Parking: Gravel parking
- Utilities: City water available at street; City sewer (connected); 100 Amp electric service; Propane fuel
- Home design: Residential property; One story; Main-level entry
- Construction: Block foundation; Asphalt roof (over 8 years old); Wood construction; Built area includes finished main level and additional below-grade space
- Exterior features: Wood exterior; Porch; City street frontage (public maintained road); Lot about 0.1 acre (approx. 61 x 71)
Interior
- Kitchen: Kitchen (18 x 8'7")
- Bedrooms: One bedroom on the main level (8.5 x 9.5)
- Bathrooms: One full bathroom
- Heating & cooling: Forced air heating; Window air conditioning unit(s)
- Interior features: Main-floor primary bedroom; Porch; Wheelchair ramp(s); Kitchen/dining room combined; Block basement
- Laundry & utility: No laundry facilities
Neighborhood map
What this means for you Summary
Snapshot
- This is a 1-bed/1.0-bath single-family listed at $85k.
Deal economics
- At list price, monthly cash flow is $79 ($944/yr) — positive.
- The deal already cash-flows at list — no discount required.
- To meet the 1% rule (rent ≥ 1% of price), the offer needs to be $77k (8.8% below list).
- Recommended offer: $77k (8.8% below list) — sets the bar for 1% rule.
Location & tenants
- Location reads 63/100 on livability (#668 in MN) — a middle-class / working-renter tenant base. Strengths: cost of living A+, housing A+; Watch: crime D+, health & safety D+, employment D.
- Fergus Falls Public School District (town): math 59% / reading 61% proficiency, ranked #46 of 301 in MN (top 15%) — acceptable for families but not a draw, mixed tenant base, ~2y average lease.
- Zoned schools: Cleveland Elementary (math 71% / reading 60%, grade B+, #123 of 857 statewide, top 15%, 369 students, 47% FRL); Kennedy Middle School (math 57% / reading 63%, grade B, #25 of 258 statewide, top 9%, 769 students, 43% FRL); Kennedy High School (math 52% / reading 62%, grade C, #64 of 471 statewide, top 16%, 685 students, 33% FRL) — zoned schools average 41% FRL vs 24% district-wide (17 pts higher); higher-poverty schools than district average — tighter screening recommended.
- Market conditions: 12 active listings in the ZIP; 140 units permitted in Otter Tail County in 2024 (48 in 5+ unit buildings).
Forward outlook
- In year one you build about $5k of equity ($587 loan paydown + $5k appreciation (5.7% local appreciation)).
- At projected returns (5.7% appreciation + 3.0% rent growth), your $24k cash investment doubles in ~4 years — after that, you're playing with house money.
- By year 7, paydown + projected appreciation supports a ~$35k cash-out refi (75% LTV) — recoverable capital for the next deal without selling this one.
Negotiation context
- It's been on market 23 days — a 2% lower offer ($84k) is reasonable based on typical stale-listing flexibility.
- Current owner paid $16k; list at $85k implies a 448% gain — meaningful room to come down on a strong offer.
Risks & watch-outs
- Watch-outs: built in 1945 — expect roof / HVAC / electrical / plumbing capex.
Questions for the listing agent
- Built in 1945 — when were the roof, HVAC, electrical panel, plumbing, and water heater last replaced?
- Is there a deadline driving the sale (1031 exchange, divorce, estate, relocation)? That informs how much negotiation room exists.
- Schools are F-rated, which usually means shorter tenancies and higher turnover. Who's the typical renter profile here, and what's been the actual vacancy rate?
- Crime grade is D in this area — have there been break-ins, vandalism, or insurance claims at this property in the last 3 years? What carrier currently insures it and at what premium?
- What's the average days-on-market for RENTAL listings here right now (not sales)? A rising rental-DOM trend means longer vacancies and softer asking-rent achievability than the comps imply.
- What's the recent tenant-quality profile in this submarket — average credit score on applications, eviction rate, late-payment / NSF rate, and stable-employment percentage? A property-management company in the area should have these aggregated.
- How much new for-sale + rental construction is in the pipeline within 1–3 miles? Heavy new supply typically softens prices + rents 12–24 months out; constrained supply supports both.
Investment metrics
- 1% rule
- 0.91% ✗
- Cap rate
- 7.41%
- Cash-on-cash
- 3.97%
- DSCR
- 1.18
- GRM
- 9.1
CMA / ARV
No comps found within radius.
Projected returns pro-forma
5.68% appreciation · 3.0% rent growth · sell at horizon
- IRR
- 17.9%
- Equity multiple
- 2.17×
- Total profit
- $27,915
- Equity at exit
- $51,683
- IRR
- 17.6%
- Equity multiple
- 4.31×
- Total profit
- $78,593
- Equity at exit
- $92,300
Cash invested: $23,772 (down + closing). Projections, not guarantees.
Landlord ↔ Tenant lean methodology
- Overall (STATE)
- 46 Balanced
- State Minnesota
- 46 Balanced · D+2
- County
- — inherits STATE
- City
- — inherits STATE
ZIP-level market 56324
- Home prices YoY
- 2.8%
- Active inventory
- 12
- Price-to-rent
- 9.1×
Monthly cashflow live
- Estimated rent
- $774 medium interval (Pro) →
- Mortgage (P&I)
- −$445
- Tax from tax record
- −$52 /mo · $628/yr
- Insurance
- −$35
- HOA
- −$0
- Lot rent
- −$0
- Vacancy / Maint / Mgmt
- −$163
- Net cashflow
- $79
Break-even live
Sensitivity live
| Price | -10% $127 | -5% $103 | +0% $79 | +5% $55 | +10% $31 |
|---|---|---|---|---|---|
| Rent | -10% $18 | -5% $48 | +0% $79 | +5% $109 | +10% $140 |
| Rate | -1.0pp $121 | -0.5pp $100 | base $79 | +0.5pp $57 | +1.0pp $34 |
UW: 25.0% down · 7.5% · 30yr · 1.5% tax · 5.0% vac · 8.0% maint · 8.0% mgmt
Financing live
Cash to close
- Down payment
- $21,225
- Closing costs
- $2,547
- Reserves months
- —
- Total cash needed
- —
Loan-product check · same deal, 3 products live
Conventional
25% down · 7.5% · 30yr
- Down + closing
- —
- Monthly P&I
- —
- Monthly cashflow
- —
- DSCR
- —
- Eligible?
- —
Personal DTI + credit; lowest rate.
DSCR
20% down · 8.5% · 30yr
- Down + closing
- —
- Monthly P&I
- —
- Monthly cashflow
- —
- DSCR
- —
- Eligible?
- —
No personal income docs; deal must DSCR.
Hard money
10% down · 12.0% · 12mo
- Down + closing
- —
- Monthly P&I
- —
- Monthly cashflow
- —
- DSCR
- —
- Eligible?
- —
Short-term bridge; refi at stabilization.
Listing history 18 events
-
2026-06-22days on market $84,900 Active 23 DOM
-
2026-06-21days on market $84,900 Active 22 DOM
-
2026-06-19days on market $84,900 Active 20 DOM
-
2026-06-18days on market $84,900 Active 19 DOM
-
2026-06-17days on market $84,900 Active 18 DOM
-
2026-06-16days on market $84,900 Active 17 DOM
-
2026-06-15days on market $84,900 Active 16 DOM
-
2026-06-14pricedays on market $84,900 Active 14 DOM
-
2026-06-12days on market $90,000 Active 13 DOM
-
2026-06-09days on market $90,000 Active 10 DOM
-
2026-06-08days on market $90,000 Active 9 DOM
-
2026-06-07days on market $90,000 Active 8 DOM
-
2026-06-07days on market $90,000 Active 7 DOM
-
2026-06-04days on market $90,000 Active 4 DOM
-
2026-06-02days on market $90,000 Active 3 DOM
-
2026-06-01days on market $90,000 Active 2 DOM
-
2026-05-31remarks 699-char remark
-
2026-05-31$90,000 Active 1 DOM
ⓘ Source: listings_history table (triggers on properties + properties_extension) + one-shot
backfill from property_details.listing_events for pre-trigger history.
Tax reassessment forecast MN · Partial reset (capped growth)
- Current annual tax
- $628 · $52/mo
- Projected year-2 tax
- $789 · $66/mo
- Expected delta
- +$161/yr (+$13/mo · 25.7%)
ⓘ Screening estimate from a state-policy table — verify with the county assessor before closing.
Climate risk First Street
- Flood 1/10 Low 0% chance over 30 yrs
- Wildfire 3/10 Moderate
- Heat 1/10 Low 7 d/yr ≥97°F today · 13 d/yr by 30 yrs out
- Wind 2/10 Low
- Air quality 3/10 Moderate 3 unhealthy d/yr today · 3 by 30 yrs out
Nearby sold comps map
Loading sold comps map…
Walkable amenities ~0.75 mi
Loading nearby amenities…
Taxation est. · year 1
- Rental income
- $9,290
- − Mortgage interest
- −$4,756
- − Property taxes
- −$628
- − Insurance
- −$424
- − Repairs & maintenance
- −$743
- − Management
- −$743
- − Depreciation
- −$2,470
- Taxable loss
- −$474
- Est. tax savings @ 24.0%
- +$114
- After-tax cash flow
- $1,058/yr
For passive investors: Depreciation is non-cash, so a rental often shows a tax loss while cash-flowing — sheltering income. Rental losses are passive: they offset passive income freely, and up to $25,000/yr can offset ordinary (W-2) income if you actively participate and your MAGI is under $100k (phasing out to $0 by $150k); unused losses carry forward. On sale, claimed depreciation is recaptured at up to 25%, and gains may owe capital-gains tax (a 1031 exchange can defer both). Figures are a year-1 estimate at your 24.0% rate — not tax advice; consult a CPA.
Schools (NCES district)
- District
- Fergus Falls Public School District
- NCES district ID
- 2711880
- Math proficiency
- 59% ▬ 0.00%
- Reading proficiency
- 61% ▼ -4.00%
- Median HH income
- $48,044
- Composite
- 50.89/100
- National rank
- #1790
- State rank
- #46 of 301 in MN
Livability — Dalton
- Score
- 63/100
- State rank
- #668
- US rank
- #16081
Category grades
Schools grade is shown separately in the Schools card above.
Census & demographics
- Census place
- Dalton, MN
- Population (ZIP)
- 1,116
Population outlook (Otter Tail County) Hauer SSP2
- Today (2025)
- 58,183 people
- By 2030
- 58,267 · +0.1%
- By 2040
- 57,999 · -0.3%
- By 2050
- 57,183 · -1.7%
- By 2075
- 57,638 · -0.9%
- By 2100
- 54,697 · -6.0%
Race, ethnicity, and origin ACS 2023
- Neighborhood character
- Predominantly White (96%)
- Race & ethnicity
- White 96% Two or more races 4%
- Common ancestry
- Portuguese 33% Romanian 3% Iranian 3%
- Foreign-born
- 0%
- Languages at home
- 99% English-only · Other Indo-European 1%
Political lean MEDSL · Otter Tail
- 2024 margin
- Solid R (+34.2) · D 32.1% · R 66.3% · Other 1.6%
- 2008→2024 swing
- -21.3pp toward R · 2008: -12.9pp · 2024: -34.2pp
- All cycles
- 2024: R+34.2 2020: R+32.5 2016: R+35.9 2012: R+21.2 2008: R+12.9
Not yet ingested
- Civics
- —
Market trends
- HPI YoY
- ▲ 5.68%
- Current HPI
- 210.6651
- Rent YoY
- —
- Metro
- —
- State GDP YoY
- ▲ 2.41%
- F500 in state
- 34
Industry mix (Fortune 500 HQ in MN)
| Industry | F500 HQs | Revenue |
|---|---|---|
| Healthcare | 2 | $407B |
|
||
| Retail | 2 | $150B |
|
||
| Consumer Goods | 2 | $32B |
|
||
| Industrial Machinery | 2 | $6B |
|
||
| Agriculture | 1 | $40B |
|
||
| Healthcare / Medical Devices | 1 | $32B |
|
||
Price history
+339.0% since first listed3 events — show timeline
- 2026-05-30 Listed $90,000 NORTHSTARMLS as Distributed by MLS Grid
- 2015-07-20 Sold (Public Records) $15,500 Public Records
- 2004-04-14 Sold (Public Records) $20,500 Public Records
Property tax history
-0.5%/yrLatest (2025): $628 · +3.0% YoY. Source: county tax records.
Cash-flow waterfall
monthlySold comps — $/sqft
last 12 mo · ≤1 miLoading sold comps…