 Triplex
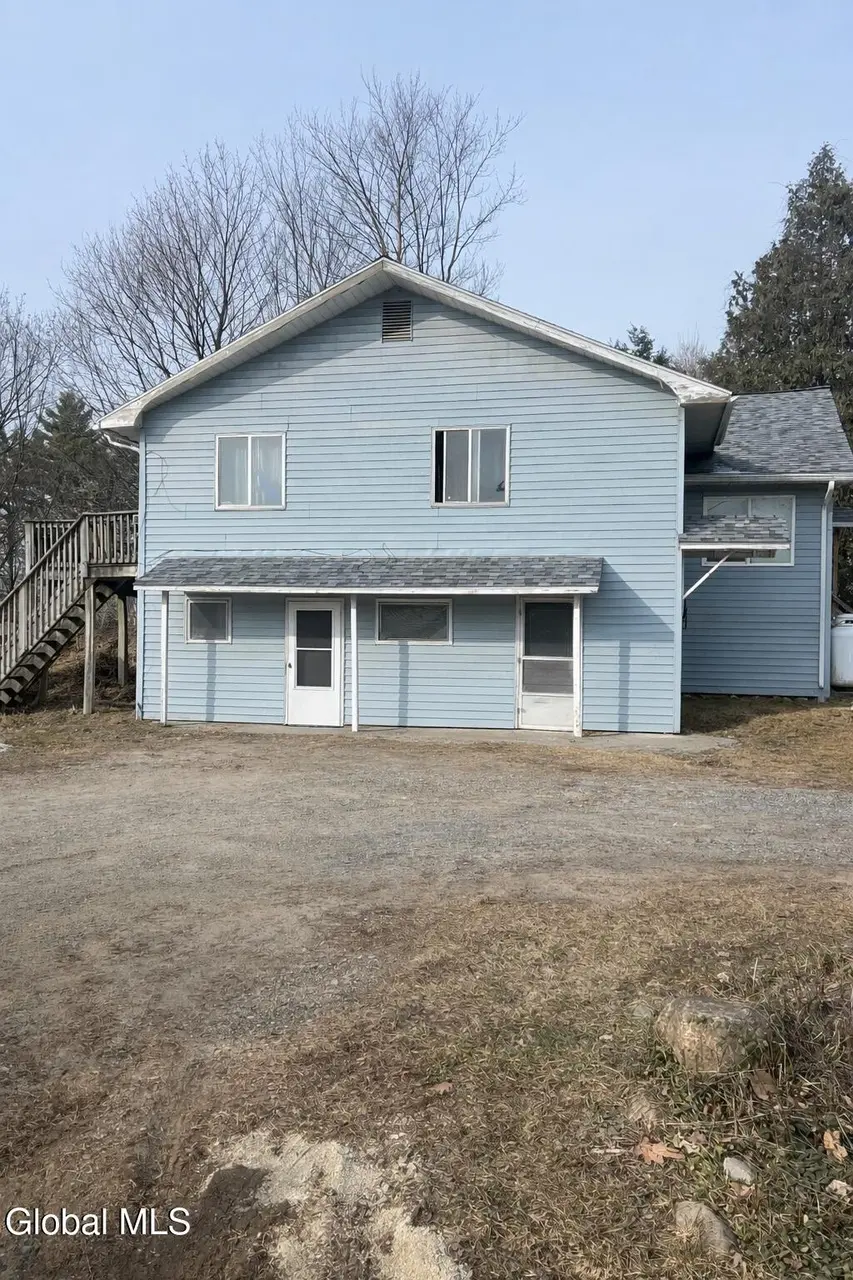
1276 Ridge Rd · Galway, NY
Flood risk 1/10 · Minimal
- FEMA flood zone
- X
- Chance of flooding over 30 yrs
- 0.0%
- Est. flood insurance / yr
- $473 – $860
Fire risk 1/10 · Minimal
- Est. fire insurance / yr
- $691 – $1,283
Heat risk 2/10 · Minimal
- Hot days now (above 93°F)
- 7 days/yr
- Hot days in 30 yrs
- 16 days/yr
Wind risk 2/10 · Minimal
- Chance of severe wind over 30 yrs
- 3.0%
Air-quality risk 1/10 · Minimal
- Unhealthy air days now
- 0 days/yr
- Unhealthy air days in 30 yrs
- 0 days/yr
Risk factors via First Street. Map © Google.
Why this score? — see what drove the B+ grade
The composite is a weighted blend of 9 inputs, each scored 0–100. Each bar is that input's sub-score; the figure is the points it added to the 100-point composite (weight × sub-score).
- Cash flow +24.4/30.0
- ARV discount +15.0/15.0
- Appreciation +10.0/10.0
- DSCR +7.9/10.0
- 1% rule +5.8/10.0
- Schools +4.9/10.0
- Livability +3.4/5.0
- Rent growth +2.5/5.0
- Condition / age +2.5/5.0
$359,000
🖨 Deal sheet (PDF) 📄 Offer letter ✓ Due diligence
Multi-family units
County records classify this as Multi-Family (2-4 Unit). Listing-text estimate: 3 units. confirmed
Listing remarks MLS
ATTENTION INVESTORS! Multi-unit opportunity in Galway Schools located on a 0.59 acre lot is a rare find! Three unit apartment bldg. All apartments are 2 BR, one BA. Laminate flooring, carpets, great outdoor space. New roof within the last 2 years. Don't miss out, call today!
Key facts
- Outdoor space
- New roof
- 0.52 acre lot
Tags
Neighborhood map
What this means for you Summary
Snapshot
- This is a 3 × 2-bed/1-bath units multifamily listed at $359k.
Deal economics
- At list price, monthly cash flow is $732 ($9k/yr) — positive. Per door: $244/mo.
- The deal already cash-flows at list — no discount required.
- Meets the 1% rule at list price ($4k rent vs $359k).
- Recommended offer: $354k (1.5% below list) — sets the bar for market timing.
Location & tenants
- Location reads 67/100 on livability (#580 in NY) — a middle-class / working-renter tenant base. Strengths: health & safety A+, housing A, schools A-; Watch: crime F, amenities F, commute F.
- Galway Central School District (rural): math 50% / reading 62% proficiency, ranked #274 of 590 in NY (top 46%) — acceptable for families but not a draw, mixed tenant base, ~2y average lease.
- Market conditions: 15 active listings in the ZIP; 1,132 units permitted in Saratoga County in 2024 (378 in 5+ unit buildings).
Forward outlook
- In year one you build about $38k of equity ($2k loan paydown + $36k appreciation (10.0% local appreciation)).
- Saratoga County population projected at +4% by 2050 — modest demand growth; plan on rents tracking national, not racing it.
- At projected returns (10.0% appreciation + 3.0% rent growth), your $101k cash investment doubles in ~3 years — after that, you're playing with house money.
- By year 2, paydown + projected appreciation supports a ~$62k cash-out refi (75% LTV) — recoverable capital for the next deal without selling this one.
Negotiation context
- It's been on market 28 days — a 2% lower offer ($354k) is reasonable based on typical stale-listing flexibility.
- 5 sale attempts since 19y ago with the ask held roughly flat each time — persistent listings suggest the price (not the market) is what's stuck; bring a comps-based counter.
- Current owner paid $168k; list at $359k implies a 114% gain — meaningful room to come down on a strong offer.
Questions for the listing agent
- Can we see the unit-by-unit rent roll, current vacancy, and any below-market leases? What's the average tenancy length?
- What capital expenditures (roof, boiler, parking lot, exteriors) have been made in the last 5 years, and what's planned in the next 2?
- Is there a deadline driving the sale (1031 exchange, divorce, estate, relocation)? That informs how much negotiation room exists.
- Schools are A-rated — typically a magnet for longer-tenancy family renters. What's the average tenant stay here, and is there a school-zone premium baked into asking?
- Crime grade is F in this area — have there been break-ins, vandalism, or insurance claims at this property in the last 3 years? What carrier currently insures it and at what premium?
- What's the average days-on-market for RENTAL listings here right now (not sales)? A rising rental-DOM trend means longer vacancies and softer asking-rent achievability than the comps imply.
- What's the recent tenant-quality profile in this submarket — average credit score on applications, eviction rate, late-payment / NSF rate, and stable-employment percentage? A property-management company in the area should have these aggregated.
- How much new apartment / multifamily construction is in the pipeline within 1–3 miles? Heavy new supply (>2% of stock underway) typically softens rents 12–24 months out; light construction supports rent growth.
Investment metrics
- 1% rule
- 1.08% ✓
- Cap rate
- 8.74%
- Cash-on-cash
- 8.74%
- DSCR
- 1.39
- GRM
- 7.7
CMA / ARV
- ARV (median comp)
- $552,768
- List price
- $359,000
- Delta
- -35.05%
- Verdict
- UNDERPRICED
- Comps
- 1 within 2.0 mi
Projected returns pro-forma
10.0% appreciation · 3.0% rent growth · sell at horizon
- IRR
- 30.7%
- Equity multiple
- 3.41×
- Total profit
- $242,139
- Equity at exit
- $323,416
- IRR
- 26.5%
- Equity multiple
- 7.73×
- Total profit
- $676,320
- Equity at exit
- $697,458
Cash invested: $100,520 (down + closing). Projections, not guarantees.
Landlord ↔ Tenant lean methodology
- Overall (STATE)
- 15 Strongly Tenant-Friendly
- State New York
- 15 Strongly Tenant-Friendly · D+10
- County
- — inherits STATE
- City
- — inherits STATE
ZIP-level market 12074
- Home prices YoY
- 8.1%
- Active inventory
- 15
- Price-to-rent
- 23.1×
Monthly cashflow live
- Estimated rent
- $3,888 medium interval (Pro) →
- Mortgage (P&I)
- −$1,883
- Tax from tax record
- −$307 /mo · $3,683/yr
- Insurance
- −$150
- HOA
- −$0
- Vacancy / Maint / Mgmt
- −$816
- Net cashflow
- $732
Break-even live
Sensitivity live
| Price | -10% $936 | -5% $834 | +0% $732 | +5% $631 | +10% $529 |
|---|---|---|---|---|---|
| Rent | -10% $425 | -5% $579 | +0% $732 | +5% $886 | +10% $1,040 |
| Rate | -1.0pp $913 | -0.5pp $824 | base $732 | +0.5pp $639 | +1.0pp $545 |
3-unit breakdown (identical units grouped — click to expand)
| Units | Beds | Baths | Est. rent |
|---|---|---|---|
| 3× units | 2 | 1 | $3,888 |
| #1 | 2 | 1 | $1,296 |
| #2 | 2 | 1 | $1,296 |
| #3 | 2 | 1 | $1,296 |
| Total (3 units) | $3,888 | ||
UW: 25.0% down · 7.5% · 30yr · 1.5% tax · 5.0% vac · 8.0% maint · 8.0% mgmt
Financing live
Cash to close
- Down payment
- $89,750
- Closing costs
- $10,770
- Reserves months
- —
- Total cash needed
- —
Loan-product check · same deal, 3 products live
Conventional
25% down · 7.5% · 30yr
- Down + closing
- —
- Monthly P&I
- —
- Monthly cashflow
- —
- DSCR
- —
- Eligible?
- —
Personal DTI + credit; lowest rate.
DSCR
20% down · 8.5% · 30yr
- Down + closing
- —
- Monthly P&I
- —
- Monthly cashflow
- —
- DSCR
- —
- Eligible?
- —
No personal income docs; deal must DSCR.
Hard money
10% down · 12.0% · 12mo
- Down + closing
- —
- Monthly P&I
- —
- Monthly cashflow
- —
- DSCR
- —
- Eligible?
- —
Short-term bridge; refi at stabilization.
Listing history 13 events
-
2026-05-04status Pending 281-char remark
Show marketing remark (281 chars)
ATTENTION INVESTORS! Multi-unit opportunity in Galway Schools located on a 0.59 acre lot is a rare find! Three unit apartment bldg. All apartments are 2 BR, one BA. Laminate flooring, carpets, great outdoor space. New roof within the last 2 years. Don't miss out, call today!
-
2026-04-06$359,000 Active 281-char remark
Show marketing remark (281 chars)
ATTENTION INVESTORS! Multi-unit opportunity in Galway Schools located on a 0.59 acre lot is a rare find! Three unit apartment bldg. All apartments are 2 BR, one BA. Laminate flooring, carpets, great outdoor space. New roof within the last 2 years. Don't miss out, call today!
-
2016-12-02historical
-
2016-06-24status Extended
-
2016-06-22historical
-
2016-06-20status Extended
-
2016-06-18historical
-
2016-05-16price $177,900
-
2016-04-16price $178,900
-
2015-11-06$179,000 Active
-
2008-03-24soldstatus $167,500
-
2008-03-21soldstatus $167,500
-
2007-09-19$179,900
ⓘ Source: listings_history table (triggers on properties + properties_extension) + one-shot
backfill from property_details.listing_events for pre-trigger history.
Tax reassessment forecast NY · Partial reset (capped growth)
- Current annual tax
- $3,683 · $307/mo
- Projected year-2 tax
- $4,875 · $406/mo
- Expected delta
- +$1,192/yr (+$99/mo · 32.4%)
ⓘ Screening estimate from a state-policy table — verify with the county assessor before closing.
Climate risk First Street
- Flood 1/10 Low FEMA zone X · 0% chance over 30 yrs
- Wildfire 1/10 Low
- Heat 2/10 Low 7 d/yr ≥93°F today · 16 d/yr by 30 yrs out
- Wind 2/10 Low 3% chance of damaging wind over 30 yrs
- Air quality 1/10 Low 0 unhealthy d/yr today · 0 by 30 yrs out
Nearby sold comps map
Loading sold comps map…
Walkable amenities ~0.75 mi
Loading nearby amenities…
Taxation est. · year 1
- Rental income
- $46,656
- − Mortgage interest
- −$20,110
- − Property taxes
- −$3,683
- − Insurance
- −$1,795
- − Repairs & maintenance
- −$3,732
- − Management
- −$3,732
- − Depreciation
- −$10,444
- Taxable income
- $3,160
- Est. tax owed @ 24.0%
- −$758
- After-tax cash flow
- $8,030/yr
For passive investors: Depreciation is non-cash, so a rental often shows a tax loss while cash-flowing — sheltering income. Rental losses are passive: they offset passive income freely, and up to $25,000/yr can offset ordinary (W-2) income if you actively participate and your MAGI is under $100k (phasing out to $0 by $150k); unused losses carry forward. On sale, claimed depreciation is recaptured at up to 25%, and gains may owe capital-gains tax (a 1031 exchange can defer both). Figures are a year-1 estimate at your 24.0% rate — not tax advice; consult a CPA.
Schools (NCES district)
- District
- Galway Central School District
- NCES district ID
- 3611730
- Math proficiency
- 50% ▼ -9.00%
- Reading proficiency
- 62% ▲ 8.00%
- Median HH income
- $64,963
- Composite
- 49.15/100
- National rank
- #2044
- State rank
- #274 of 590 in NY
Livability — Galway
- Score
- 67/100
- State rank
- #580
- US rank
- #10479
Category grades
Schools grade is shown separately in the Schools card above.
Census & demographics
- Population (ZIP)
- 2,833
Population outlook (Saratoga County) Hauer SSP2
- Today (2025)
- 238,889 people
- By 2030
- 243,681 · +2.0%
- By 2040
- 249,118 · +4.3%
- By 2050
- 248,638 · +4.1%
- By 2075
- 241,675 · +1.2%
- By 2100
- 213,150 · -10.8%
Race, ethnicity, and origin ACS 2023
- Neighborhood character
- Predominantly White (94%)
- Race & ethnicity
- White 94% Hispanic / Latino 3% Two or more races 2%
- Common ancestry
- Romanian 18% Lithuanian 5% Iranian 3%
- Foreign-born
- 3% · Canada
- Languages at home
- 94% English-only · Spanish 4% French/Haitian/Cajun 1% Other Indo-European 1%
Political lean MEDSL · Saratoga
- 2024 margin
- Toss-up / Even · D 50.9% · R 49.1%
- 2008→2024 swing
- -1.6pp toward R · 2008: 3.4pp · 2024: 1.8pp
- All cycles
- 2024: D+1.8 2020: D+5.4 2016: R+4.4 2012: D+2.1 2008: D+3.4
Not yet ingested
- Civics
- —
Market trends
- HPI YoY
- ▲ 26.95%
- Current HPI
- 358.2316
- Rent YoY
- —
- Metro
- —
- State GDP YoY
- ▲ 2.60%
- F500 in state
- 92
Industry mix (Fortune 500 HQ in NY)
| Industry | F500 HQs | Revenue |
|---|---|---|
| Financial Services | 10 | $950B |
|
||
| Consumer Goods | 9 | $162B |
|
||
| Insurance | 4 | $225B |
|
||
| Telecommunications | 2 | $144B |
|
||
| Pharmaceuticals | 2 | $112B |
|
||
| Media / Entertainment | 2 | $69B |
|
||
Price history
+99.6% since first listed13 events — show timeline
- 2026-05-04 Pending — Global MLS
- 2026-04-06 Listed $359,000 Global MLS
- 2016-12-02 Listing Removed — Global MLS
- 2016-06-24 Relisted — Global MLS
- 2016-06-22 Listing Removed — Global MLS
- 2016-06-20 Relisted — Global MLS
- 2016-06-18 Listing Removed — Global MLS
- 2016-05-16 Price Changed $177,900 Global MLS
- 2016-04-16 Price Changed $178,900 Global MLS
- 2015-11-06 Listed $179,000 Global MLS
- 2008-03-24 Sold (Public Records) $167,500 Public Records
- 2008-03-21 Sold (MLS) $167,500 Global MLS
- 2007-09-19 Listed $179,900 Global MLS
Property tax history
-2.1%/yrLatest (2025): $3,683 · +2.8% YoY. Source: county tax records.
Cash-flow waterfall
monthlySold comps — $/sqft
last 12 mo · ≤1 miLoading sold comps…