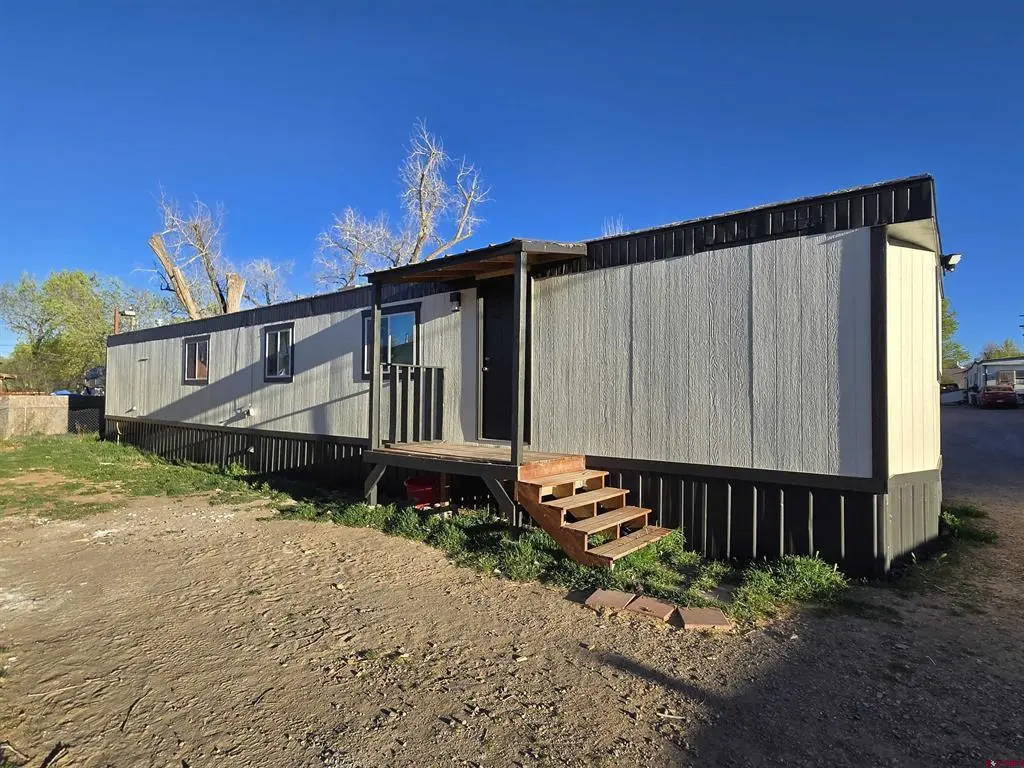
520 E 2nd St #11 · Cortez, CO
Flood risk 1/10 · Minimal
- FEMA flood zone
- X (unshaded)
- Chance of flooding over 30 yrs
- 0.0%
- Est. flood insurance / yr
- $507 – $1,088
Fire risk 6/10 · Moderate
- Est. fire insurance / yr
- $939 – $1,743
Heat risk 3/10 · Minor
- Hot days now (above 91°F)
- 7 days/yr
- Hot days in 30 yrs
- 18 days/yr
Wind risk 1/10 · Minimal
- Chance of severe wind over 30 yrs
- —
Air-quality risk 1/10 · Minimal
- Unhealthy air days now
- 0 days/yr
- Unhealthy air days in 30 yrs
- 0 days/yr
Risk factors via First Street. Map © Google.
Why this score? — see what drove the B grade
The composite is a weighted blend of 9 inputs, each scored 0–100. Each bar is that input's sub-score; the figure is the points it added to the 100-point composite (weight × sub-score).
- Cash flow +30.0/30.0
- 1% rule +10.0/10.0
- DSCR +10.0/10.0
- ARV discount +7.5/15.0
- Condition / age +4.8/5.0
- Livability +3.4/5.0
- Rent growth +2.5/5.0
- Schools +2.1/10.0
- Appreciation +0.0/10.0
$79,900
🖨 Deal sheet 📄 Offer letter ✓ Due diligence
Listing remarks
Completely remodeled and move-in ready, this stunning 2-bedroom, 1-bathroom, 924 sq ft single-wide mobile home is a must-see! The interior has been beautifully updated from top to bottom, offering a fresh, modern feel that truly stands out. Located just one block off Main Street, you’ll love the convenience of being close to shopping, schools, and the hospital. With lot rent at an exceptionally low $350/month for the area, this property offers incredible value. Don’t miss this great opportunity. Schedule your showing today!
Key facts
- Built 1982
- Listed 84 days
Property features AI
Exterior
- Utilities: Public water; Public sewer
- Home design: Single wide mobile home; Built in 2026
- Exterior features: City street frontage; Residential single-family use
Interior
- Kitchen: Microwave; Oven; Range; Refrigerator
- Flooring: Vinyl
- Bathrooms: One three-quarter bathroom
- Heating & cooling: Forced air heating (natural gas); Evaporative cooling
- Interior features: Breakfast bar; Eat-in kitchen; Kitchen island; Unfurnished
Neighborhood map
What this means for you Summary
Snapshot
- This is a 2-bed/1.0-bath manufactured listed at $80k. Condition is rated excellent.
Deal economics
- At list price, monthly cash flow is $585 ($7k/yr) — positive.
- The deal already cash-flows at list — no discount required.
- Meets the 1% rule at list price ($1k rent vs $80k).
- Recommended offer: $75k (6.0% below list) — sets the bar for market timing.
- Cap rate 15.1% vs local median 3.3% in Cortez — top-decile yield for the area; either an underpriced asset or a hidden risk that comps aren't pricing in. Stress-test before assuming the spread holds.
Location & tenants
- Location reads 67/100 on livability (#125 in CO) — a middle-class / working-renter tenant base. Strengths: cost of living A+, health & safety A+, housing A; Watch: schools D-, crime F, amenities F.
- Montezuma-Cortez School District No. Re-1 (town): math 16% / reading 33% proficiency, ranked #70 of 86 in CO (top 81%) — low school quality limits family demand, transient renter base, plan for 1-2y turnover.
- Market conditions: 223 active listings in the ZIP; 5 comparable units currently listed for rent nearby; rentals leasing fast (median 3d on market — plan ~1-2 weeks tenant-placement turnaround); 24 units permitted in Montezuma County in 2024 (0 in 5+ unit buildings).
Forward outlook
- Local home prices are declining (-3.0%/yr); year-one equity from $552 of loan paydown is wiped out by about $2k of value loss. Plan a longer hold.
- At projected returns (-3.0% appreciation + 3.0% rent growth), your $22k cash investment doubles in ~4 years — after that, you're playing with house money.
Negotiation context
- It's been on market 84 days — a 6% lower offer ($75k) is reasonable based on typical stale-listing flexibility.
Risks & watch-outs
- Climate carrying-cost: major wildfire risk — expect insurance premiums to compound above CPI over the hold.
Questions for the listing agent
- It's been on market 84 days. Have you received any prior offers? Is the seller open to a 6% concession, seller financing, or rate buy-down credit?
- Why hasn't it sold? Are there any deal-killer items the seller is aware of (foundation, flood, title, zoning, code violations)?
- Is there a deadline driving the sale (1031 exchange, divorce, estate, relocation)? That informs how much negotiation room exists.
- Schools are D-rated, which usually means shorter tenancies and higher turnover. Who's the typical renter profile here, and what's been the actual vacancy rate?
- Crime grade is F in this area — have there been break-ins, vandalism, or insurance claims at this property in the last 3 years? What carrier currently insures it and at what premium?
- What's the average days-on-market for RENTAL listings here right now (not sales)? A rising rental-DOM trend means longer vacancies and softer asking-rent achievability than the comps imply.
- What's the recent tenant-quality profile in this submarket — average credit score on applications, eviction rate, late-payment / NSF rate, and stable-employment percentage? A property-management company in the area should have these aggregated.
- How much new for-sale + rental construction is in the pipeline within 1–3 miles? Heavy new supply typically softens prices + rents 12–24 months out; constrained supply supports both.
Investment metrics
- 1% rule
- 1.80% ✓
- Cap rate
- 15.08%
- Cash-on-cash
- 31.37%
- DSCR
- 2.40
- GRM
- 4.6
CMA / ARV
No comps found within radius.
Projected returns pro-forma
-3.0% appreciation · 3.0% rent growth · sell at horizon
- IRR
- 26.2%
- Equity multiple
- 2.09×
- Total profit
- $24,318
- Equity at exit
- $11,913
- IRR
- 33.9%
- Equity multiple
- 4.09×
- Total profit
- $69,221
- Equity at exit
- $6,908
Cash invested: $22,372 (down + closing). Projections, not guarantees.
Landlord ↔ Tenant lean methodology
- Overall (STATE)
- 38 Tenant-Leaning
- State Colorado
- 38 Tenant-Leaning · D+4
- County
- — inherits STATE
- City
- — inherits STATE
ZIP-level market 81321
- Active inventory
- 223
- Price-to-rent
- 4.6×
Monthly cashflow live
- Estimated rent
- $1,439 high interval (Pro) →
- Mortgage (P&I)
- −$419
- Tax est. 1.5%
- −$100 /mo · $1,198/yr
- Insurance
- −$33
- HOA
- −$0
- Vacancy / Maint / Mgmt
- −$302
- Net cashflow
- $585
Break-even live
UW: 25.0% down · 7.5% · 30yr · 1.5% tax · 5.0% vac · 8.0% maint · 8.0% mgmt
Financing live
Cash to close
- Down payment
- $19,975
- Closing costs
- $2,397
- Reserves months
- —
- Total cash needed
- —
Loan-product check · same deal, 3 products live
Conventional
25% down · 7.5% · 30yr
- Down + closing
- —
- Monthly P&I
- —
- Monthly cashflow
- —
- DSCR
- —
- Eligible?
- —
Personal DTI + credit; lowest rate.
DSCR
20% down · 8.5% · 30yr
- Down + closing
- —
- Monthly P&I
- —
- Monthly cashflow
- —
- DSCR
- —
- Eligible?
- —
No personal income docs; deal must DSCR.
Hard money
10% down · 12.0% · 12mo
- Down + closing
- —
- Monthly P&I
- —
- Monthly cashflow
- —
- DSCR
- —
- Eligible?
- —
Short-term bridge; refi at stabilization.
Rent comps 5 comps
| Address | Beds | Baths | Sqft | Rent | $/sqft | DOM | Units | Dist |
|---|---|---|---|---|---|---|---|---|
| 446 S Linden St Cortez, CO | 2.0 | 1.0 | 1040 | $1,700 | $1.63 | 2d | 1 | 0.64mi |
| 469 W 2nd St Unit 2 Cortez, CO | 2.0 | 1.0 | 580 | $1,600 | $2.76 | 2d | 1 | 0.76mi |
| 469 W 2nd St Unit 1 Cortez, CO | 1.0 | 1.0 | 582 | $1,250 | $2.15 | 2d | 1 | 0.76mi |
| 435 W 3rd St Cortez, CO | 1.0 | 1.0 | 650 | $775 | $1.19 | 2d | 1 | 0.77mi |
| 417 S Cedar St Cortez, CO | 2.0 | 1.0 | 760 | $1,350 | $1.78 | 23d | 1 | 0.92mi |
Listing history 17 events
-
2026-06-18days on market $79,900 Active 84 DOM
-
2026-06-17days on market $79,900 Active 83 DOM
-
2026-06-16days on market $79,900 Active 82 DOM
-
2026-06-15days on market $79,900 Active 81 DOM
-
2026-06-14days on market $79,900 Active 79 DOM
-
2026-06-10days on market $79,900 Active 76 DOM
-
2026-06-09days on market $79,900 Active 75 DOM
-
2026-06-08days on market $79,900 Active 74 DOM
-
2026-06-07days on market $79,900 Active 73 DOM
-
2026-06-05days on market $79,900 Active 70 DOM
-
2026-06-03days on market $79,900 Active 69 DOM
-
2026-06-02days on market $79,900 Active 68 DOM
-
2026-06-01days on market $79,900 Active 67 DOM
-
2026-05-31days on market $79,900 Active 66 DOM
-
2026-05-31days on market $79,900 Active 65 DOM
-
2026-05-11price $79,900
-
2026-03-26$85,000 Active
ⓘ Source: listings_history table (triggers on properties + properties_extension) + one-shot
backfill from property_details.listing_events for pre-trigger history.
Climate risk First Street
- Flood 1/10 Low FEMA zone X (unshaded) · 0% chance over 30 yrs
- Wildfire 6/10 Major
- Heat 3/10 Moderate 7 d/yr ≥91°F today · 18 d/yr by 30 yrs out
- Wind 1/10 Low
- Air quality 1/10 Low 0 unhealthy d/yr today · 0 by 30 yrs out
Nearby sold comps map
Loading sold comps map…
Walkable amenities ~0.75 mi
Loading nearby amenities…
Taxation est. · year 1
- Rental income
- $17,270
- − Mortgage interest
- −$4,476
- − Property taxes
- −$1,198
- − Insurance
- −$400
- − Repairs & maintenance
- −$1,382
- − Management
- −$1,382
- − Depreciation
- −$2,324
- Taxable income
- $6,109
- Est. tax owed @ 24.0%
- −$1,466
- After-tax cash flow
- $5,551/yr
For passive investors: Depreciation is non-cash, so a rental often shows a tax loss while cash-flowing — sheltering income. Rental losses are passive: they offset passive income freely, and up to $25,000/yr can offset ordinary (W-2) income if you actively participate and your MAGI is under $100k (phasing out to $0 by $150k); unused losses carry forward. On sale, claimed depreciation is recaptured at up to 25%, and gains may owe capital-gains tax (a 1031 exchange can defer both). Figures are a year-1 estimate at your 24.0% rate — not tax advice; consult a CPA.
Condition & rehab AI · 13 photos
This completely remodeled and move-in ready mobile home is in excellent condition with no visible repairs or maintenance needed. The home is located in a convenient location and offers incredible value with a low lot rent of $350/month.
Value-add opportunities
- Resale Painting the exterior siding and roof — A fresh coat of paint can enhance the curb appeal and make the home look more inviting to potential buyers.
- Rental Landscaping the front yard — A well-maintained front yard can attract more tenants and make the home more appealing to potential renters.
Renovation cost estimate screening
Value-add ROI direction
- Resale Painting the exterior siding and roof — A fresh coat of paint can enhance the curb appeal and make the home look more inviting to potential buyers. ↑
- Rental Landscaping the front yard — A well-maintained front yard can attract more tenants and make the home more appealing to potential renters. ↑
ⓘ Cost ranges are severity-bucket heuristics (US national rule-of-thumb). Get contractor quotes + a written scope before underwriting a rehab budget.
Schools (NCES district)
- District
- Montezuma-Cortez School District No. Re-1
- NCES district ID
- 0803090
- Math proficiency
- 16% ▼ -2.00%
- Reading proficiency
- 33% ▼ -1.00%
- Median HH income
- $42,394
- Composite
- 20.85/100
- National rank
- #8499
- State rank
- #70 of 86 in CO
Livability — Cortez
- Score
- 67/100
- State rank
- #125
- US rank
- #10641
Category grades
Schools grade is shown separately in the Schools card above.
Census & demographics
- Census place
- Cortez, CO
- County
- Montezuma County · 18,723 people
- City population
- 14,236
- Metro
- nan
- Population (ZIP)
- 14,236
- Household income
- $59,506
- Rent vs Own
- Severe rent burden
- 403.0
Population outlook (Montezuma County) Hauer SSP2
- Today (2025)
- 26,943 people
- By 2030
- 27,208 · +1.0%
- By 2040
- 27,372 · +1.6%
- By 2050
- 27,180 · +0.9%
- By 2075
- 26,493 · -1.7%
- By 2100
- 23,364 · -13.3%
Race, ethnicity, and origin ACS 2023
- Neighborhood character
- Predominantly White (69%)
- Race & ethnicity
- White 69% Hispanic / Latino 15% Two or more races 10% Native American 9% Asian 1% Black 1%
- Hispanic origin (detail)
- Mexican 9%
- Common ancestry
- Slovak 3% Iranian 3% Italian 2%
- Foreign-born
- 4% · Canada, China
- Languages at home
- 87% English-only · Spanish 6% Chinese 1% Russian/Polish/Slavic 1%
Political lean MEDSL · Montezuma
- 2024 margin
- Strong R (+21.0) · D 38.3% · R 59.3% · Other 2.5%
- 2008→2024 swing
- -1.6pp toward R · 2008: -19.4pp · 2024: -21.0pp
- All cycles
- 2024: R+21.0 2020: R+22.4 2016: R+30.3 2012: R+23.6 2008: R+19.4
Not yet ingested
- Civics
- —
Market trends
- HPI YoY
- ▼ -274.25%
- Current HPI
- 264.2281
- Rent YoY
- —
- Metro
- nan
- State GDP YoY
- ▲ 1.95%
- F500 in state
- 14
Industry mix (Fortune 500 HQ in CO)
| Industry | F500 HQs | Revenue |
|---|---|---|
| Technology Distribution | 1 | $31B |
|
||
| Food / Agriculture | 1 | $18B |
|
||
| Packaging | 1 | $14B |
|
||
| Healthcare | 1 | $13B |
|
||
| Energy | 1 | $10B |
|
||
| Technology | 1 | $4B |
|
||
Price history
-6.0% since first listed2 events — show timeline
- 2026-05-11 Price Changed $79,900 cren
- 2026-03-26 Listed $85,000 cren
Cash-flow waterfall
monthlySold comps — $/sqft
last 12 mo · ≤1 miLoading sold comps…