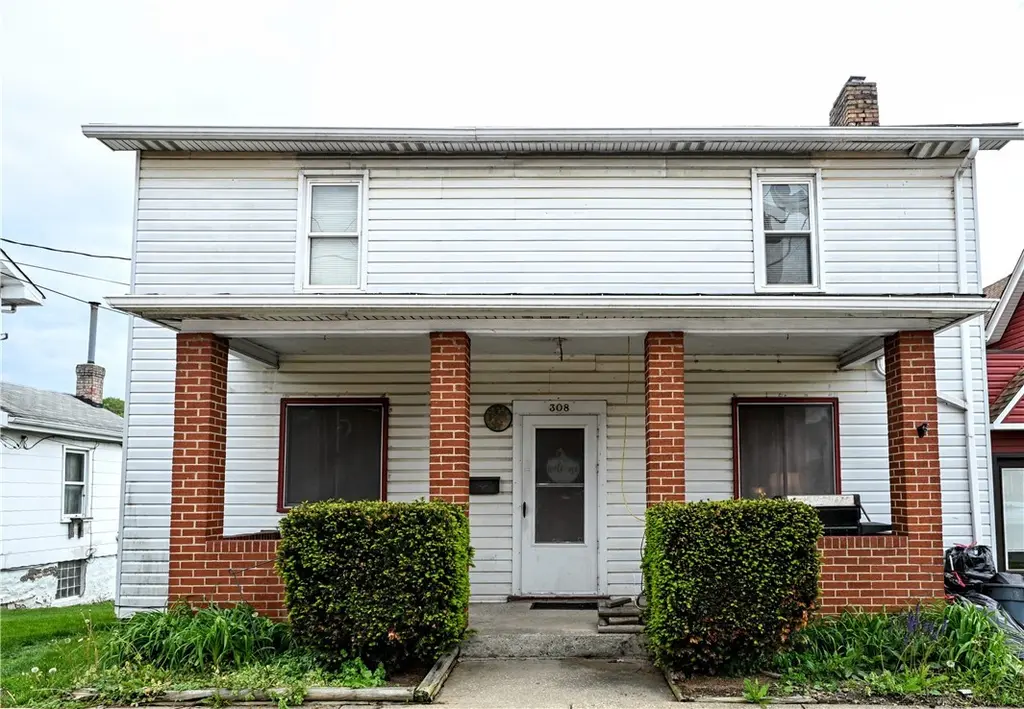
308 E Lincoln Ave · McDonald, PA
Flood risk 1/10 · Minimal
- FEMA flood zone
- X (unshaded)
- Chance of flooding over 30 yrs
- 0.0%
- Est. flood insurance / yr
- $473 – $860
Fire risk 1/10 · Minimal
- Est. fire insurance / yr
- $511 – $949
Heat risk 4/10 · Minor
- Hot days now (above 96°F)
- 7 days/yr
- Hot days in 30 yrs
- 19 days/yr
Wind risk 2/10 · Minimal
- Chance of severe wind over 30 yrs
- 0.0%
Air-quality risk 2/10 · Minimal
- Unhealthy air days now
- 1 days/yr
- Unhealthy air days in 30 yrs
- 2 days/yr
Risk factors via First Street. Map © Google.
Why this score? — see what drove the B- grade
The composite is a weighted blend of 9 inputs, each scored 0–100. Each bar is that input's sub-score; the figure is the points it added to the 100-point composite (weight × sub-score).
- Cash flow +23.7/30.0
- ARV discount +15.0/15.0
- DSCR +7.6/10.0
- 1% rule +6.9/10.0
- Schools +4.1/10.0
- Livability +3.7/5.0
- Rent growth +2.5/5.0
- Condition / age +2.5/5.0
- Appreciation +0.0/10.0
$109,000
🖨 Deal sheet 📄 Offer letter ✓ Due diligence
Listing remarks MLS
IMMACULATE TWO BEDROOM HOME, GREAT STARTER HOME, LARGE ROOMS, ALL APPLIANCES INCLUDED INCLUDING WASHER AND DRYER NICE LEVEL BACKYARD, GREAT PRICE MUST SEE!
Key facts
- Hidden fireplace
- Ample closet space
- Large kitchen
Tags
Property features AI
Exterior
- Parking: On-street parking
- Utilities: Public water; Public sewer
- Home design: 2 stories; Resale property
- Construction: Vinyl siding; Asphalt roof
- Exterior features: Part lots 173-174
Interior
- Kitchen: Kitchen on main level (10 x 11); Microwave; Refrigerator; Stove; Some gas appliances
- Bedrooms: Bedroom 2 on upper level (14 x 15)
- Flooring: Carpet; Hardwood; Vinyl
- Bathrooms: 2 full bathrooms
- Heating & cooling: Gas heating; Central air conditioning
- Interior features: Unfinished walk-out basement; Bonus room (basement)
- Laundry & utility: Laundry room in basement (11 x 11)
Neighborhood map
What this means for you Summary
Snapshot
- This is a 2-bed/2.0-bath single-family listed at $109k.
Deal economics
- At list price, monthly cash flow is $207 ($2k/yr) — positive.
- The deal already cash-flows at list — no discount required.
- Meets the 1% rule at list price ($1k rent vs $109k).
- Recommended offer: $106k (3.0% below list) — sets the bar for market timing.
Location & tenants
- Location reads 73/100 on livability (#590 in PA) — a middle-class / working-renter tenant base. Strengths: crime A+, cost of living A+, housing A+; Watch: health & safety D, amenities F, commute F.
- Fort Cherry SD (rural): math 34% / reading 62% proficiency, ranked #213 of 539 in PA (top 40%) — families likely to look elsewhere, expect single-tenant / working-renter base with shorter leases.
- Market conditions: 99 active listings in the ZIP; 1 comparable units currently listed for rent nearby; 489 units permitted in Washington County in 2024 (30 in 5+ unit buildings).
Forward outlook
- Local home prices are declining (-3.0%/yr); year-one equity from $754 of loan paydown is wiped out by about $3k of value loss. Plan a longer hold.
- Washington County population projected to shrink 6% by 2050 — rents likely to lag national; underwrite the cash flow, not the appreciation.
Negotiation context
- It's been on market 31 days — a 3% lower offer ($106k) is reasonable based on typical stale-listing flexibility.
- 2 sale attempts since 17y ago; this cycle's ask has dropped $10k (8%) from the opening price — seller is motivated, your offer sets the floor, not the list.
- Current owner paid $49k; list at $109k implies a 121% gain — meaningful room to come down on a strong offer.
Risks & watch-outs
- Watch-outs: built in 1898 — expect roof / HVAC / electrical / plumbing capex.
Questions for the listing agent
- It's been on market 31 days. Have you received any prior offers? Is the seller open to a 3% concession, seller financing, or rate buy-down credit?
- Built in 1898 — when were the roof, HVAC, electrical panel, plumbing, and water heater last replaced?
- Is there a deadline driving the sale (1031 exchange, divorce, estate, relocation)? That informs how much negotiation room exists.
- Schools are A-rated — typically a magnet for longer-tenancy family renters. What's the average tenant stay here, and is there a school-zone premium baked into asking?
- What's the average days-on-market for RENTAL listings here right now (not sales)? A rising rental-DOM trend means longer vacancies and softer asking-rent achievability than the comps imply.
- What's the recent tenant-quality profile in this submarket — average credit score on applications, eviction rate, late-payment / NSF rate, and stable-employment percentage? A property-management company in the area should have these aggregated.
- How much new for-sale + rental construction is in the pipeline within 1–3 miles? Heavy new supply typically softens prices + rents 12–24 months out; constrained supply supports both.
Investment metrics
- 1% rule
- 1.19% ✓
- Cap rate
- 8.57%
- Cash-on-cash
- 8.12%
- DSCR
- 1.36
- GRM
- 7.0
CMA / ARV
- ARV (median comp)
- $135,781
- List price
- $109,000
- Delta
- -19.72%
- Verdict
- UNDERPRICED
- Comps
- 20 within 1.0 mi
Show comp detail 12 sales within ~0.75 mi
| Address | Dist | Beds/Ba | Sqft | Sold | Price | $/sf | Match |
|---|---|---|---|---|---|---|---|
| 208 Center Ave | 0.08mi | 2/1.0 | 1,248 (+2%) | 1mo | $220,000 | $176 | 88 |
| 114 Center Ave | 0.04mi | 2/2.0 | 1,178 (-3%) | 22mo | $185,000 | $157 | 74 |
| 142 North St | 0.23mi | 2/1.5 | 1,312 (+8%) | 1mo | $265,000 | $202 | 74 |
| 1223 Laurel Hill Rd | 0.40mi | 3/1.0 (+1) | 1,194 (-2%) | 2mo | $175,000 | $147 | 67 |
| 115 Terrace St | 0.28mi | 3/2.0 (+1) | 1,198 (-2%) | 15mo | $165,000 | $138 | 67 |
| 345 Fannie St | 0.26mi | 3/1.5 (+1) | 1,348 (+11%) | 12mo | $225,000 | $167 | 53 |
| 108 Terrace St | 0.28mi | 3/2.0 (+1) | 1,342 (+10%) | 14mo | $206,500 | $154 | 53 |
| 334 Valley St | 0.30mi | 2/1.5 | 1,067 (-12%) | 18mo | $234,900 | $220 | 48 |
| 39 Laurel Hill Rd | 0.45mi | 3/1.0 (+1) | 1,259 (+3%) | 20mo | $78,900 | $63 | 48 |
| 407 4th St | 0.54mi | 3/1.0 (+1) | 1,320 (+8%) | 15mo | $220,000 | $167 | 39 |
| 532 North St | 0.63mi | 3/2.0 (+1) | 1,386 (+14%) | 8mo | $175,000 | $126 | 36 |
| 447 Valley St | 0.63mi | 2/1.5 | 1,087 (-11%) | 23mo | $203,000 | $187 | 32 |
Match score weights: distance 35% · size 25% · config 20% · recency 20%. Top-matched comps best support the ARV.
Projected returns pro-forma
-3.0% appreciation · 3.0% rent growth · sell at horizon
- IRR
- -3.9%
- Equity multiple
- 0.85×
- Total profit
- $-4,449
- Equity at exit
- $16,252
- IRR
- 5.9%
- Equity multiple
- 1.44×
- Total profit
- $13,302
- Equity at exit
- $9,424
Cash invested: $30,520 (down + closing). Projections, not guarantees.
Landlord ↔ Tenant lean methodology
- Overall (STATE)
- 62 Landlord-Friendly
- State Pennsylvania
- 62 Landlord-Friendly · EVEN
- County
- — inherits STATE
- City
- — inherits STATE
ZIP-level market 15057
- Home prices YoY
- -10.7%
- Active inventory
- 99
- Price-to-rent
- 7.0×
Monthly cashflow live
- Estimated rent
- $1,295 medium interval (Pro) →
- Mortgage (P&I)
- −$572
- Tax from tax record
- −$199 /mo · $2,394/yr
- Insurance
- −$45
- HOA
- −$0
- Vacancy / Maint / Mgmt
- −$272
- Net cashflow
- $207
Break-even live
UW: 25.0% down · 7.5% · 30yr · 1.5% tax · 5.0% vac · 8.0% maint · 8.0% mgmt
Financing live
Cash to close
- Down payment
- $27,250
- Closing costs
- $3,270
- Reserves months
- —
- Total cash needed
- —
Loan-product check · same deal, 3 products live
Conventional
25% down · 7.5% · 30yr
- Down + closing
- —
- Monthly P&I
- —
- Monthly cashflow
- —
- DSCR
- —
- Eligible?
- —
Personal DTI + credit; lowest rate.
DSCR
20% down · 8.5% · 30yr
- Down + closing
- —
- Monthly P&I
- —
- Monthly cashflow
- —
- DSCR
- —
- Eligible?
- —
No personal income docs; deal must DSCR.
Hard money
10% down · 12.0% · 12mo
- Down + closing
- —
- Monthly P&I
- —
- Monthly cashflow
- —
- DSCR
- —
- Eligible?
- —
Short-term bridge; refi at stabilization.
Rent comps 1 comps
| Address | Beds | Baths | Sqft | Rent | $/sqft | DOM | Units | Dist |
|---|---|---|---|---|---|---|---|---|
| 101 E Lincoln Ave Unit 2 McDonald, PA | 2.0 | 1.0 | 1400 | $1,295 | $0.93 | 1d | 1 | 0.21mi |
Listing history 11 events
-
2026-06-05days on market $109,000 Active 31 DOM
-
2026-06-03days on market $109,000 Active 30 DOM
-
2026-06-02days on market $109,000 Active 29 DOM
-
2026-06-01days on market $109,000 Active 28 DOM
-
2026-05-31days on market $109,000 Active 27 DOM
-
2026-05-11price $109,000 1056-char remark
-
2026-05-04$119,000 Active 1056-char remark
-
2009-10-01soldstatus $49,300
-
2009-09-23price $47,000 155-char remark
Show marketing remark (155 chars)
IMMACULATE TWO BEDROOM HOME, GREAT STARTER HOME, LARGE ROOMS, ALL APPLIANCES INCLUDED INCLUDING WASHER AND DRYER NICE LEVEL BACKYARD, GREAT PRICE MUST SEE!
-
2009-09-22soldstatus $49,300 155-char remark
Show marketing remark (155 chars)
IMMACULATE TWO BEDROOM HOME, GREAT STARTER HOME, LARGE ROOMS, ALL APPLIANCES INCLUDED INCLUDING WASHER AND DRYER NICE LEVEL BACKYARD, GREAT PRICE MUST SEE!
-
2009-06-11$49,300 155-char remark
Show marketing remark (155 chars)
IMMACULATE TWO BEDROOM HOME, GREAT STARTER HOME, LARGE ROOMS, ALL APPLIANCES INCLUDED INCLUDING WASHER AND DRYER NICE LEVEL BACKYARD, GREAT PRICE MUST SEE!
ⓘ Source: listings_history table (triggers on properties + properties_extension) + one-shot
backfill from property_details.listing_events for pre-trigger history.
Tax reassessment forecast PA · Partial reset (capped growth)
- Current annual tax
- $2,394 · $199/mo
- Projected year-2 tax
- $2,394 · $199/mo
- Expected delta
- $0/yr ($0/mo · 0.0%)
ⓘ Screening estimate from a state-policy table — verify with the county assessor before closing.
Climate risk First Street
- Flood 1/10 Low FEMA zone X (unshaded) · 0% chance over 30 yrs
- Wildfire 1/10 Low
- Heat 4/10 Moderate 7 d/yr ≥96°F today · 19 d/yr by 30 yrs out
- Wind 2/10 Low 0% chance of damaging wind over 30 yrs
- Air quality 2/10 Low 1 unhealthy d/yr today · 2 by 30 yrs out
Nearby sold comps map
Loading sold comps map…
Walkable amenities ~0.75 mi
Loading nearby amenities…
Taxation est. · year 1
- Rental income
- $15,540
- − Mortgage interest
- −$6,106
- − Property taxes
- −$2,394
- − Insurance
- −$545
- − Repairs & maintenance
- −$1,243
- − Management
- −$1,243
- − Depreciation
- −$3,171
- Taxable income
- $838
- Est. tax owed @ 24.0%
- −$201
- After-tax cash flow
- $2,277/yr
For passive investors: Depreciation is non-cash, so a rental often shows a tax loss while cash-flowing — sheltering income. Rental losses are passive: they offset passive income freely, and up to $25,000/yr can offset ordinary (W-2) income if you actively participate and your MAGI is under $100k (phasing out to $0 by $150k); unused losses carry forward. On sale, claimed depreciation is recaptured at up to 25%, and gains may owe capital-gains tax (a 1031 exchange can defer both). Figures are a year-1 estimate at your 24.0% rate — not tax advice; consult a CPA.
Schools (NCES district)
- District
- Fort Cherry SD
- NCES district ID
- 4209960
- Math proficiency
- 34% ▼ -13.00%
- Reading proficiency
- 62% ▼ -13.00%
- Median HH income
- $51,129
- Composite
- 41.12/100
- National rank
- #3564
- State rank
- #213 of 539 in PA
Livability — McDonald
- Score
- 73/100
- State rank
- #590
- US rank
- #5635
Category grades
Schools grade is shown separately in the Schools card above.
Census & demographics
- Census place
- McDonald, PA
- Population (ZIP)
- 17,162
Population outlook (Washington County) Hauer SSP2
- Today (2025)
- 208,060 people
- By 2030
- 207,168 · -0.4%
- By 2040
- 202,738 · -2.6%
- By 2050
- 195,269 · -6.1%
- By 2075
- 175,588 · -15.6%
- By 2100
- 145,827 · -29.9%
Race, ethnicity, and origin ACS 2023
- Neighborhood character
- Predominantly White (87%)
- Race & ethnicity
- White 87% Asian 8% Two or more races 3% Hispanic / Latino 1%
- Common ancestry
- Romanian 8% Slovak 2% Serbian 2%
- Foreign-born
- 7% · China, Canada
- Languages at home
- 91% English-only · Other Asian/Pacific 5% Other Indo-European 2% Chinese 1%
Political lean MEDSL · Washington
- 2024 margin
- Strong R (+25.5) · D 36.9% · R 62.4%
- 2008→2024 swing
- -20.8pp toward R · 2008: -4.7pp · 2024: -25.5pp
- All cycles
- 2024: R+25.5 2020: R+22.8 2016: R+25.3 2012: R+13.3 2008: R+4.7
Not yet ingested
- Civics
- —
Market trends
- HPI YoY
- ▼ -31.77%
- Current HPI
- 266.0112
- Rent YoY
- —
- Metro
- —
- State GDP YoY
- ▲ 1.68%
- F500 in state
- 34
Industry mix (Fortune 500 HQ in PA)
| Industry | F500 HQs | Revenue |
|---|---|---|
| Healthcare | 2 | $309B |
|
||
| Insurance | 2 | $27B |
|
||
| Telecommunications / Media | 1 | $124B |
|
||
| Industrial Distribution | 1 | $22B |
|
||
| Financial Services | 1 | $20B |
|
||
| Chemicals / Materials | 1 | $18B |
|
||
Price history
+121.1% since first listed6 events — show timeline
- 2026-05-11 Price Changed $109,000 West Penn MLS
- 2026-05-04 Listed $119,000 West Penn MLS
- 2009-10-01 Sold (Public Records) $49,300 Public Records
- 2009-09-23 Price Changed $47,000 West Penn MLS
- 2009-09-22 Sold (MLS) $49,300 West Penn MLS
- 2009-06-11 Listed $49,300 West Penn MLS
Property tax history
+6.1%/yrLatest (2026): $2,394 · +26.9% YoY. Source: county tax records.
Cash-flow waterfall
monthlySold comps — $/sqft
last 12 mo · ≤1 miLoading sold comps…