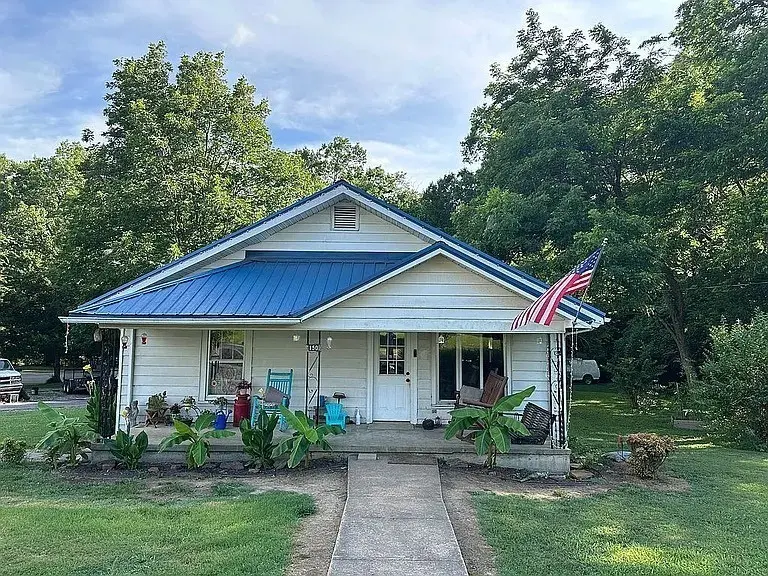
150 Jacks Creek St · Henderson, TN
Flood risk 1/10 · Minimal
- FEMA flood zone
- X (unshaded)
- Chance of flooding over 30 yrs
- 0.0%
- Est. flood insurance / yr
- $473 – $860
Fire risk 3/10 · Minor
- Est. fire insurance / yr
- $949 – $1,763
Heat risk 6/10 · Moderate
- Hot days now (above 110°F)
- 7 days/yr
- Hot days in 30 yrs
- 20 days/yr
Wind risk 4/10 · Minor
- Chance of severe wind over 30 yrs
- 17.0%
Air-quality risk 1/10 · Minimal
- Unhealthy air days now
- 0 days/yr
- Unhealthy air days in 30 yrs
- 0 days/yr
Risk factors via First Street. Map © Google.
Why this score? — see what drove the D grade
The composite is a weighted blend of 9 inputs, each scored 0–100. Each bar is that input's sub-score; the figure is the points it added to the 100-point composite (weight × sub-score).
- Cash flow +13.8/30.0
- ARV discount +10.2/15.0
- DSCR +4.2/10.0
- Schools +3.3/10.0
- Livability +3.2/5.0
- 1% rule +2.9/10.0
- Rent growth +2.5/5.0
- Condition / age +2.5/5.0
- Appreciation +0.0/10.0
$159,000
🖨 Deal sheet 📄 Offer letter ✓ Due diligence
Listing remarks MLS
Location Location Location.. Home perfectly located in the heart of Henderson! This property offers unbeatable convenience, just a short walk to Freed-Hardeman University, local restaurants, coffee shops, and all the best area amenities. Whether you’re looking for a personal home or an investment opportunity, this prime location delivers. It has a metal roof, and an Acre Land. Location truly is everything—don’t miss your chance to own a property right in the center of it all! Can Easily be rented for $1500 a month!
Key facts
- 1.09 acre lot
- Built 1940
- Listed 192 days
Neighborhood map
What this means for you Summary
Snapshot
- This is a 3-bed/1.0-bath single-family listed at $159k.
Deal economics
- At list price, monthly cash flow is $15 ($176/yr) — positive.
- The deal already cash-flows at list — no discount required.
- To meet the 1% rule (rent ≥ 1% of price), the offer needs to be $125k (21.5% below list).
- Recommended offer: $125k (21.5% below list) — sets the bar for 1% rule.
- Cap rate 6.4% vs local median 3.5% in Henderson — top-decile yield for the area; either an underpriced asset or a hidden risk that comps aren't pricing in. Stress-test before assuming the spread holds.
Location & tenants
- Location reads 65/100 on livability (#150 in TN) — a middle-class / working-renter tenant base. Strengths: cost of living A+, crime A, housing B; Watch: health & safety C-, schools D-, amenities F.
- Chester County (rural): math 42% / reading 37% proficiency, ranked #15 of 139 in TN (top 11%) — families likely to look elsewhere, expect single-tenant / working-renter base with shorter leases.
- Market conditions: 97 active listings in the ZIP; 18 units permitted in Chester County in 2024 (0 in 5+ unit buildings).
Forward outlook
- Local home prices are declining (-3.0%/yr); year-one equity from $1k of loan paydown is wiped out by about $5k of value loss. Plan a longer hold.
Negotiation context
- It's been on market 193 days — a 12% lower offer ($140k) is reasonable based on typical stale-listing flexibility.
- 2 sale attempts since 8y ago with the ask held roughly flat each time — persistent listings suggest the price (not the market) is what's stuck; bring a comps-based counter.
- Current owner paid $68k; list at $159k implies a 132% gain — meaningful room to come down on a strong offer.
Risks & watch-outs
- Watch-outs: built in 1940 — expect roof / HVAC / electrical / plumbing capex.
- Climate carrying-cost: extreme-heat days projected 7→20/yr by 2055 (HVAC capex compounding) — expect insurance premiums to compound above CPI over the hold.
Questions for the listing agent
- It's been on market 193 days. Have you received any prior offers? Is the seller open to a 21% concession, seller financing, or rate buy-down credit?
- Built in 1940 — when were the roof, HVAC, electrical panel, plumbing, and water heater last replaced?
- Why hasn't it sold? Are there any deal-killer items the seller is aware of (foundation, flood, title, zoning, code violations)?
- Is there a deadline driving the sale (1031 exchange, divorce, estate, relocation)? That informs how much negotiation room exists.
- Schools are D-rated, which usually means shorter tenancies and higher turnover. Who's the typical renter profile here, and what's been the actual vacancy rate?
- The area grade is low — what's the realistic commute time and amenity access for the typical tenant pool here? Any planned neighborhood developments (good or bad) we should know about?
- What's the average days-on-market for RENTAL listings here right now (not sales)? A rising rental-DOM trend means longer vacancies and softer asking-rent achievability than the comps imply.
- What's the recent tenant-quality profile in this submarket — average credit score on applications, eviction rate, late-payment / NSF rate, and stable-employment percentage? A property-management company in the area should have these aggregated.
- How much new for-sale + rental construction is in the pipeline within 1–3 miles? Heavy new supply typically softens prices + rents 12–24 months out; constrained supply supports both.
Investment metrics
- 1% rule
- 0.79% ✗
- Cap rate
- 6.40%
- Cash-on-cash
- 0.40%
- DSCR
- 1.02
- GRM
- 10.6
CMA / ARV
- ARV (median comp)
- $169,277
- List price
- $159,000
- Delta
- -6.07%
- Verdict
- FAIR
- Comps
- 20 within 1.0 mi
Show comp detail 7 sales within ~0.75 mi
| Address | Dist | Beds/Ba | Sqft | Sold | Price | $/sf | Match |
|---|---|---|---|---|---|---|---|
| 457 Kendyl Cv | 0.41mi | 3/2.0 | 1,555 (+11%) | 6mo | $240,000 | $154 | 53 |
| 330 Courtney Cv | 0.27mi | 3/2.0 | 1,577 (+13%) | 19mo | $255,000 | $162 | 46 |
| 419 White Ave | 0.53mi | 2/2.0 (-1) | 1,292 (-7%) | 10mo | $120,000 | $93 | 45 |
| 462 Mifflin Ave | 0.42mi | 2/2.0 (-1) | 1,203 (-14%) | 5mo | $177,500 | $148 | 44 |
| 470 Hill Ave | 0.55mi | 4/2.0 (+1) | 1,475 (+6%) | 14mo | $210,000 | $142 | 44 |
| 313 Iris St | 0.65mi | 3/2.0 | 1,303 (-7%) | 14mo | $132,900 | $102 | 43 |
| 608 Rosebud St | 0.71mi | 3/1.5 | 1,258 (-10%) | 14mo | $170,000 | $135 | 37 |
Match score weights: distance 35% · size 25% · config 20% · recency 20%. Top-matched comps best support the ARV.
Projected returns pro-forma
-3.0% appreciation · 3.0% rent growth · sell at horizon
- IRR
- -15.7%
- Equity multiple
- 0.44×
- Total profit
- $-24,889
- Equity at exit
- $23,707
- IRR
- -7.4%
- Equity multiple
- 0.53×
- Total profit
- $-20,710
- Equity at exit
- $13,747
Cash invested: $44,520 (down + closing). Projections, not guarantees.
Landlord ↔ Tenant lean methodology
- Overall (STATE)
- 87 Strongly Landlord-Friendly
- State Tennessee
- 87 Strongly Landlord-Friendly · R+13
- County
- — inherits STATE
- City
- — inherits STATE
ZIP-level market 38340
- Home prices YoY
- -19.1%
- Active inventory
- 97
- Price-to-rent
- 10.6×
Monthly cashflow live
- Estimated rent
- $1,249 medium interval (Pro) →
- Mortgage (P&I)
- −$834
- Tax from tax record
- −$72 /mo · $863/yr
- Insurance
- −$66
- HOA
- −$0
- Vacancy / Maint / Mgmt
- −$262
- Net cashflow
- $15
Break-even live
UW: 25.0% down · 7.5% · 30yr · 1.5% tax · 5.0% vac · 8.0% maint · 8.0% mgmt
Financing live
Cash to close
- Down payment
- $39,750
- Closing costs
- $4,770
- Reserves months
- —
- Total cash needed
- —
Loan-product check · same deal, 3 products live
Conventional
25% down · 7.5% · 30yr
- Down + closing
- —
- Monthly P&I
- —
- Monthly cashflow
- —
- DSCR
- —
- Eligible?
- —
Personal DTI + credit; lowest rate.
DSCR
20% down · 8.5% · 30yr
- Down + closing
- —
- Monthly P&I
- —
- Monthly cashflow
- —
- DSCR
- —
- Eligible?
- —
No personal income docs; deal must DSCR.
Hard money
10% down · 12.0% · 12mo
- Down + closing
- —
- Monthly P&I
- —
- Monthly cashflow
- —
- DSCR
- —
- Eligible?
- —
Short-term bridge; refi at stabilization.
Listing history 20 events
-
2026-06-18days on market $159,000 Active 193 DOM
-
2026-06-17days on market $159,000 Active 192 DOM
-
2026-06-16days on market $159,000 Active 191 DOM
-
2026-06-15days on market $159,000 Active 190 DOM
-
2026-06-13days on market $159,000 Active 188 DOM
-
2026-06-12days on market $159,000 Active 187 DOM
-
2026-06-09days on market $159,000 Active 184 DOM
-
2026-06-08days on market $159,000 Active 183 DOM
-
2026-06-08days on market $159,000 Active 182 DOM
-
2026-06-07days on market $159,000 Active 181 DOM
-
2026-06-04days on market $159,000 Active 178 DOM
-
2026-06-02days on market $159,000 Active 177 DOM
-
2026-06-01days on market $159,000 Active 176 DOM
-
2026-05-31days on market $159,000 Active 175 DOM
-
2025-12-08$159,000 Active 538-char remark
Show marketing remark (538 chars)
Location Location Location.. Home perfectly located in the heart of Henderson! This property offers unbeatable convenience, just a short walk to Freed-Hardeman University, local restaurants, coffee shops, and all the best area amenities. Whether you’re looking for a personal home or an investment opportunity, this prime location delivers. It has a metal roof, and an Acre Land. Location truly is everything—don’t miss your chance to own a property right in the center of it all! Can Easily be rented for $1500 a month!
-
2025-12-05historical $159,000 538-char remark
Show marketing remark (538 chars)
Location Location Location.. Home perfectly located in the heart of Henderson! This property offers unbeatable convenience, just a short walk to Freed-Hardeman University, local restaurants, coffee shops, and all the best area amenities. Whether you’re looking for a personal home or an investment opportunity, this prime location delivers. It has a metal roof, and an Acre Land. Location truly is everything—don’t miss your chance to own a property right in the center of it all! Can Easily be rented for $1500 a month!
-
2018-11-07soldstatus $68,500
-
2018-11-05soldstatus $68,000 190-char remark
Show marketing remark (190 chars)
Three-bedroom 2 bath home located in the city limits. Has beautiful hardwood floors. The house has a metal roof and an almost new Heat and Air unit. It is price to sale and is move in ready.
-
2018-08-16$72,000 190-char remark
Show marketing remark (190 chars)
Three-bedroom 2 bath home located in the city limits. Has beautiful hardwood floors. The house has a metal roof and an almost new Heat and Air unit. It is price to sale and is move in ready.
-
2005-03-18soldstatus $60,000
ⓘ Source: listings_history table (triggers on properties + properties_extension) + one-shot
backfill from property_details.listing_events for pre-trigger history.
Tax reassessment forecast TN · Resets to sale price
- Current annual tax
- $863 · $72/mo
- Projected year-2 tax
- $1,129 · $94/mo
- Expected delta
- +$266/yr (+$22/mo · 30.8%)
ⓘ Screening estimate from a state-policy table — verify with the county assessor before closing.
Climate risk First Street
- Flood 1/10 Low FEMA zone X (unshaded) · 0% chance over 30 yrs
- Wildfire 3/10 Moderate
- Heat 6/10 Major 7 d/yr ≥110°F today · 20 d/yr by 30 yrs out
- Wind 4/10 Moderate 17% chance of damaging wind over 30 yrs
- Air quality 1/10 Low 0 unhealthy d/yr today · 0 by 30 yrs out
Nearby sold comps map
Loading sold comps map…
Walkable amenities ~0.75 mi
Loading nearby amenities…
Taxation est. · year 1
- Rental income
- $14,987
- − Mortgage interest
- −$8,906
- − Property taxes
- −$863
- − Insurance
- −$795
- − Repairs & maintenance
- −$1,199
- − Management
- −$1,199
- − Depreciation
- −$4,625
- Taxable loss
- −$2,601
- Est. tax savings @ 24.0%
- +$624
- After-tax cash flow
- $800/yr
For passive investors: Depreciation is non-cash, so a rental often shows a tax loss while cash-flowing — sheltering income. Rental losses are passive: they offset passive income freely, and up to $25,000/yr can offset ordinary (W-2) income if you actively participate and your MAGI is under $100k (phasing out to $0 by $150k); unused losses carry forward. On sale, claimed depreciation is recaptured at up to 25%, and gains may owe capital-gains tax (a 1031 exchange can defer both). Figures are a year-1 estimate at your 24.0% rate — not tax advice; consult a CPA.
Schools (NCES district)
- District
- Chester County
- NCES district ID
- 4700600
- Math proficiency
- 42% ▼ -4.00%
- Reading proficiency
- 37% ▼ -4.00%
- Median HH income
- $41,740
- Composite
- 33.32/100
- National rank
- #5502
- State rank
- #15 of 139 in TN
Livability — Henderson
- Score
- 65/100
- State rank
- #150
- US rank
- #13353
Category grades
Schools grade is shown separately in the Schools card above.
Census & demographics
- Census place
- Henderson, TN
- Population (ZIP)
- 12,274
Population outlook (Chester County) Hauer SSP2
- Today (2025)
- 17,948 people
- By 2030
- 18,156 · +1.2%
- By 2040
- 18,392 · +2.5%
- By 2050
- 18,411 · +2.6%
- By 2075
- 18,385 · +2.4%
- By 2100
- 18,211 · +1.5%
Race, ethnicity, and origin ACS 2023
- Neighborhood character
- Predominantly White (78%)
- Race & ethnicity
- White 78% Black 14% Two or more races 4% Hispanic / Latino 4%
- Common ancestry
- Italian 6% Slovak 4% Lithuanian 2%
- Foreign-born
- 2% · Canada
- Languages at home
- 96% English-only · Spanish 3%
Political lean MEDSL · Chester
- 2024 margin
- Solid R (+64.9) · D 17.0% · R 81.9% · Other 1.1%
- 2008→2024 swing
- -21.7pp toward R · 2008: -43.2pp · 2024: -64.9pp
- All cycles
- 2024: R+64.9 2020: R+59.9 2016: R+60.3 2012: R+47.7 2008: R+43.2
Not yet ingested
- Civics
- —
Market trends
- HPI YoY
- ▼ -56.29%
- Current HPI
- 237.7662
- Rent YoY
- —
- Metro
- —
- State GDP YoY
- ▲ 2.78%
- F500 in state
- 22
Industry mix (Fortune 500 HQ in TN)
| Industry | F500 HQs | Revenue |
|---|---|---|
| Healthcare | 3 | $91B |
|
||
| Retail | 3 | $72B |
|
||
| Transportation / Logistics | 1 | $88B |
|
||
| Paper / Packaging | 1 | $19B |
|
||
| Insurance | 1 | $13B |
|
||
| Energy | 1 | $12B |
|
||
Price history
+165.0% since first listed6 events — show timeline
- 2025-12-08 Listed $159,000 REALTRACS as Distributed by MLS Grid
- 2025-12-05 Coming Soon $159,000 REALTRACS as Distributed by MLS Grid
- 2018-11-07 Sold (Public Records) $68,500 Public Records
- 2018-11-05 Sold (MLS) $68,000 CWTAR
- 2018-08-16 Listed $72,000 CWTAR
- 2005-03-18 Sold (Public Records) $60,000 Public Records
Property tax history
+4.6%/yrLatest (2025): $863 · +6.0% YoY. Source: county tax records.
Cash-flow waterfall
monthlySold comps — $/sqft
last 12 mo · ≤1 miLoading sold comps…