1523 Cox's Chapel Rd · Independence, VA
Flood risk 1/10 · Minimal
- FEMA flood zone
- X (unshaded)
- Chance of flooding over 30 yrs
- 0.0%
- Est. flood insurance / yr
- $507 – $1,088
Fire risk 6/10 · Moderate
- Est. fire insurance / yr
- $666 – $1,236
Heat risk 2/10 · Minimal
- Hot days now (above 91°F)
- 7 days/yr
- Hot days in 30 yrs
- 19 days/yr
Wind risk 2/10 · Minimal
- Chance of severe wind over 30 yrs
- —
Air-quality risk 1/10 · Minimal
- Unhealthy air days now
- 0 days/yr
- Unhealthy air days in 30 yrs
- 0 days/yr
Risk factors via First Street. Map © Google.
Why this score? — see what drove the F grade
The composite is a weighted blend of 9 inputs, each scored 0–100. Each bar is that input's sub-score; the figure is the points it added to the 100-point composite (weight × sub-score).
- ARV discount +7.5/15.0
- Schools +5.9/10.0
- Appreciation +5.5/10.0
- Cash flow +5.0/30.0
- Livability +3.3/5.0
- Rent growth +2.5/5.0
- Condition / age +2.5/5.0
- 1% rule +0.7/10.0
- DSCR +0.0/10.0
$134,900
🖨 Deal sheet 📄 Offer letter ✓ Due diligence
Listing remarks
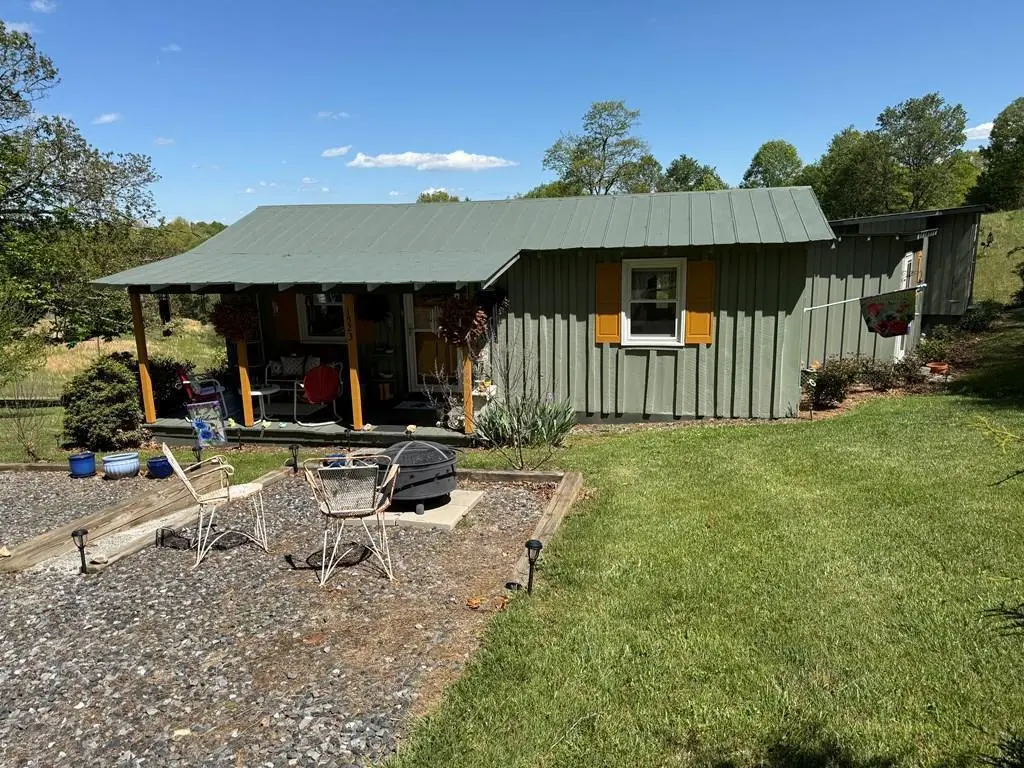
This home located just minutes from the historic New River in the much sought after Cox's Chapel community of Grayson County, VA and near the NC county line. It is perfect for a starter home, 2nd home or investment for Airbnb or rental property. With one bedroom and one bath, nice partially remodeled kitchen, family room, laundry room and a screened in back porch perfect for watching the stars, taking in the breathtaking views or enjoying the abundant wildlife. There is a 1 year old whole house generator just in case the power is out, you are covered. Plenty of storage in the exterior walk in basement whether its extra clothes, belongings, lawn furniture or you would like to use this space
Key facts
- New doors
- New ceiling fans
- Newer appliances
Tags
Property features AI
Exterior
- Utilities: Private well water; Septic tank
- Home design: Single family residence; One story
- Construction: Wood siding; Metal roof
- Exterior features: Cleared lot
Interior
- Kitchen: Microwave; Refrigerator
- Flooring: Vinyl
- Bathrooms: 1 full bathroom
- Heating & cooling: Oil heating; Propane heating; Has cooling
- Interior features: Ceiling fan(s); Wall/window cooling units
- Laundry & utility: Washer; Dryer
Neighborhood map
What this means for you Summary
Snapshot
- This is a 1-bed/1.0-bath single-family listed at $135k.
Deal economics
- At list price, monthly cash flow is $-320 ($-4k/yr) — negative.
- To cash-flow at today's rent, offer at most $89k (34.3% below list).
- To meet the 1% rule (rent ≥ 1% of price), the offer needs to be $78k (42.5% below list).
- Recommended offer: $78k (42.5% below list) — sets the bar for 1% rule.
- Cap rate 3.4% vs local median 1.8% in Independence — top-decile yield for the area; either an underpriced asset or a hidden risk that comps aren't pricing in. Stress-test before assuming the spread holds.
Location & tenants
- Location reads 66/100 on livability (#320 in VA) — a middle-class / working-renter tenant base. Strengths: cost of living A+, housing A+, crime B; Watch: health & safety C-, amenities F, commute F.
- Grayson County Public School District (rural): math 68% / reading 76% proficiency, ranked #27 of 131 in VA (top 21%) — strong family-tenant draw, lease renewals of 3-5y typical.
- Zoned schools: Independence Elementary (math 62% / reading 77%, grade A-, #313 of 1,108 statewide, top 32%, 277 students, 89% FRL); Independence Middle (math 60% / reading 73%, grade A-, #107 of 342 statewide, top 33%, 262 students, 88% FRL); Grayson County High (math 82% / reading 82%, grade A, #40 of 319 statewide, top 15%, 465 students, 87% FRL) — zoned schools average 88% FRL vs 53% district-wide (35 pts higher); higher-poverty schools than district average — tighter screening recommended.
- Market conditions: 18 active listings in the ZIP; 38 units permitted in Grayson County in 2024 (0 in 5+ unit buildings).
Forward outlook
- In year one you build about $2k of equity ($933 loan paydown + $1k appreciation (0.9% local appreciation)).
- Grayson County population projected at -24% by 2050 — secular population decline; favor cash flow + early exit over multi-decade hold.
Negotiation context
- It's been on market 48 days — a 3% lower offer ($131k) is reasonable based on typical stale-listing flexibility.
- Current owner paid $75k; list at $135k implies a 80% gain — meaningful room to come down on a strong offer.
Risks & watch-outs
- Climate carrying-cost: major wildfire risk — expect insurance premiums to compound above CPI over the hold.
Questions for the listing agent
- What do current leases actually rent for vs. the listed asking? Can we see a recent rent roll and the last 12 months of T-12 income?
- It's been on market 48 days. Have you received any prior offers? Is the seller open to a 43% concession, seller financing, or rate buy-down credit?
- Is there a deadline driving the sale (1031 exchange, divorce, estate, relocation)? That informs how much negotiation room exists.
- Schools are A-rated — typically a magnet for longer-tenancy family renters. What's the average tenant stay here, and is there a school-zone premium baked into asking?
- The area grade is low — what's the realistic commute time and amenity access for the typical tenant pool here? Any planned neighborhood developments (good or bad) we should know about?
- What's the average days-on-market for RENTAL listings here right now (not sales)? A rising rental-DOM trend means longer vacancies and softer asking-rent achievability than the comps imply.
- What's the recent tenant-quality profile in this submarket — average credit score on applications, eviction rate, late-payment / NSF rate, and stable-employment percentage? A property-management company in the area should have these aggregated.
- How much new for-sale + rental construction is in the pipeline within 1–3 miles? Heavy new supply typically softens prices + rents 12–24 months out; constrained supply supports both.
Investment metrics
- 1% rule
- 0.57% ✗
- Cap rate
- 3.45%
- Cash-on-cash
- -10.16%
- DSCR
- 0.55
- GRM
- 14.5
CMA / ARV
- ARV (median comp)
- $286,603
- List price
- $134,900
- Delta
- -52.93%
- Verdict
- UNDERPRICED
- Comps
- 2 within 2.0 mi
Projected returns pro-forma
0.95% appreciation · 3.0% rent growth · sell at horizon
- IRR
- -9.6%
- Equity multiple
- 0.52×
- Total profit
- $-18,196
- Equity at exit
- $45,677
- IRR
- -3.7%
- Equity multiple
- 0.55×
- Total profit
- $-17,137
- Equity at exit
- $60,411
Cash invested: $37,772 (down + closing). Projections, not guarantees.
Landlord ↔ Tenant lean methodology
- Overall (STATE)
- 55 Moderately Landlord-Leaning
- State Virginia
- 55 Moderately Landlord-Leaning · D+2
- County
- — inherits STATE
- City
- — inherits STATE
ZIP-level market 24363
- Home prices YoY
- 0.5%
- Active inventory
- 18
- Price-to-rent
- 14.5×
Monthly cashflow live
- Estimated rent
- $775 medium interval (Pro) →
- Mortgage (P&I)
- −$707
- Tax est. 1.5%
- −$169 /mo · $2,024/yr
- Insurance
- −$56
- HOA
- −$0
- Vacancy / Maint / Mgmt
- −$163
- Net cashflow
- $-320
Break-even live
UW: 25.0% down · 7.5% · 30yr · 1.5% tax · 5.0% vac · 8.0% maint · 8.0% mgmt
Financing live
Cash to close
- Down payment
- $33,725
- Closing costs
- $4,047
- Reserves months
- —
- Total cash needed
- —
Loan-product check · same deal, 3 products live
Conventional
25% down · 7.5% · 30yr
- Down + closing
- —
- Monthly P&I
- —
- Monthly cashflow
- —
- DSCR
- —
- Eligible?
- —
Personal DTI + credit; lowest rate.
DSCR
20% down · 8.5% · 30yr
- Down + closing
- —
- Monthly P&I
- —
- Monthly cashflow
- —
- DSCR
- —
- Eligible?
- —
No personal income docs; deal must DSCR.
Hard money
10% down · 12.0% · 12mo
- Down + closing
- —
- Monthly P&I
- —
- Monthly cashflow
- —
- DSCR
- —
- Eligible?
- —
Short-term bridge; refi at stabilization.
Listing history 18 events
-
2026-06-18days on market $134,900 Active 48 DOM
-
2026-06-17days on market $134,900 Active 47 DOM
-
2026-06-16days on market $134,900 Active 46 DOM
-
2026-06-15days on market $134,900 Active 45 DOM
-
2026-06-15days on market $134,900 Active 44 DOM
-
2026-06-13days on market $134,900 Active 43 DOM
-
2026-06-12days on market $134,900 Active 42 DOM
-
2026-06-09days on market $134,900 Active 39 DOM
-
2026-06-08days on market $134,900 Active 38 DOM
-
2026-06-08days on market $134,900 Active 37 DOM
-
2026-06-07days on market $134,900 Active 36 DOM
-
2026-06-03days on market $134,900 Active 33 DOM
-
2026-06-02days on market $134,900 Active 32 DOM
-
2026-06-01days on market $134,900 Active 31 DOM
-
2026-05-31days on market $134,900 Active 30 DOM
-
2026-05-01$134,900 Active 1259-char remark
-
2022-07-25soldstatus $75,000
-
2009-04-16soldstatus $24,000
ⓘ Source: listings_history table (triggers on properties + properties_extension) + one-shot
backfill from property_details.listing_events for pre-trigger history.
Climate risk First Street
- Flood 1/10 Low FEMA zone X (unshaded) · 0% chance over 30 yrs
- Wildfire 6/10 Major
- Heat 2/10 Low 7 d/yr ≥91°F today · 19 d/yr by 30 yrs out
- Wind 2/10 Low
- Air quality 1/10 Low 0 unhealthy d/yr today · 0 by 30 yrs out
Nearby sold comps map
Loading sold comps map…
Walkable amenities ~0.75 mi
Loading nearby amenities…
Taxation est. · year 1
- Rental income
- $9,301
- − Mortgage interest
- −$7,556
- − Property taxes
- −$2,024
- − Insurance
- −$674
- − Repairs & maintenance
- −$744
- − Management
- −$744
- − Depreciation
- −$3,924
- Taxable loss
- −$6,366
- Est. tax savings @ 24.0%
- +$1,528
- After-tax cash flow
- $-2,311/yr
For passive investors: Depreciation is non-cash, so a rental often shows a tax loss while cash-flowing — sheltering income. Rental losses are passive: they offset passive income freely, and up to $25,000/yr can offset ordinary (W-2) income if you actively participate and your MAGI is under $100k (phasing out to $0 by $150k); unused losses carry forward. On sale, claimed depreciation is recaptured at up to 25%, and gains may owe capital-gains tax (a 1031 exchange can defer both). Figures are a year-1 estimate at your 24.0% rate — not tax advice; consult a CPA.
Schools (NCES district)
- District
- Grayson County Public School District
- NCES district ID
- 5101690
- Math proficiency
- 68% ▼ -20.00%
- Reading proficiency
- 76% ▼ -7.00%
- Median HH income
- $31,429
- Composite
- 59.22/100
- National rank
- #942
- State rank
- #27 of 131 in VA
Livability — Independence
- Score
- 66/100
- State rank
- #320
- US rank
- #11693
Category grades
Schools grade is shown separately in the Schools card above.
Census & demographics
- Population (ZIP)
- 1,012
Population outlook (Grayson County) Hauer SSP2
- Today (2025)
- 14,252 people
- By 2030
- 13,634 · -4.3%
- By 2040
- 12,202 · -14.4%
- By 2050
- 10,811 · -24.1%
- By 2075
- 8,069 · -43.4%
- By 2100
- 5,647 · -60.4%
Race, ethnicity, and origin ACS 2023
- Neighborhood character
- Predominantly White (98%)
- Race & ethnicity
- White 98% Hispanic / Latino 1%
- Common ancestry
- Serbian 3% Romanian 1% Iranian 1%
- Foreign-born
- 1% · Canada
- Languages at home
- 98% English-only · Spanish 1%
Political lean MEDSL · Grayson
- 2024 margin
- Solid R (+62.2) · D 18.6% · R 80.8%
- 2008→2024 swing
- -33.7pp toward R · 2008: -28.5pp · 2024: -62.2pp
- All cycles
- 2024: R+62.2 2020: R+61.4 2016: R+57.7 2012: R+37.9 2008: R+28.5
Not yet ingested
- Civics
- —
Market trends
- HPI YoY
- ▲ 0.95%
- Current HPI
- 184.6298
- Rent YoY
- —
- Metro
- —
- State GDP YoY
- ▲ 2.40%
- F500 in state
- 50
Industry mix (Fortune 500 HQ in VA)
| Industry | F500 HQs | Revenue |
|---|---|---|
| Aerospace / Defense | 4 | $236B |
|
||
| Technology / Defense | 3 | $32B |
|
||
| Financial Services | 2 | $176B |
|
||
| Utilities | 2 | $27B |
|
||
| Insurance | 2 | $25B |
|
||
| Technology | 2 | $15B |
|
||
Price history
+462.1% since first listed3 events — show timeline
- 2026-05-01 Listed $134,900 SWVAR
- 2022-07-25 Sold (Public Records) $75,000 Public Records
- 2009-04-16 Sold (Public Records) $24,000 Public Records
Property tax history
-1.3%/yrLatest (2025): $120 · -25.9% YoY. Source: county tax records.
Cash-flow waterfall
monthlySold comps — $/sqft
last 12 mo · ≤1 miLoading sold comps…