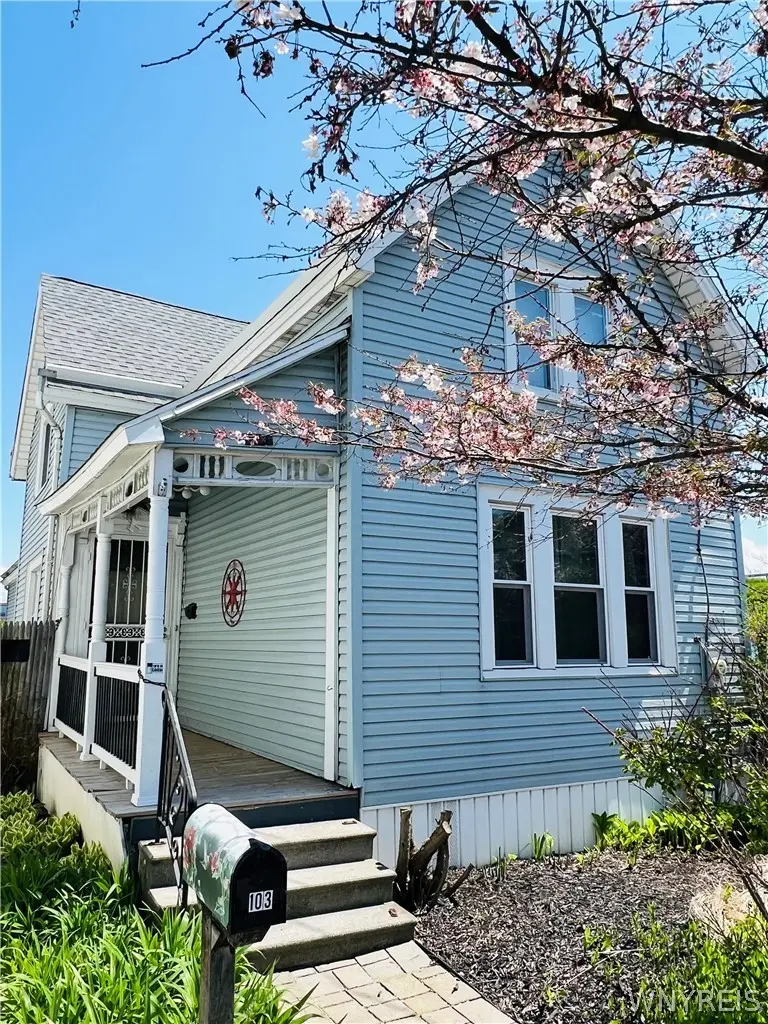
103 Peabody St · Buffalo, NY
Flood risk 7/10 · Major
- FEMA flood zone
- X (unshaded)
- Chance of flooding over 30 yrs
- 0.96%
- Est. flood insurance / yr
- $473 – $860
Fire risk 1/10 · Minimal
- Est. fire insurance / yr
- $691 – $1,283
Heat risk 3/10 · Minor
- Hot days now (above 92°F)
- 7 days/yr
- Hot days in 30 yrs
- 15 days/yr
Wind risk 1/10 · Minimal
- Chance of severe wind over 30 yrs
- —
Air-quality risk 3/10 · Minor
- Unhealthy air days now
- 2 days/yr
- Unhealthy air days in 30 yrs
- 3 days/yr
Risk factors via First Street. Map © Google.
Why this score? — see what drove the C+ grade
The composite is a weighted blend of 9 inputs, each scored 0–100. Each bar is that input's sub-score; the figure is the points it added to the 100-point composite (weight × sub-score).
- Cash flow +22.3/30.0
- Appreciation +10.0/10.0
- DSCR +7.2/10.0
- ARV discount +6.2/15.0
- Rent growth +5.0/5.0
- 1% rule +4.6/10.0
- Livability +3.9/5.0
- Schools +3.3/10.0
- Condition / age +2.5/5.0
$159,900
🖨 Deal sheet (PDF) 📄 Offer letter ✓ Due diligence
Listing remarks
Well-maintained home offering 1,463 square feet of living space! This property features plenty of off-street paved parking that has been regularly maintained and sealed every two years. The remodeled kitchen and bathroom were both updated within the last five years, giving the home a fresh and modern feel. The kitchen also includes an Insta-Hot system, perfect for convenient on-demand hot water. Major mechanics have been updated, providing peace of mind for the next owner. A great opportunity to own a move-in ready home with thoughtful updates throughout! Offers should be received by 10am on May 24th to be reviewed.
Key facts
- Remodeled bathroom
- Insta-hot system
- Remodeled kitchen
Tags
Property features AI
Finance
- Other: On-site generator
Exterior
- Parking: No garage
- Utilities: Public water connected; Sewer connected; Circuit breaker electric
- Home design: Single-story; Existing (year built not specified); Vinyl siding; Architectural shingle roof; Corner lot near public transit; rectangular (52 x 107)
- Construction: Vinyl siding construction; Pillar/post/pier foundation
- Exterior features: Blacktop driveway; Gravel driveway; Covered porch; Deck; Shed(s) / storage
Interior
- Kitchen: Gas oven; Gas range
- Bedrooms: 1 main-level bedroom
- Flooring: Carpet; Vinyl; Varies
- Bathrooms: 1 full bathroom (main level)
- Heating & cooling: Gas heating; Radiant heating
- Interior features: Separate/formal dining room; Eat-in kitchen; Walk-in pantry; Window treatments (drapes); Workshop; Has fireplace (1)
- Laundry & utility: Main-level laundry
Neighborhood map
What this means for you Summary
Snapshot
- This is a 3-bed/1.0-bath single-family listed at $160k.
Deal economics
- At list price, monthly cash flow is $209 ($3k/yr) — positive.
- The deal already cash-flows at list — no discount required.
- To meet the 1% rule (rent ≥ 1% of price), the offer needs to be $153k (4.1% below list).
- Recommended offer: $153k (4.1% below list) — sets the bar for 1% rule.
Location & tenants
- Location reads 77/100 on livability (#195 in NY, #3,011 nationally) — a middle-class / working-renter tenant base. Strengths: commute A+, housing A+, health & safety A+; Watch: crime F, employment D-.
- Buffalo City School District (urban): math 41% / reading 40% proficiency, ranked #535 of 590 in NY (top 91%) — families likely to look elsewhere, expect single-tenant / working-renter base with shorter leases; 75% free/reduced lunch — lower-income household profile, screen leases tightly.
- Zoned schools: International School (math 8% / reading 17%, grade F, #2,048 of 2,108 statewide, top 97%, 981 students, 92% FRL); Hutchinson Central Technical High School (math 96% / reading 32%, grade B-, #807 of 1,100 statewide, top 73%, 1,175 students, 78% FRL).
- Market conditions: Rents rising fast (+12.7%/yr); 94 active listings in the ZIP; 11 comparable units currently listed for rent nearby; rentals at typical pace (median 16d on market — plan ~3-4 weeks tenant-placement turnaround); 1,244 units permitted in Erie County in 2024 (563 in 5+ unit buildings).
- This rent runs 34% of the median local income ($54k/yr) — at the standard rent-burdened threshold; future hikes will face affordability resistance.
Forward outlook
- In year one you build about $17k of equity ($1k loan paydown + $16k appreciation (10.0% local appreciation)).
- At projected returns (10.0% appreciation + 8.0% rent growth), your $45k cash investment doubles in ~3 years — after that, you're playing with house money.
- By year 3, paydown + projected appreciation supports a ~$43k cash-out refi (75% LTV) — recoverable capital for the next deal without selling this one.
Negotiation context
- It's been on market 15 days — a 2% lower offer ($158k) is reasonable based on typical stale-listing flexibility.
- Current owner paid $25k; list at $160k implies a 540% gain — meaningful room to come down on a strong offer.
Risks & watch-outs
- Watch-outs: flood insurance adds $56/mo; built in 1880 — expect roof / HVAC / electrical / plumbing capex.
- Climate carrying-cost: major flood risk — expect insurance premiums to compound above CPI over the hold.
Questions for the listing agent
- Built in 1880 — when were the roof, HVAC, electrical panel, plumbing, and water heater last replaced?
- What's the actual annual flood-insurance premium (NFIP or private), and is the property in a SFHA with mandatory coverage?
- Is there a deadline driving the sale (1031 exchange, divorce, estate, relocation)? That informs how much negotiation room exists.
- Crime grade is F in this area — have there been break-ins, vandalism, or insurance claims at this property in the last 3 years? What carrier currently insures it and at what premium?
- What's the average days-on-market for RENTAL listings here right now (not sales)? A rising rental-DOM trend means longer vacancies and softer asking-rent achievability than the comps imply.
- What's the recent tenant-quality profile in this submarket — average credit score on applications, eviction rate, late-payment / NSF rate, and stable-employment percentage? A property-management company in the area should have these aggregated.
- How much new for-sale + rental construction is in the pipeline within 1–3 miles? Heavy new supply typically softens prices + rents 12–24 months out; constrained supply supports both.
Investment metrics
- 1% rule
- 0.96% ✗
- Cap rate
- 8.28%
- Cash-on-cash
- 7.08%
- DSCR
- 1.32
- GRM
- 8.7
CMA / ARV
- ARV (median comp)
- $155,557
- List price
- $159,900
- Delta
- 2.79%
- Verdict
- FAIR
- Comps
- 20 within 1.0 mi
Show comp detail 11 sales within ~0.75 mi
| Address | Dist | Beds/Ba | Sqft | Sold | Price | $/sf | Match |
|---|---|---|---|---|---|---|---|
| 35 Walter St | 0.13mi | 4/1.0 (+1) | 1,510 (+3%) | 3mo | $240,000 | $159 | 81 |
| 119 Peabody St | 0.03mi | 3/1.0 | 1,302 (-11%) | 10mo | $150,000 | $115 | 72 |
| 310 Smith St | 0.34mi | 4/1.0 (+1) | 1,441 (-2%) | 8mo | $70,000 | $49 | 70 |
| 118 Peabody St | 0.04mi | 3/1.0 | 1,362 (-7%) | 22mo | $130,000 | $95 | 69 |
| 823 Perry St | 0.42mi | 3/1.0 | 1,520 (+4%) | 9mo | $140,000 | $92 | 67 |
| 135 Bushnell St | 0.70mi | 3/1.0 | 1,530 (+5%) | 1mo | $121,200 | $79 | 59 |
| 165 Smith St | 0.47mi | 3/1.0 | 1,391 (-5%) | 13mo | $90,000 | $65 | 59 |
| 271 Babcock St | 0.30mi | 3/2.0 | 1,387 (-5%) | 18mo | $110,000 | $79 | 58 |
| 530 Fulton St | 0.64mi | 3/1.5 | 1,484 (+1%) | 18mo | $115,000 | $77 | 51 |
| 54 Clifford St | 0.22mi | 2/1.0 (-1) | 1,604 (+10%) | 22mo | $200,000 | $125 | 51 |
| 57 Jones St | 0.69mi | 4/1.0 (+1) | 1,497 (+2%) | 12mo | $72,000 | $48 | 49 |
Match score weights: distance 35% · size 25% · config 20% · recency 20%. Top-matched comps best support the ARV.
Projected returns pro-forma
10.0% appreciation · 8.0% rent growth · sell at horizon
- IRR
- 30.2%
- Equity multiple
- 3.42×
- Total profit
- $108,440
- Equity at exit
- $144,051
- IRR
- 27.6%
- Equity multiple
- 8.35×
- Total profit
- $328,879
- Equity at exit
- $310,651
Cash invested: $44,772 (down + closing). Projections, not guarantees.
Landlord ↔ Tenant lean methodology
- Overall (STATE)
- 15 Strongly Tenant-Friendly
- State New York
- 15 Strongly Tenant-Friendly · D+10
- County
- — inherits STATE
- City
- — inherits STATE
ZIP-level market 14210
- Home prices YoY
- 13.8%
- Rents YoY
- 12.7%
- Active inventory
- 94
- Price-to-rent
- 8.7×
Monthly cashflow live
- Estimated rent
- $1,533 high interval (Pro) →
- Mortgage (P&I)
- −$839
- Tax from tax record
- −$42 /mo · $502/yr
- Insurance
- −$67
- Flood insurance flood zone
- −$56 /mo · $666/yr
- HOA
- −$0
- Vacancy / Maint / Mgmt
- −$322
- Net cashflow
- $209
Break-even live
Sensitivity live
| Price | -10% $299 | -5% $254 | +0% $209 | +5% $163 | +10% $118 |
|---|---|---|---|---|---|
| Rent | -10% $88 | -5% $148 | +0% $209 | +5% $269 | +10% $330 |
| Rate | -1.0pp $289 | -0.5pp $249 | base $209 | +0.5pp $167 | +1.0pp $125 |
UW: 25.0% down · 7.5% · 30yr · 1.5% tax · 5.0% vac · 8.0% maint · 8.0% mgmt
Financing live
Cash to close
- Down payment
- $39,975
- Closing costs
- $4,797
- Reserves months
- —
- Total cash needed
- —
Loan-product check · same deal, 3 products live
Conventional
25% down · 7.5% · 30yr
- Down + closing
- —
- Monthly P&I
- —
- Monthly cashflow
- —
- DSCR
- —
- Eligible?
- —
Personal DTI + credit; lowest rate.
DSCR
20% down · 8.5% · 30yr
- Down + closing
- —
- Monthly P&I
- —
- Monthly cashflow
- —
- DSCR
- —
- Eligible?
- —
No personal income docs; deal must DSCR.
Hard money
10% down · 12.0% · 12mo
- Down + closing
- —
- Monthly P&I
- —
- Monthly cashflow
- —
- DSCR
- —
- Eligible?
- —
Short-term bridge; refi at stabilization.
Rent comps 11 comps
| Address | Beds | Baths | Sqft | Rent | $/sqft | DOM | Units | Dist |
|---|---|---|---|---|---|---|---|---|
| 901 S Park Ave Unit Lower Buffalo, NY | 4.0 | 1.0 | 1729 | $1,600 | $0.93 | 25d | 1 | 0.55mi |
| 47 Lester St Unit Main Floor Buffalo, NY | 3.0 | 1.0 | 900 | $1,000 | $1.11 | 45d | 1 | 0.55mi |
| 140 Seymour St Unit First Floor Buffalo, NY | 2.0 | 1.0 | 1300 | $1,800 | $1.38 | 5d | 1 | 0.62mi |
| 140 Seymour St Buffalo, NY | 2.0 | 1.0 | 1300 | $1,800 | $1.38 | 25d | 1 | 0.62mi |
| 700 Hopkins St Buffalo, NY | 3.0 | 1.0 | 1100 | $1,225 | $1.11 | 16d | 1 | 0.97mi |
| 89 Macamley St #2 Buffalo, NY | 3.0 | 1.0 | 1274 | $1,100 | $0.86 | 12d | 1 | 1.32mi |
| 214 Abbott Rd Unit 2 Buffalo, NY | 2.0 | 1.0 | 945 | $1,200 | $1.27 | 16d | 1 | 1.35mi |
| 225 Louisiana St Buffalo, NY | 1.0–3.0 | 1.0–2.0 | 1164 | $2,653 | $2.28 | 3d | 7 | 1.35mi |
| 76 Hammerschmidt Ave Buffalo, NY | 3.0 | 1.0 | 1200 | $1,275 | $1.06 | 3d | 1 | 1.36mi |
| 1899 Seneca St Buffalo, NY | 3.0 | 1.0 | 1134 | $1,075 | $0.95 | 16d | 1 | 1.46mi |
| 230 Scott St Buffalo, NY | 1.0–2.0 | 1.0–2.0 | 1285 | $2,325 | $1.81 | 3d | 4 | 1.50mi |
Listing history 2 events
-
2026-05-11$159,900 Active 623-char remark
-
1995-04-28soldstatus $25,000
ⓘ Source: listings_history table (triggers on properties + properties_extension) + one-shot
backfill from property_details.listing_events for pre-trigger history.
Tax reassessment forecast NY · Partial reset (capped growth)
- Current annual tax
- $502 · $42/mo
- Projected year-2 tax
- $1,602 · $134/mo
- Expected delta
- +$1,100/yr (+$92/mo · 219.2%)
ⓘ Screening estimate from a state-policy table — verify with the county assessor before closing.
Climate risk First Street
- Flood 7/10 Severe FEMA zone X (unshaded) · 96% chance over 30 yrs
- Wildfire 1/10 Low
- Heat 3/10 Moderate 7 d/yr ≥92°F today · 15 d/yr by 30 yrs out
- Wind 1/10 Low
- Air quality 3/10 Moderate 2 unhealthy d/yr today · 3 by 30 yrs out
Nearby sold comps map
Loading sold comps map…
Walkable amenities ~0.75 mi
Loading nearby amenities…
Taxation est. · year 1
- Rental income
- $18,398
- − Mortgage interest
- −$8,957
- − Property taxes
- −$502
- − Insurance
- −$1,466
- − Repairs & maintenance
- −$1,472
- − Management
- −$1,472
- − Depreciation
- −$4,652
- Taxable loss
- −$122
- Est. tax savings @ 24.0%
- +$29
- After-tax cash flow
- $2,534/yr
For passive investors: Depreciation is non-cash, so a rental often shows a tax loss while cash-flowing — sheltering income. Rental losses are passive: they offset passive income freely, and up to $25,000/yr can offset ordinary (W-2) income if you actively participate and your MAGI is under $100k (phasing out to $0 by $150k); unused losses carry forward. On sale, claimed depreciation is recaptured at up to 25%, and gains may owe capital-gains tax (a 1031 exchange can defer both). Figures are a year-1 estimate at your 24.0% rate — not tax advice; consult a CPA.
Schools (NCES district)
- District
- Buffalo City School District
- NCES district ID
- 3605850
- Math proficiency
- 41% ▲ 11.00%
- Reading proficiency
- 40% ▲ 7.00%
- Median HH income
- $31,665
- Composite
- 33.17/100
- National rank
- #5544
- State rank
- #535 of 590 in NY
Livability — Buffalo
- Score
- 77/100
- State rank
- #195
- US rank
- #3011
Category grades
Schools grade is shown separately in the Schools card above.
Census & demographics
- Census place
- Buffalo, NY
- County
- Erie County · 714,559 people
- City population
- 440,021
- Metro
- Buffalo-Cheektowaga, NY
- Population (ZIP)
- 15,563
- Household income
- $54,197
- Rent vs Own
- Severe rent burden
- 959.0
Population outlook (Erie County) Hauer SSP2
- Today (2025)
- 933,037 people
- By 2030
- 935,181 · +0.2%
- By 2040
- 928,531 · -0.5%
- By 2050
- 905,725 · -2.9%
- By 2075
- 834,037 · -10.6%
- By 2100
- 708,033 · -24.1%
Race, ethnicity, and origin ACS 2023
- Neighborhood character
- Predominantly White (79%)
- Race & ethnicity
- White 79% Two or more races 8% Black 8% Hispanic / Latino 7% Asian 1%
- Hispanic origin (detail)
- Puerto Rican 6%
- Common ancestry
- Romanian 21% Lithuanian 2% Serbian 1%
- Foreign-born
- 2% · Canada, China
- Languages at home
- 95% English-only · Spanish 2% Arabic 1% Other Indo-European 1%
Political lean MEDSL · Erie
- 2024 margin
- Lean D (+9.7) · D 54.8% · R 45.2%
- 2008→2024 swing
- -7.9pp toward R · 2008: 17.5pp · 2024: 9.7pp
- All cycles
- 2024: D+9.7 2020: D+14.7 2016: D+4.8 2012: D+15.6 2008: D+17.5
Not yet ingested
- Civics
- —
Market trends
- HPI YoY
- ▲ 52.34%
- Current HPI
- 431.7951
- Rent YoY
- ▲ 12.67%
- Metro
- Buffalo-Cheektowaga, NY
- State GDP YoY
- ▲ 2.60%
- F500 in state
- 92
Industry mix (Fortune 500 HQ in NY)
| Industry | F500 HQs | Revenue |
|---|---|---|
| Financial Services | 10 | $950B |
|
||
| Consumer Goods | 9 | $162B |
|
||
| Insurance | 4 | $225B |
|
||
| Telecommunications | 2 | $144B |
|
||
| Pharmaceuticals | 2 | $112B |
|
||
| Media / Entertainment | 2 | $69B |
|
||
Price history
+539.6% since first listed3 events — show timeline
- 2026-05-26 Pending — WNYREIS
- 2026-05-11 Listed $159,900 WNYREIS
- 1995-04-28 Sold (Public Records) $25,000 Public Records
Property tax history
+12.2%/yrLatest (2025): $502 · +142.1% YoY. Source: county tax records.
Cash-flow waterfall
monthlySold comps — $/sqft
last 12 mo · ≤1 miLoading sold comps…