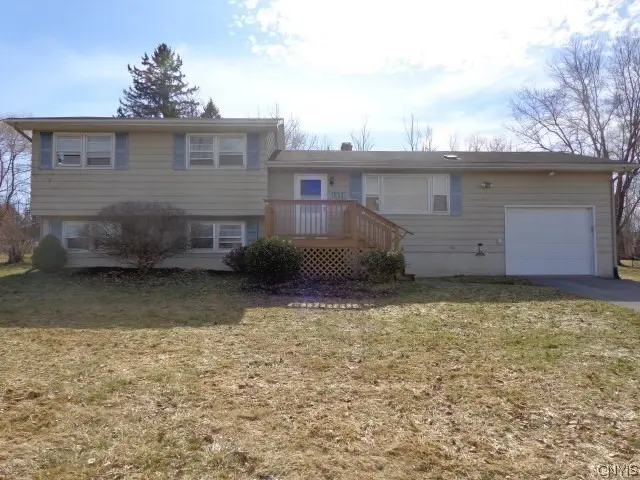
1372 (1370) Kinderhook Rd · Chittenango, NY
Flood risk 1/10 · Minimal
- FEMA flood zone
- X
- Chance of flooding over 30 yrs
- 0.0%
- Est. flood insurance / yr
- $473 – $860
Fire risk 3/10 · Minor
- Est. fire insurance / yr
- $691 – $1,283
Heat risk 3/10 · Minor
- Hot days now (above 95°F)
- 7 days/yr
- Hot days in 30 yrs
- 16 days/yr
Wind risk 1/10 · Minimal
- Chance of severe wind over 30 yrs
- —
Air-quality risk 2/10 · Minimal
- Unhealthy air days now
- 1 days/yr
- Unhealthy air days in 30 yrs
- 1 days/yr
Risk factors via First Street. Map © Google.
Why this score? — see what drove the B grade
The composite is a weighted blend of 9 inputs, each scored 0–100. Each bar is that input's sub-score; the figure is the points it added to the 100-point composite (weight × sub-score).
- Cash flow +25.6/30.0
- ARV discount +15.0/15.0
- DSCR +8.5/10.0
- 1% rule +7.3/10.0
- Schools +5.4/10.0
- Livability +3.7/5.0
- Rent growth +2.5/5.0
- Condition / age +2.5/5.0
- Appreciation +0.0/10.0
$199,900
🖨 Deal sheet 📄 Offer letter ✓ Due diligence
Listing remarks MLS
Good-sized split-level home featuring 3 main bedrooms and 1.5 bathrooms. The lower level offers a spacious family room with a wood stove, an additional bedroom, and flexible office space—ideal for working from home. The dining area includes sliding glass doors that lead to a deck overlooking the backyard, providing a great space for relaxing or entertaining. With a little TLC and some sweat equity, this home has the potential to become everything you’ve been looking for. Conveniently located in a residential setting within approximately 30 minutes of Syracuse Airport. Being sold as-is.
Key facts
- Wood stove
- Sliding glass doors
- Split-level home
Tags
Neighborhood map
What this means for you Summary
Snapshot
- This is a 3-bed/1.5-bath single-family listed at $200k.
Deal economics
- At list price, monthly cash flow is $472 ($6k/yr) — positive.
- The deal already cash-flows at list — no discount required.
- Meets the 1% rule at list price ($2k rent vs $200k).
- Recommended offer: $182k (9.0% below list) — sets the bar for market timing.
- Cap rate 9.1% vs local median 4.2% in Chittenango — top-decile yield for the area; either an underpriced asset or a hidden risk that comps aren't pricing in. Stress-test before assuming the spread holds.
Location & tenants
- Location reads 74/100 on livability (#296 in NY, #4,790 nationally) — a middle-class / working-renter tenant base. Strengths: housing A+, employment A, cost of living A; Watch: amenities F, commute F.
- Chittenango Central School District (rural): math 61% / reading 64% proficiency, ranked #192 of 590 in NY (top 32%) — acceptable for families but not a draw, mixed tenant base, ~2y average lease.
- Market conditions: 73 active listings in the ZIP; 137 units permitted in Madison County in 2024 (46 in 5+ unit buildings).
Forward outlook
- Local home prices are declining (-3.0%/yr); year-one equity from $1k of loan paydown is wiped out by about $6k of value loss. Plan a longer hold.
- Madison County population projected at -24% by 2050 — secular population decline; favor cash flow + early exit over multi-decade hold.
Negotiation context
- It's been on market 98 days — a 9% lower offer ($182k) is reasonable based on typical stale-listing flexibility.
Questions for the listing agent
- It's been on market 98 days. Have you received any prior offers? Is the seller open to a 9% concession, seller financing, or rate buy-down credit?
- Built in 1970 — when were the roof, HVAC, electrical panel, plumbing, and water heater last replaced?
- Why hasn't it sold? Are there any deal-killer items the seller is aware of (foundation, flood, title, zoning, code violations)?
- Is there a deadline driving the sale (1031 exchange, divorce, estate, relocation)? That informs how much negotiation room exists.
- Schools are A-rated — typically a magnet for longer-tenancy family renters. What's the average tenant stay here, and is there a school-zone premium baked into asking?
- What's the average days-on-market for RENTAL listings here right now (not sales)? A rising rental-DOM trend means longer vacancies and softer asking-rent achievability than the comps imply.
- What's the recent tenant-quality profile in this submarket — average credit score on applications, eviction rate, late-payment / NSF rate, and stable-employment percentage? A property-management company in the area should have these aggregated.
- How much new for-sale + rental construction is in the pipeline within 1–3 miles? Heavy new supply typically softens prices + rents 12–24 months out; constrained supply supports both.
Investment metrics
- 1% rule
- 1.23% ✓
- Cap rate
- 9.13%
- Cash-on-cash
- 10.13%
- DSCR
- 1.45
- GRM
- 6.8
CMA / ARV
- ARV (median comp)
- $394,883
- List price
- $199,900
- Delta
- -49.38%
- Verdict
- UNDERPRICED
- Comps
- 17 within 1.0 mi
Show comp detail 1 sale within ~0.75 mi
| Address | Dist | Beds/Ba | Sqft | Sold | Price | $/sf | Match |
|---|---|---|---|---|---|---|---|
| 1473 Kinderhook Rd | 0.29mi | 3/2.0 | 1,486 (-1%) | 9mo | $370,000 | $249 | 76 |
Match score weights: distance 35% · size 25% · config 20% · recency 20%. Top-matched comps best support the ARV.
Projected returns pro-forma
-3.0% appreciation · 3.0% rent growth · sell at horizon
- IRR
- -1.0%
- Equity multiple
- 0.96×
- Total profit
- $-2,208
- Equity at exit
- $29,806
- IRR
- 8.7%
- Equity multiple
- 1.66×
- Total profit
- $37,211
- Equity at exit
- $17,284
Cash invested: $55,972 (down + closing). Projections, not guarantees.
Landlord ↔ Tenant lean methodology
- Overall (STATE)
- 15 Strongly Tenant-Friendly
- State New York
- 15 Strongly Tenant-Friendly · D+10
- County
- — inherits STATE
- City
- — inherits STATE
ZIP-level market 13037
- Home prices YoY
- -17.1%
- Active inventory
- 73
- Price-to-rent
- 6.8×
Monthly cashflow live
- Estimated rent
- $2,468 medium interval (Pro) →
- Mortgage (P&I)
- −$1,048
- Tax from tax record
- −$346 /mo · $4,147/yr
- Insurance
- −$83
- HOA
- −$0
- Vacancy / Maint / Mgmt
- −$518
- Net cashflow
- $472
Break-even live
UW: 25.0% down · 7.5% · 30yr · 1.5% tax · 5.0% vac · 8.0% maint · 8.0% mgmt
Financing live
Cash to close
- Down payment
- $49,975
- Closing costs
- $5,997
- Reserves months
- —
- Total cash needed
- —
Loan-product check · same deal, 3 products live
Conventional
25% down · 7.5% · 30yr
- Down + closing
- —
- Monthly P&I
- —
- Monthly cashflow
- —
- DSCR
- —
- Eligible?
- —
Personal DTI + credit; lowest rate.
DSCR
20% down · 8.5% · 30yr
- Down + closing
- —
- Monthly P&I
- —
- Monthly cashflow
- —
- DSCR
- —
- Eligible?
- —
No personal income docs; deal must DSCR.
Hard money
10% down · 12.0% · 12mo
- Down + closing
- —
- Monthly P&I
- —
- Monthly cashflow
- —
- DSCR
- —
- Eligible?
- —
Short-term bridge; refi at stabilization.
Listing history 14 events
-
2026-06-16days on market $199,900 Active 98 DOM
-
2026-06-15days on market $199,900 Active 97 DOM
-
2026-06-14days on market $199,900 Active 95 DOM
-
2026-06-13days on market $199,900 Active 94 DOM
-
2026-06-10days on market $199,900 Active 92 DOM
-
2026-06-09days on market $199,900 Active 91 DOM
-
2026-06-08days on market $199,900 Active 90 DOM
-
2026-06-07days on market $199,900 Active 89 DOM
-
2026-06-02days on market $199,900 Active 84 DOM
-
2026-06-01days on market $199,900 Active 83 DOM
-
2026-05-31days on market $199,900 Active 82 DOM
-
2026-05-30days on market $199,900 Active 81 DOM
-
2026-04-21price $199,900 604-char remark
Show marketing remark (604 chars)
Good-sized split-level home featuring 3 main bedrooms and 1.5 bathrooms. The lower level offers a spacious family room with a wood stove, an additional bedroom, and flexible office space—ideal for working from home. The dining area includes sliding glass doors that lead to a deck overlooking the backyard, providing a great space for relaxing or entertaining. With a little TLC and some sweat equity, this home has the potential to become everything you’ve been looking for. Conveniently located in a residential setting within approximately 30 minutes of Syracuse Airport. Being sold as-is.
-
2026-03-10$209,900 Active 604-char remark
Show marketing remark (604 chars)
Good-sized split-level home featuring 3 main bedrooms and 1.5 bathrooms. The lower level offers a spacious family room with a wood stove, an additional bedroom, and flexible office space—ideal for working from home. The dining area includes sliding glass doors that lead to a deck overlooking the backyard, providing a great space for relaxing or entertaining. With a little TLC and some sweat equity, this home has the potential to become everything you’ve been looking for. Conveniently located in a residential setting within approximately 30 minutes of Syracuse Airport. Being sold as-is.
ⓘ Source: listings_history table (triggers on properties + properties_extension) + one-shot
backfill from property_details.listing_events for pre-trigger history.
Tax reassessment forecast NY · Partial reset (capped growth)
- Current annual tax
- $4,147 · $346/mo
- Projected year-2 tax
- $4,147 · $346/mo
- Expected delta
- $0/yr ($0/mo · 0.0%)
ⓘ Screening estimate from a state-policy table — verify with the county assessor before closing.
Climate risk First Street
- Flood 1/10 Low FEMA zone X · 0% chance over 30 yrs
- Wildfire 3/10 Moderate
- Heat 3/10 Moderate 7 d/yr ≥95°F today · 16 d/yr by 30 yrs out
- Wind 1/10 Low
- Air quality 2/10 Low 1 unhealthy d/yr today · 1 by 30 yrs out
Nearby sold comps map
Loading sold comps map…
Walkable amenities ~0.75 mi
Loading nearby amenities…
Taxation est. · year 1
- Rental income
- $29,614
- − Mortgage interest
- −$11,198
- − Property taxes
- −$4,147
- − Insurance
- −$1,000
- − Repairs & maintenance
- −$2,369
- − Management
- −$2,369
- − Depreciation
- −$5,815
- Taxable income
- $2,716
- Est. tax owed @ 24.0%
- −$652
- After-tax cash flow
- $5,017/yr
For passive investors: Depreciation is non-cash, so a rental often shows a tax loss while cash-flowing — sheltering income. Rental losses are passive: they offset passive income freely, and up to $25,000/yr can offset ordinary (W-2) income if you actively participate and your MAGI is under $100k (phasing out to $0 by $150k); unused losses carry forward. On sale, claimed depreciation is recaptured at up to 25%, and gains may owe capital-gains tax (a 1031 exchange can defer both). Figures are a year-1 estimate at your 24.0% rate — not tax advice; consult a CPA.
Schools (NCES district)
- District
- Chittenango Central School District
- NCES district ID
- 3607470
- Math proficiency
- 61% ▼ -4.00%
- Reading proficiency
- 64% ▲ 9.00%
- Median HH income
- $62,521
- Composite
- 54.34/100
- National rank
- #1365
- State rank
- #192 of 590 in NY
Livability — Chittenango
- Score
- 74/100
- State rank
- #296
- US rank
- #4790
Category grades
Schools grade is shown separately in the Schools card above.
Census & demographics
- Population (ZIP)
- 9,519
Population outlook (Madison County) Hauer SSP2
- Today (2025)
- 69,528 people
- By 2030
- 66,599 · -4.2%
- By 2040
- 59,814 · -14.0%
- By 2050
- 52,842 · -24.0%
- By 2075
- 39,167 · -43.7%
- By 2100
- 28,442 · -59.1%
Race, ethnicity, and origin ACS 2023
- Neighborhood character
- Predominantly White (92%)
- Race & ethnicity
- White 92% Two or more races 5% Hispanic / Latino 4%
- Common ancestry
- Romanian 9% Iranian 3% Lithuanian 3%
- Foreign-born
- 3% · Canada, Jamaica
- Languages at home
- 96% English-only · Spanish 2% French/Haitian/Cajun 1%
Political lean MEDSL · Madison
- 2024 margin
- R (+13.1) · D 43.5% · R 56.5%
- 2008→2024 swing
- -13.9pp toward R · 2008: 0.9pp · 2024: -13.1pp
- All cycles
- 2024: R+13.1 2020: R+10.6 2016: R+15.9 2012: D+0.3 2008: D+0.9
Not yet ingested
- Civics
- —
Market trends
- HPI YoY
- ▼ -56.53%
- Current HPI
- 272.9953
- Rent YoY
- —
- Metro
- —
- State GDP YoY
- ▲ 2.60%
- F500 in state
- 92
Industry mix (Fortune 500 HQ in NY)
| Industry | F500 HQs | Revenue |
|---|---|---|
| Financial Services | 10 | $950B |
|
||
| Consumer Goods | 9 | $162B |
|
||
| Insurance | 4 | $225B |
|
||
| Telecommunications | 2 | $144B |
|
||
| Pharmaceuticals | 2 | $112B |
|
||
| Media / Entertainment | 2 | $69B |
|
||
Price history
-4.8% since first listed2 events — show timeline
- 2026-04-21 Price Changed $199,900 CNYIS
- 2026-03-10 Listed $209,900 CNYIS
Property tax history
+5.3%/yrLatest (2025): $4,147 · +2.2% YoY. Source: county tax records.
Cash-flow waterfall
monthlySold comps — $/sqft
last 12 mo · ≤1 miLoading sold comps…