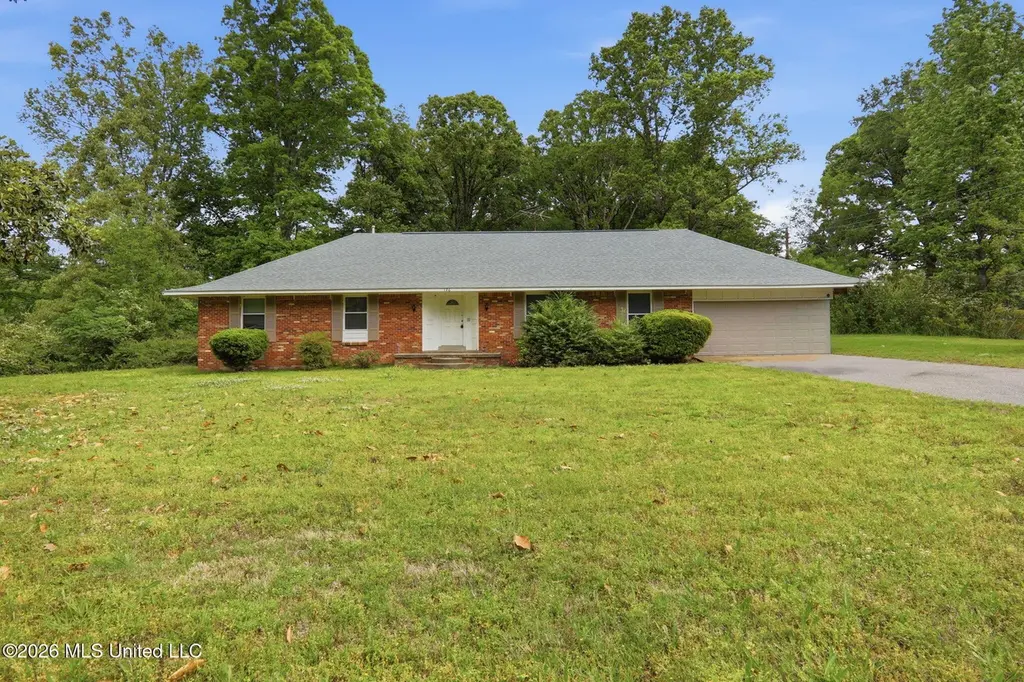
126 Colonial Dr · Hernando, MS
Flood risk 1/10 · Minimal
- FEMA flood zone
- X (unshaded)
- Chance of flooding over 30 yrs
- 0.0%
- Est. flood insurance / yr
- $507 – $1,088
Fire risk 4/10 · Minor
- Est. fire insurance / yr
- $1,241 – $2,305
Heat risk 6/10 · Moderate
- Hot days now (above 109°F)
- 7 days/yr
- Hot days in 30 yrs
- 21 days/yr
Wind risk 4/10 · Minor
- Chance of severe wind over 30 yrs
- 21.0%
Air-quality risk 2/10 · Minimal
- Unhealthy air days now
- 2 days/yr
- Unhealthy air days in 30 yrs
- 2 days/yr
Risk factors via First Street. Map © Google.
Why this score? — see what drove the B+ grade
The composite is a weighted blend of 9 inputs, each scored 0–100. Each bar is that input's sub-score; the figure is the points it added to the 100-point composite (weight × sub-score).
- Cash flow +30.0/30.0
- ARV discount +15.0/15.0
- DSCR +10.0/10.0
- 1% rule +8.8/10.0
- Schools +4.0/10.0
- Livability +3.5/5.0
- Condition / age +2.5/5.0
- Rent growth +2.4/5.0
- Appreciation +0.0/10.0
$199,999
🖨 Deal sheet 📄 Offer letter ✓ Due diligence
Listing remarks
Spacious one-story home on 2.4 ACRES featuring 3 bedrooms, 2 bathrooms, and a 2-car garage with a functional and inviting layout. The living area offers plenty of natural light and flows into the kitchen with ample cabinet and counter space for everyday living. The primary suite provides a comfortable retreat, while additional bedrooms offer flexibility for guests, office space, or hobbies. Enjoy a large backyard with space for relaxing or entertaining, along with practical features throughout completing this home. One or more photo(s) was virtually staged.
Key facts
- Large backyard
- Ample cabinet space
- 2.4 acre lot
Tags
Property features AI
Finance
- Other: Lot size about 2.4 acres
- Financial info: No additional financial details provided
- HOA & community: No HOA or community details provided
Exterior
- Parking: Attached garage that faces the front; Two garage/parking spaces (attached)
- Security: No security details provided
- Utilities: Sewer: Other; Water: Other; Utilities: Other
- Home design: Single-family house; One story; Assessor-provided living area; Entry level: Main
- Construction: Brick construction; Composition roof; Slab foundation; Built date from assessor (year not specified)
- Exterior features: Patio/porch described as Other; Other exterior features
Interior
- Kitchen: Dishwasher; Refrigerator
- Bedrooms: Primary bedroom on main level (approx. 14 x 12); Second bedroom on main level (approx. 10 x 13); Third bedroom on main level (approx. 12 x 11); Fourth bedroom on main level (approx. 12 x 11)
- Flooring: No flooring details provided
- Bathrooms: Two full bathrooms
- Heating & cooling: Central heating; Central air conditioning
- Interior features: Seven total rooms; Living room; Dining room
- Laundry & utility: No laundry details provided
Neighborhood map
What this means for you Summary
Snapshot
- This is a 4-bed/2.0-bath single-family listed at $200k.
Deal economics
- At list price, monthly cash flow is $876 ($11k/yr) — positive.
- The deal already cash-flows at list — no discount required.
- Meets the 1% rule at list price ($3k rent vs $200k).
- Recommended offer: $194k (3.0% below list) — sets the bar for market timing.
- Cap rate 11.5% vs local median 4.2% in Hernando — top-decile yield for the area; either an underpriced asset or a hidden risk that comps aren't pricing in. Stress-test before assuming the spread holds.
Location & tenants
- Location reads 70/100 on livability (#44 in MS) — a middle-class / working-renter tenant base. Strengths: crime A+, cost of living A+, housing A+; Watch: amenities F, commute F, health & safety F.
- Desoto County School District (suburban): math 48% / reading 42% proficiency, ranked #20 of 130 in MS (top 15%) — families likely to look elsewhere, expect single-tenant / working-renter base with shorter leases.
- Zoned schools: Hernando Elem (779 students, 100% FRL); Hernando Middle School (math 75% / reading 57%, grade A-, #2 of 179 statewide, top 1%, 1,150 students, 100% FRL); Hernando High School (math 69% / reading 62%, grade B, #2 of 197 statewide, top 1%, 1,419 students, 100% FRL) — zoned schools average 100% FRL vs 43% district-wide (56 pts higher); higher-poverty schools than district average — tighter screening recommended.
- Zoned-school proficiency averages 66% at this address vs 45% district-wide (+21 pts) — the actual schools serving this property are materially stronger than the Desoto County School District average implies; a family-tenant draw the district grade alone would hide.
- Market conditions: Rents soft (-0.4%/yr); 403 active listings in the ZIP; 2 comparable units currently listed for rent nearby; solid renter incomes; 1,155 units permitted in DeSoto County in 2024 (0 in 5+ unit buildings).
- This rent runs 35% of the median local income ($94k/yr) — at the standard rent-burdened threshold; future hikes will face affordability resistance.
Forward outlook
- Local home prices are declining (-3.0%/yr); year-one equity from $1k of loan paydown is wiped out by about $6k of value loss. Plan a longer hold.
- DeSoto County population projected at +33% by 2050 — long-run rental-demand tailwind backs the buy-and-hold thesis.
- At projected returns (-3.0% appreciation + 0.0% rent growth), your $56k cash investment doubles in ~9 years — after that, you're playing with house money.
Negotiation context
- It's been on market 44 days — a 3% lower offer ($194k) is reasonable based on typical stale-listing flexibility.
- 3 sale attempts since 14y ago; this cycle's ask has dropped $93k (32%) from the opening price — seller is motivated, your offer sets the floor, not the list.
Risks & watch-outs
- Climate carrying-cost: extreme-heat days projected 7→21/yr by 2055 (HVAC capex compounding) — expect insurance premiums to compound above CPI over the hold.
Questions for the listing agent
- It's been on market 44 days. Have you received any prior offers? Is the seller open to a 3% concession, seller financing, or rate buy-down credit?
- Built in 1966 — when were the roof, HVAC, electrical panel, plumbing, and water heater last replaced?
- Is there a deadline driving the sale (1031 exchange, divorce, estate, relocation)? That informs how much negotiation room exists.
- Schools are B-rated — typically a magnet for longer-tenancy family renters. What's the average tenant stay here, and is there a school-zone premium baked into asking?
- What's the average days-on-market for RENTAL listings here right now (not sales)? A rising rental-DOM trend means longer vacancies and softer asking-rent achievability than the comps imply.
- What's the recent tenant-quality profile in this submarket — average credit score on applications, eviction rate, late-payment / NSF rate, and stable-employment percentage? A property-management company in the area should have these aggregated.
- How much new for-sale + rental construction is in the pipeline within 1–3 miles? Heavy new supply typically softens prices + rents 12–24 months out; constrained supply supports both.
Investment metrics
- 1% rule
- 1.38% ✓
- Cap rate
- 11.55%
- Cash-on-cash
- 18.76%
- DSCR
- 1.83
- GRM
- 6.0
CMA / ARV
- ARV (median comp)
- $369,110
- List price
- $199,999
- Delta
- -45.82%
- Verdict
- UNDERPRICED
- Comps
- 5 within 1.0 mi
Show comp detail 1 sale within ~0.75 mi
| Address | Dist | Beds/Ba | Sqft | Sold | Price | $/sf | Match |
|---|---|---|---|---|---|---|---|
| 4616 S Highway 51 | 0.30mi | 4/2.0 | 2,100 (+9%) | 14mo | $365,000 | $174 | 59 |
Match score weights: distance 35% · size 25% · config 20% · recency 20%. Top-matched comps best support the ARV.
Projected returns pro-forma
-3.0% appreciation · 0.0% rent growth · sell at horizon
- IRR
- 7.2%
- Equity multiple
- 1.27×
- Total profit
- $15,251
- Equity at exit
- $29,821
- IRR
- 13.8%
- Equity multiple
- 1.96×
- Total profit
- $53,762
- Equity at exit
- $17,292
Cash invested: $56,000 (down + closing). Projections, not guarantees.
Landlord ↔ Tenant lean methodology
- Overall (STATE)
- 90 Strongly Landlord-Friendly
- State Mississippi
- 90 Strongly Landlord-Friendly · R+11
- County
- — inherits STATE
- City
- — inherits STATE
ZIP-level market 38632
- Home prices YoY
- -31.8%
- Rents YoY
- -0.4%
- Active inventory
- 403
- Price-to-rent
- 6.0×
Monthly cashflow live
- Estimated rent
- $2,765 medium interval (Pro) →
- Mortgage (P&I)
- −$1,049
- Tax from tax record
- −$176 /mo · $2,116/yr
- Insurance
- −$83
- HOA
- −$0
- Vacancy / Maint / Mgmt
- −$581
- Net cashflow
- $876
Break-even live
UW: 25.0% down · 7.5% · 30yr · 1.5% tax · 5.0% vac · 8.0% maint · 8.0% mgmt
Financing live
Cash to close
- Down payment
- $50,000
- Closing costs
- $6,000
- Reserves months
- —
- Total cash needed
- —
Loan-product check · same deal, 3 products live
Conventional
25% down · 7.5% · 30yr
- Down + closing
- —
- Monthly P&I
- —
- Monthly cashflow
- —
- DSCR
- —
- Eligible?
- —
Personal DTI + credit; lowest rate.
DSCR
20% down · 8.5% · 30yr
- Down + closing
- —
- Monthly P&I
- —
- Monthly cashflow
- —
- DSCR
- —
- Eligible?
- —
No personal income docs; deal must DSCR.
Hard money
10% down · 12.0% · 12mo
- Down + closing
- —
- Monthly P&I
- —
- Monthly cashflow
- —
- DSCR
- —
- Eligible?
- —
Short-term bridge; refi at stabilization.
Rent comps 2 comps
| Address | Beds | Baths | Sqft | Rent | $/sqft | DOM | Units | Dist |
|---|---|---|---|---|---|---|---|---|
| 870 Green Acres Dr Hernando, MS | 3.0 | 2.0 | 1447 | $2,300 | $1.59 | 2d | 1 | 1.10mi |
| 2948 Mount Pleasant S Hernando, MS | 3.0 | 2.0 | 1557 | $2,090 | $1.34 | 17d | 1 | 1.50mi |
Listing history 16 events
-
2026-06-13status $199,999 Pending 44 DOM
-
2026-06-10days on market $199,999 Active 44 DOM
-
2026-06-09days on market $199,999 Active 43 DOM
-
2026-06-08days on market $199,999 Active 42 DOM
-
2026-06-07days on market $199,999 Active 41 DOM
-
2026-06-03days on market $199,999 Active 37 DOM
-
2026-06-02pricedays on market $199,999 Active 36 DOM
-
2026-06-01days on market $249,950 Active 35 DOM
-
2026-05-31days on market $249,950 Active 34 DOM
-
2026-05-18price $249,950 563-char remark
-
2026-04-27$292,500 Active 563-char remark
-
2022-01-11price $2,055
-
2020-06-22historical
-
2020-05-20$224,900
-
2013-11-04historical
-
2012-11-15$135,000
ⓘ Source: listings_history table (triggers on properties + properties_extension) + one-shot
backfill from property_details.listing_events for pre-trigger history.
Tax reassessment forecast MS · Resets to sale price
- Current annual tax
- $2,116 · $176/mo
- Projected year-2 tax
- $2,116 · $176/mo
- Expected delta
- $0/yr ($0/mo · 0.0%)
ⓘ Screening estimate from a state-policy table — verify with the county assessor before closing.
Climate risk First Street
- Flood 1/10 Low FEMA zone X (unshaded) · 0% chance over 30 yrs
- Wildfire 4/10 Moderate
- Heat 6/10 Major 7 d/yr ≥109°F today · 21 d/yr by 30 yrs out
- Wind 4/10 Moderate 21% chance of damaging wind over 30 yrs
- Air quality 2/10 Low 2 unhealthy d/yr today · 2 by 30 yrs out
Nearby sold comps map
Loading sold comps map…
Walkable amenities ~0.75 mi
Loading nearby amenities…
Taxation est. · year 1
- Rental income
- $33,176
- − Mortgage interest
- −$11,203
- − Property taxes
- −$2,116
- − Insurance
- −$1,000
- − Repairs & maintenance
- −$2,654
- − Management
- −$2,654
- − Depreciation
- −$5,818
- Taxable income
- $7,730
- Est. tax owed @ 24.0%
- −$1,855
- After-tax cash flow
- $8,652/yr
For passive investors: Depreciation is non-cash, so a rental often shows a tax loss while cash-flowing — sheltering income. Rental losses are passive: they offset passive income freely, and up to $25,000/yr can offset ordinary (W-2) income if you actively participate and your MAGI is under $100k (phasing out to $0 by $150k); unused losses carry forward. On sale, claimed depreciation is recaptured at up to 25%, and gains may owe capital-gains tax (a 1031 exchange can defer both). Figures are a year-1 estimate at your 24.0% rate — not tax advice; consult a CPA.
Schools (NCES district)
- District
- Desoto County School District
- NCES district ID
- 2801320
- Math proficiency
- 48% ▼ -13.00%
- Reading proficiency
- 42% ▼ -6.00%
- Median HH income
- $59,272
- Composite
- 39.56/100
- National rank
- #3933
- State rank
- #20 of 130 in MS
Livability — Hernando
- Score
- 70/100
- State rank
- #44
- US rank
- #8034
Category grades
Schools grade is shown separately in the Schools card above.
Census & demographics
- County
- DeSoto County · 176,513 people
- City population
- 31,374
- Metro
- Memphis, TN-MS-AR
- Population (ZIP)
- 31,374
- Household income
- $93,583
- Rent vs Own
- Severe rent burden
- 24.0
Population outlook (DeSoto County) Hauer SSP2
- Today (2025)
- 203,338 people
- By 2030
- 217,692 · +7.1%
- By 2040
- 245,320 · +20.6%
- By 2050
- 270,133 · +32.8%
- By 2075
- 323,341 · +59.0%
- By 2100
- 348,742 · +71.5%
Race, ethnicity, and origin ACS 2023
- Neighborhood character
- Predominantly White (81%)
- Race & ethnicity
- White 81% Black 13% Two or more races 4% Hispanic / Latino 2%
- Common ancestry
- Italian 2% Serbian 2% Slovak 1%
- Foreign-born
- 2% · Canada
- Languages at home
- 98% English-only · Spanish 1% Arabic 1%
Political lean MEDSL · DeSoto
- 2024 margin
- Strong R (+24.1) · D 36.7% · R 60.8% · Other 2.5%
- 2008→2024 swing
- +14.2pp toward D · 2008: -38.2pp · 2024: -24.1pp
- All cycles
- 2024: R+24.1 2020: R+23.9 2016: R+34.8 2012: R+33.5 2008: R+38.2
Not yet ingested
- Civics
- —
Market trends
- HPI YoY
- ▼ -82.49%
- Current HPI
- 176.8843
- Rent YoY
- ▼ -0.43%
- Metro
- Memphis, TN-MS-AR
- State GDP YoY
- —
- F500 in state
- 0
Price history
+48.1% since first listed9 events — show timeline
- 2026-06-10 Pending — MLSU
- 2026-06-02 Price Changed $199,999 MLSU
- 2026-05-18 Price Changed $249,950 MLSU
- 2026-04-27 Listed $292,500 MLSU
- 2022-01-11 Price Changed $2,055 RENT.
- 2020-06-22 Listing Removed — MLSU
- 2020-05-20 Listed $224,900 MLSU
- 2013-11-04 Listing Removed — MLSU
- 2012-11-15 Listed $135,000 MLSU
Property tax history
+15.6%/yrLatest (2025): $2,116 · +12.9% YoY. Source: county tax records.
Cash-flow waterfall
monthlySold comps — $/sqft
last 12 mo · ≤1 miLoading sold comps…