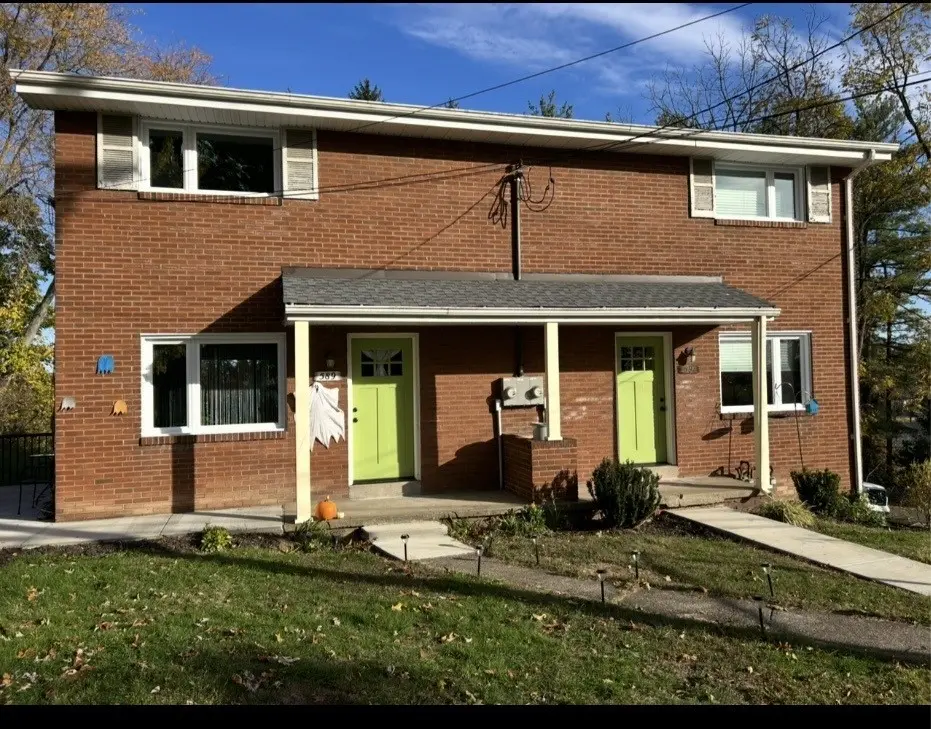
 Duplex
589-591 Cumberland Rd · Allison Park, PA
Flood risk 1/10 · Minimal
- FEMA flood zone
- X (unshaded)
- Chance of flooding over 30 yrs
- 0.0%
- Est. flood insurance / yr
- $473 – $860
Fire risk 1/10 · Minimal
- Est. fire insurance / yr
- $511 – $949
Heat risk 3/10 · Minor
- Hot days now (above 96°F)
- 7 days/yr
- Hot days in 30 yrs
- 17 days/yr
Wind risk 2/10 · Minimal
- Chance of severe wind over 30 yrs
- —
Air-quality risk 4/10 · Minor
- Unhealthy air days now
- 3 days/yr
- Unhealthy air days in 30 yrs
- 6 days/yr
Risk factors via First Street. Map © Google.
Why this score? — see what drove the C grade
The composite is a weighted blend of 9 inputs, each scored 0–100. Each bar is that input's sub-score; the figure is the points it added to the 100-point composite (weight × sub-score).
- Cash flow +21.2/30.0
- ARV discount +7.5/15.0
- DSCR +6.8/10.0
- Schools +6.6/10.0
- 1% rule +5.6/10.0
- Condition / age +3.8/5.0
- Livability +3.7/5.0
- Rent growth +3.0/5.0
- Appreciation +0.0/10.0
$379,000
🖨 Deal sheet 📄 Offer letter ✓ Due diligence
Multi-family units
County records classify this as Multi-Family (2-4 Unit). Listing-text estimate: 2 units. confirmed
Listing remarks
This well maintained brick duplex next to Mccandless Crossing is on an oversized lot with endless possibilities, this lot is large enough to build another home. The lot was recently cleared to show the true potential of use as a yard or building site. Each townhome has a living room / dining room , kitchen, 2 bedrooms, one bathroom, a laundry area , and a garage. This duplex recently had a new roof installed, new circuit breaker boxes, new insulated exterior doors, new Thermo-twin front windows, porch posts, and a large cement side patio on the left side. Most of the driveway was recently black toped. Inside it features hardwood floors throughout, recently repainted, and each side has stain
Key facts
- 0.43 acre lot
- Garage
- Built 1960
Property features AI
Finance
- Financial info: Unit rents: one unit at $1,000/month and one unit at $1,100/month
Exterior
- Parking: Built-in parking; Attached garage for 2 vehicles (total parking: 2)
- Utilities: Electricity available; Natural gas available; Public sewer available; Public water available
- Home design: Multi-family property with 2 total units
- Construction: Composition roof; Brick exterior
- Exterior features: Brick construction; R2 zoning
Interior
- Kitchen: Kitchens in each unit (appliance details not provided)
- Bedrooms: Two 2-bedroom units
- Bathrooms: Each unit has one full bathroom
- Interior features: Unfinished basement; Public transportation nearby
- Laundry & utility: No specific in-unit laundry details provided
Neighborhood map
What this means for you Summary
Snapshot
- This is a 2 × 2-bed/1.0-bath units multifamily listed at $379k. Condition is rated good.
Deal economics
- At list price, monthly cash flow is $551 ($7k/yr) — positive. Per door: $276/mo.
- The deal already cash-flows at list — no discount required.
- Meets the 1% rule at list price ($4k rent vs $379k).
- Cap rate 8.0% vs local median 3.0% in Allison Park — top-decile yield for the area; either an underpriced asset or a hidden risk that comps aren't pricing in. Stress-test before assuming the spread holds.
Location & tenants
- Location reads 74/100 on livability (#509 in PA, #4,653 nationally) — a middle-class / working-renter tenant base. Strengths: schools A+, crime A+, employment A+; Watch: health & safety D, amenities F, commute F.
- North Allegheny SD (suburban): math 64% / reading 82% proficiency, ranked #14 of 539 in PA (top 3%) — strong family-tenant draw, lease renewals of 3-5y typical; only 4% free/reduced lunch — higher-income household profile.
- Market conditions: Rents rising (+2.2%/yr); 104 active listings in the ZIP; 13 comparable units currently listed for rent nearby; rentals leasing fast (median 11d on market — plan ~1-2 weeks tenant-placement turnaround); solid renter incomes; 2,996 units permitted in Allegheny County in 2024 (1,588 in 5+ unit buildings).
- This rent runs 44% of the median local income ($110k/yr) — at the standard rent-burdened threshold; future hikes will face affordability resistance.
Forward outlook
- Local home prices are declining (-3.0%/yr); year-one equity from $3k of loan paydown is wiped out by about $11k of value loss. Plan a longer hold.
Negotiation context
- Only 3 days on market — expect competitive offers; lowballing is unlikely to land.
Questions for the listing agent
- Can we see the unit-by-unit rent roll, current vacancy, and any below-market leases? What's the average tenancy length?
- What capital expenditures (roof, boiler, parking lot, exteriors) have been made in the last 5 years, and what's planned in the next 2?
- Built in 1960 — when were the roof, HVAC, electrical panel, plumbing, and water heater last replaced?
- Is there a deadline driving the sale (1031 exchange, divorce, estate, relocation)? That informs how much negotiation room exists.
- Schools are A-rated — typically a magnet for longer-tenancy family renters. What's the average tenant stay here, and is there a school-zone premium baked into asking?
- What's the average days-on-market for RENTAL listings here right now (not sales)? A rising rental-DOM trend means longer vacancies and softer asking-rent achievability than the comps imply.
- What's the recent tenant-quality profile in this submarket — average credit score on applications, eviction rate, late-payment / NSF rate, and stable-employment percentage? A property-management company in the area should have these aggregated.
- How much new apartment / multifamily construction is in the pipeline within 1–3 miles? Heavy new supply (>2% of stock underway) typically softens rents 12–24 months out; light construction supports rent growth.
Investment metrics
- 1% rule
- 1.06% ✓
- Cap rate
- 8.04%
- Cash-on-cash
- 6.23%
- DSCR
- 1.28
- GRM
- 7.9
CMA / ARV
No comps found within radius.
Show comp detail 1 sale within ~0.75 mi
| Address | Dist | Beds/Ba | Sqft | Sold | Price | $/sf | Match |
|---|---|---|---|---|---|---|---|
| 589-591 Cumberland Rd | 0.00mi | 4/2.0 | — | 1mo | $415,000 | — | 87 |
Match score weights: distance 35% · size 25% · config 20% · recency 20%. Top-matched comps best support the ARV.
Projected returns pro-forma
-3.0% appreciation · 2.16% rent growth · sell at horizon
- IRR
- -7.6%
- Equity multiple
- 0.72×
- Total profit
- $-29,619
- Equity at exit
- $56,510
- IRR
- 0.8%
- Equity multiple
- 1.06×
- Total profit
- $6,079
- Equity at exit
- $32,769
Cash invested: $106,120 (down + closing). Projections, not guarantees.
Landlord ↔ Tenant lean methodology
- Overall (STATE)
- 62 Landlord-Friendly
- State Pennsylvania
- 62 Landlord-Friendly · EVEN
- County
- — inherits STATE
- City
- — inherits STATE
ZIP-level market 15237
- Rents YoY
- 2.2%
- Active inventory
- 104
- Price-to-rent
- 15.7×
Monthly cashflow live
- Estimated rent
- $4,013 high interval (Pro) →
- Mortgage (P&I)
- −$1,988
- Tax est. 1.5%
- −$474 /mo · $5,685/yr
- Insurance
- −$158
- HOA
- −$0
- Vacancy / Maint / Mgmt
- −$843
- Net cashflow
- $551
Break-even live
2-unit breakdown (identical units grouped — click to expand)
| Units | Beds | Baths | Est. rent |
|---|---|---|---|
| 2× units | 2 | 1 | $4,014 |
| #1 | 2 | 1 | $2,007 |
| #2 | 2 | 1 | $2,007 |
| Total (2 units) | $4,013 | ||
UW: 25.0% down · 7.5% · 30yr · 1.5% tax · 5.0% vac · 8.0% maint · 8.0% mgmt
Financing live
Cash to close
- Down payment
- $94,750
- Closing costs
- $11,370
- Reserves months
- —
- Total cash needed
- —
Loan-product check · same deal, 3 products live
Conventional
25% down · 7.5% · 30yr
- Down + closing
- —
- Monthly P&I
- —
- Monthly cashflow
- —
- DSCR
- —
- Eligible?
- —
Personal DTI + credit; lowest rate.
DSCR
20% down · 8.5% · 30yr
- Down + closing
- —
- Monthly P&I
- —
- Monthly cashflow
- —
- DSCR
- —
- Eligible?
- —
No personal income docs; deal must DSCR.
Hard money
10% down · 12.0% · 12mo
- Down + closing
- —
- Monthly P&I
- —
- Monthly cashflow
- —
- DSCR
- —
- Eligible?
- —
Short-term bridge; refi at stabilization.
Rent comps 13 comps
| Address | Beds | Baths | Sqft | Rent | $/sqft | DOM | Units | Dist |
|---|---|---|---|---|---|---|---|---|
| 159 Mohican Ave Pittsburgh, PA | 3.0 | 2.0 | 1360 | $2,100 | $1.54 | 43d | 1 | 0.70mi |
| 413 Walnut Ct Pittsburgh, PA | 3.0 | 3.5 | — | $3,500 | — | 10d | 1 | 0.79mi |
| 143 Aberdeen Ct Pittsburgh, PA | 3.0 | 3.5 | 1400 | $2,600 | $1.86 | 4d | 1 | 0.93mi |
| 9720 Hopkins St Unit NA Wexford, PA | 4.0 | 3.5 | 2271 | $3,099 | $1.36 | 2d | 1 | 0.95mi |
| 9720 Hopkins St Wexford, PA | 4.0 | 3.5 | 2271 | $3,099 | $1.36 | 3d | 1 | 0.95mi |
| 531 Cooper St Unit 1 Wexford, PA | 3.0 | 3.5 | 1760 | $3,100 | $1.76 | 4d | 1 | 0.98mi |
| 180 Montclair Ave Pittsburgh, PA | 3.0 | 1.0 | 1050 | $1,895 | $1.80 | 23d | 1 | 0.99mi |
| 524 Cooper St Wexford, PA | 3.0 | 3.5 | 1800 | $3,195 | $1.77 | 1d | 1 | 1.00mi |
| 520 Cooper St Wexford, PA | 3.0 | 3.5 | 1800 | $3,295 | $1.83 | 14d | 1 | 1.00mi |
| 415 Harmon Ct Wexford, PA | 4.0 | 3.5 | 2271 | $3,200 | $1.41 | 12d | 1 | 1.02mi |
| 8227 Vivian Dr Pittsburgh, PA | 3.0 | 2.0 | 1035 | $2,500 | $2.42 | 14d | 1 | 1.23mi |
| 9280 N Florence Rd Pittsburgh, PA | 3.0 | 1.5 | — | $2,100 | — | 10d | 1 | 1.29mi |
| 100 Arthur Dr Wexford, PA | 1.0–3.0 | 1.0–2.5 | 1250 | $2,185 | $1.75 | 1d | 1 | 1.30mi |
Listing history 2 events
-
2026-04-13status Pending
-
2026-04-06$379,000 Active
ⓘ Source: listings_history table (triggers on properties + properties_extension) + one-shot
backfill from property_details.listing_events for pre-trigger history.
Climate risk First Street
- Flood 1/10 Low FEMA zone X (unshaded) · 0% chance over 30 yrs
- Wildfire 1/10 Low
- Heat 3/10 Moderate 7 d/yr ≥96°F today · 17 d/yr by 30 yrs out
- Wind 2/10 Low
- Air quality 4/10 Moderate 3 unhealthy d/yr today · 6 by 30 yrs out
Nearby sold comps map
Loading sold comps map…
Walkable amenities ~0.75 mi
Loading nearby amenities…
Taxation est. · year 1
- Rental income
- $48,156
- − Mortgage interest
- −$21,230
- − Property taxes
- −$5,685
- − Insurance
- −$1,895
- − Repairs & maintenance
- −$3,852
- − Management
- −$3,852
- − Depreciation
- −$11,025
- Taxable income
- $616
- Est. tax owed @ 24.0%
- −$148
- After-tax cash flow
- $6,465/yr
For passive investors: Depreciation is non-cash, so a rental often shows a tax loss while cash-flowing — sheltering income. Rental losses are passive: they offset passive income freely, and up to $25,000/yr can offset ordinary (W-2) income if you actively participate and your MAGI is under $100k (phasing out to $0 by $150k); unused losses carry forward. On sale, claimed depreciation is recaptured at up to 25%, and gains may owe capital-gains tax (a 1031 exchange can defer both). Figures are a year-1 estimate at your 24.0% rate — not tax advice; consult a CPA.
Condition & rehab AI · 13 photos
This well-maintained brick duplex is in good condition with recent updates, including a new roof and exterior doors/windows. It offers a good investment opportunity with potential for further value enhancement through exterior painting and landscaping.
Value-add opportunities
- Both Paint exterior doors and windows — Enhances curb appeal and value for both resale and rental.
- Both Landscaping improvements — Enhances curb appeal and value for both resale and rental.
Renovation cost estimate screening
Value-add ROI direction
- Both Paint exterior doors and windows — Enhances curb appeal and value for both resale and rental. ↑
- Both Landscaping improvements — Enhances curb appeal and value for both resale and rental. ↑
ⓘ Cost ranges are severity-bucket heuristics (US national rule-of-thumb). Get contractor quotes + a written scope before underwriting a rehab budget.
Schools (NCES district)
- District
- North Allegheny SD
- NCES district ID
- 4217010
- Math proficiency
- 64% ▼ -7.00%
- Reading proficiency
- 82% ▼ -4.00%
- Median HH income
- $92,518
- Composite
- 65.85/100
- National rank
- #452
- State rank
- #14 of 539 in PA
Livability — Allison Park
- Score
- 74/100
- State rank
- #509
- US rank
- #4653
Category grades
Schools grade is shown separately in the Schools card above.
Census & demographics
- County
- Allegheny County · 1,022,028 people
- City population
- 26,036
- Metro
- Pittsburgh, PA
- Population (ZIP)
- 43,588
- Household income
- $109,895
- Rent vs Own
- Severe rent burden
- 693.0
Population outlook (Allegheny County) Hauer SSP2
- Today (2025)
- 1,250,282 people
- By 2030
- 1,256,482 · +0.5%
- By 2040
- 1,256,318 · +0.5%
- By 2050
- 1,244,169 · -0.5%
- By 2075
- 1,197,693 · -4.2%
- By 2100
- 1,093,187 · -12.6%
Race, ethnicity, and origin ACS 2023
- Neighborhood character
- Predominantly White (88%)
- Race & ethnicity
- White 88% Asian 6% Two or more races 3% Hispanic / Latino 3% Black 1%
- Common ancestry
- Romanian 8% Italian 2% Slovak 2%
- Foreign-born
- 8% · Canada, China
- Languages at home
- 90% English-only · Other Indo-European 2% Chinese 2% Spanish 2%
Political lean MEDSL · Allegheny
- 2024 margin
- Strong D (+20.3) · D 59.7% · R 39.4%
- 2008→2024 swing
- +4.8pp toward D · 2008: 15.5pp · 2024: 20.3pp
- All cycles
- 2024: D+20.3 2020: D+20.4 2016: D+16.4 2012: D+14.4 2008: D+15.5
Not yet ingested
- Civics
- —
Market trends
- HPI YoY
- ▼ -218.78%
- Current HPI
- 269.5446
- Rent YoY
- ▲ 2.16%
- Metro
- Pittsburgh, PA
- State GDP YoY
- ▲ 1.68%
- F500 in state
- 34
Industry mix (Fortune 500 HQ in PA)
| Industry | F500 HQs | Revenue |
|---|---|---|
| Healthcare | 2 | $309B |
|
||
| Insurance | 2 | $27B |
|
||
| Telecommunications / Media | 1 | $124B |
|
||
| Industrial Distribution | 1 | $22B |
|
||
| Financial Services | 1 | $20B |
|
||
| Chemicals / Materials | 1 | $18B |
|
||
Price history
2 events — show timeline
- 2026-04-13 Pending — West Penn MLS
- 2026-04-06 Listed $379,000 West Penn MLS
Cash-flow waterfall
monthlySold comps — $/sqft
last 12 mo · ≤1 miLoading sold comps…