22755 Friday Rd · Stover, MO
Flood risk 1/10 · Minimal
- FEMA flood zone
- X (unshaded)
- Chance of flooding over 30 yrs
- 0.0%
- Est. flood insurance / yr
- $507 – $1,088
Fire risk 5/10 · Moderate
- Est. fire insurance / yr
- $1,054 – $1,958
Heat risk 3/10 · Minor
- Hot days now (above 106°F)
- 7 days/yr
- Hot days in 30 yrs
- 18 days/yr
Wind risk 2/10 · Minimal
- Chance of severe wind over 30 yrs
- —
Air-quality risk 1/10 · Minimal
- Unhealthy air days now
- 0 days/yr
- Unhealthy air days in 30 yrs
- 0 days/yr
Risk factors via First Street. Map © Google.
Why this score? — see what drove the D- grade
The composite is a weighted blend of 9 inputs, each scored 0–100. Each bar is that input's sub-score; the figure is the points it added to the 100-point composite (weight × sub-score).
- ARV discount +15.0/15.0
- Appreciation +8.4/10.0
- Cash flow +4.7/30.0
- Schools +3.2/10.0
- Livability +3.0/5.0
- Rent growth +2.5/5.0
- Condition / age +2.5/5.0
- 1% rule +0.6/10.0
- DSCR +0.0/10.0
$165,000
🖨 Deal sheet (PDF) 📄 Offer letter ✓ Due diligence
Listing remarks
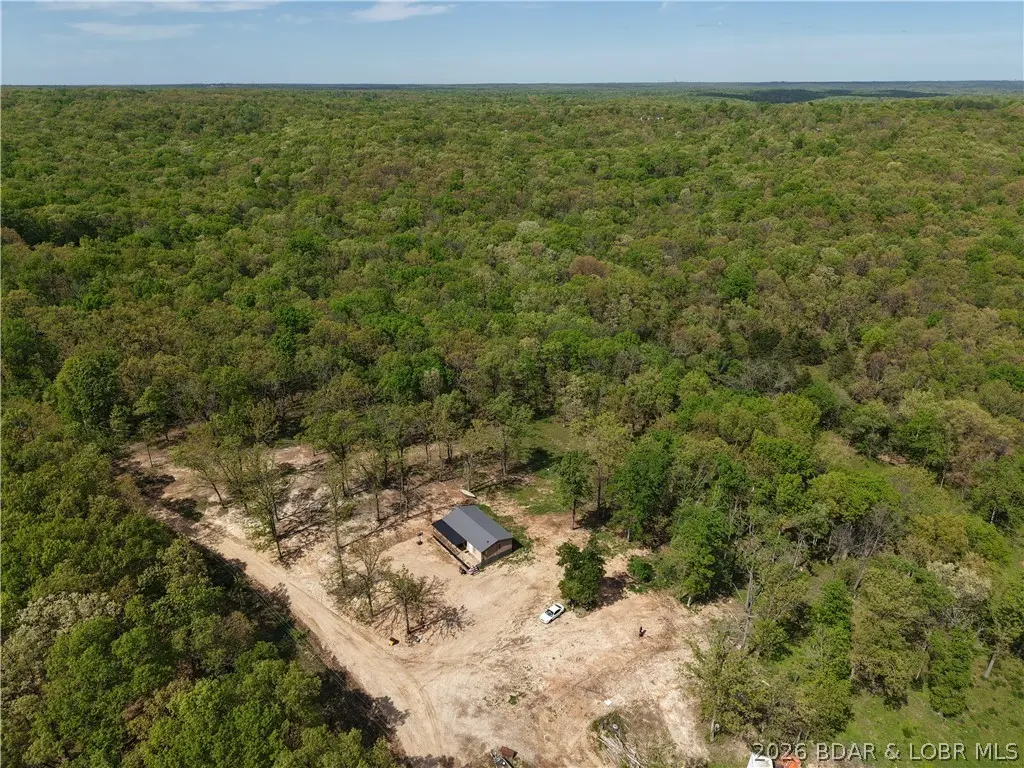
If you’ve been craving a slower pace and a place where life feels a little more grounded, this 21 acres is it. Unrestricted land gives you the freedom to live how you want—let the kids and dogs roam, run a few head of livestock, plant a garden, or spend your evenings out in the woods. It’s already fenced and set up for animals, and the hunting here is the kind that fills the freezer and keeps traditions alive. The home has a warm, simple feel with an open-concept living space that brings everyone together at the end of the day. One true bedroom plus two flex rooms give you space for kids, guests, or whatever your lifestyle calls for. The kitchen has had a thoughtful redo a
Key facts
- 21 acres
- Hunting
- Set up for animals
Tags
Property features AI
Exterior
- Parking: Gravel parking; No garage
- Utilities: Private well water
- Home design: Residential detached single-family home; Double wide mobile home body type; Possible uses include farm or residential
- Construction: Metal siding; Block foundation
- Exterior features: Deck; Cross-fenced property; Level, open and wooded lot; Gravel road access
Interior
- Kitchen: Cooktop; Range; Refrigerator
- Bathrooms: 1 full bathroom
- Heating & cooling: Wall furnace heating; Window unit cooling
- Interior features: Updated/remodeled interior; No fireplace
Neighborhood map
What this means for you Summary
Snapshot
- This is a 1-bed/1.0-bath other listed at $165k.
Deal economics
- At list price, monthly cash flow is $-413 ($-5k/yr) — negative.
- To cash-flow at today's rent, offer at most $105k (36.2% below list).
- To meet the 1% rule (rent ≥ 1% of price), the offer needs to be $92k (44.2% below list).
- Recommended offer: $92k (44.2% below list) — sets the bar for 1% rule.
Location & tenants
- Location reads 60/100 on livability (#473 in MO) — a middle-class / working-renter tenant base. Strengths: cost of living A+, housing A+, crime B+; Watch: schools D-, amenities F, commute F.
- Morgan County R-I (rural): math 38% / reading 41% proficiency, ranked #173 of 324 in MO (top 53%) — families likely to look elsewhere, expect single-tenant / working-renter base with shorter leases.
- Market conditions: 83 active listings in the ZIP; 14 units permitted in Morgan County in 2024 (0 in 5+ unit buildings).
Forward outlook
- In year one you build about $12k of equity ($1k loan paydown + $11k appreciation (6.9% local appreciation)).
- Morgan County population projected at -22% by 2050 — secular population decline; favor cash flow + early exit over multi-decade hold.
- By year 3, paydown + projected appreciation supports a ~$31k cash-out refi (75% LTV) — recoverable capital for the next deal without selling this one.
Negotiation context
- It's been on market 45 days — a 3% lower offer ($160k) is reasonable based on typical stale-listing flexibility.
Risks & watch-outs
- Climate carrying-cost: moderate wildfire risk — expect insurance premiums to compound above CPI over the hold.
Questions for the listing agent
- What do current leases actually rent for vs. the listed asking? Can we see a recent rent roll and the last 12 months of T-12 income?
- It's been on market 45 days. Have you received any prior offers? Is the seller open to a 44% concession, seller financing, or rate buy-down credit?
- Is there a deadline driving the sale (1031 exchange, divorce, estate, relocation)? That informs how much negotiation room exists.
- Schools are D-rated, which usually means shorter tenancies and higher turnover. Who's the typical renter profile here, and what's been the actual vacancy rate?
- The area grade is low — what's the realistic commute time and amenity access for the typical tenant pool here? Any planned neighborhood developments (good or bad) we should know about?
- What's the average days-on-market for RENTAL listings here right now (not sales)? A rising rental-DOM trend means longer vacancies and softer asking-rent achievability than the comps imply.
- What's the recent tenant-quality profile in this submarket — average credit score on applications, eviction rate, late-payment / NSF rate, and stable-employment percentage? A property-management company in the area should have these aggregated.
- How much new for-sale + rental construction is in the pipeline within 1–3 miles? Heavy new supply typically softens prices + rents 12–24 months out; constrained supply supports both.
Investment metrics
- 1% rule
- 0.56% ✗
- Cap rate
- 3.29%
- Cash-on-cash
- -10.72%
- DSCR
- 0.52
- GRM
- 14.9
CMA / ARV
- ARV (median comp)
- $204,223
- List price
- $165,000
- Delta
- -19.21%
- Verdict
- UNDERPRICED
- Comps
- 1 within 2.0 mi
Projected returns pro-forma
6.88% appreciation · 3.0% rent growth · sell at horizon
- IRR
- 9.1%
- Equity multiple
- 1.65×
- Total profit
- $30,106
- Equity at exit
- $113,017
- IRR
- 10.5%
- Equity multiple
- 3.32×
- Total profit
- $107,334
- Equity at exit
- $213,492
Cash invested: $46,200 (down + closing). Projections, not guarantees.
Landlord ↔ Tenant lean methodology
- Overall (STATE)
- 81 Strongly Landlord-Friendly
- State Missouri
- 81 Strongly Landlord-Friendly · R+10
- County
- — inherits STATE
- City
- — inherits STATE
ZIP-level market 65078
- Home prices YoY
- 4.4%
- Active inventory
- 83
- Price-to-rent
- 14.9×
Monthly cashflow live
- Estimated rent
- $921 medium interval (Pro) →
- Mortgage (P&I)
- −$865
- Tax est. 1.5%
- −$206 /mo · $2,475/yr
- Insurance
- −$69
- HOA
- −$0
- Vacancy / Maint / Mgmt
- −$193
- Net cashflow
- $-413
Break-even live
Sensitivity live
| Price | -10% $-299 | -5% $-356 | +0% $-413 | +5% $-470 | +10% $-527 |
|---|---|---|---|---|---|
| Rent | -10% $-485 | -5% $-449 | +0% $-413 | +5% $-376 | +10% $-340 |
| Rate | -1.0pp $-330 | -0.5pp $-371 | base $-413 | +0.5pp $-455 | +1.0pp $-499 |
UW: 25.0% down · 7.5% · 30yr · 1.5% tax · 5.0% vac · 8.0% maint · 8.0% mgmt
Financing live
Cash to close
- Down payment
- $41,250
- Closing costs
- $4,950
- Reserves months
- —
- Total cash needed
- —
Loan-product check · same deal, 3 products live
Conventional
25% down · 7.5% · 30yr
- Down + closing
- —
- Monthly P&I
- —
- Monthly cashflow
- —
- DSCR
- —
- Eligible?
- —
Personal DTI + credit; lowest rate.
DSCR
20% down · 8.5% · 30yr
- Down + closing
- —
- Monthly P&I
- —
- Monthly cashflow
- —
- DSCR
- —
- Eligible?
- —
No personal income docs; deal must DSCR.
Hard money
10% down · 12.0% · 12mo
- Down + closing
- —
- Monthly P&I
- —
- Monthly cashflow
- —
- DSCR
- —
- Eligible?
- —
Short-term bridge; refi at stabilization.
Listing history 16 events
-
2026-06-16status $165,000 Pending 45 DOM
-
2026-06-15days on market $165,000 Active Under Contract 45 DOM
-
2026-06-13days on market $165,000 Active Under Contract 43 DOM
-
2026-06-12statusdays on market $165,000 Active Under Contract 42 DOM
-
2026-06-09days on market $165,000 Active 39 DOM
-
2026-06-08days on market $165,000 Active 38 DOM
-
2026-06-07days on market $165,000 Active 37 DOM
-
2026-06-07days on market $165,000 Active 36 DOM
-
2026-06-04days on market $165,000 Active 33 DOM
-
2026-06-02days on market $165,000 Active 32 DOM
-
2026-06-01price $165,000 Active 31 DOM
-
2026-06-01days on market $168,000 Active 31 DOM
-
2026-05-31days on market $168,000 Active 30 DOM
-
2026-04-27$168,000 Active 1130-char remark
-
2025-11-22price $170,000
-
2025-10-12price $180,000
ⓘ Source: listings_history table (triggers on properties + properties_extension) + one-shot
backfill from property_details.listing_events for pre-trigger history.
Climate risk First Street
- Flood 1/10 Low FEMA zone X (unshaded) · 0% chance over 30 yrs
- Wildfire 5/10 Major
- Heat 3/10 Moderate 7 d/yr ≥106°F today · 18 d/yr by 30 yrs out
- Wind 2/10 Low
- Air quality 1/10 Low 0 unhealthy d/yr today · 0 by 30 yrs out
Nearby sold comps map
Loading sold comps map…
Walkable amenities ~0.75 mi
Loading nearby amenities…
Taxation est. · year 1
- Rental income
- $11,053
- − Mortgage interest
- −$9,243
- − Property taxes
- −$2,475
- − Insurance
- −$825
- − Repairs & maintenance
- −$884
- − Management
- −$884
- − Depreciation
- −$4,800
- Taxable loss
- −$8,058
- Est. tax savings @ 24.0%
- +$1,934
- After-tax cash flow
- $-3,018/yr
For passive investors: Depreciation is non-cash, so a rental often shows a tax loss while cash-flowing — sheltering income. Rental losses are passive: they offset passive income freely, and up to $25,000/yr can offset ordinary (W-2) income if you actively participate and your MAGI is under $100k (phasing out to $0 by $150k); unused losses carry forward. On sale, claimed depreciation is recaptured at up to 25%, and gains may owe capital-gains tax (a 1031 exchange can defer both). Figures are a year-1 estimate at your 24.0% rate — not tax advice; consult a CPA.
Schools (NCES district)
- District
- Morgan County R-I
- NCES district ID
- 2929610
- Math proficiency
- 38% ▬ 0.00%
- Reading proficiency
- 41% ▼ -1.00%
- Median HH income
- $33,188
- Composite
- 32.47/100
- National rank
- #5714
- State rank
- #173 of 324 in MO
Livability — Stover
- Score
- 60/100
- State rank
- #473
- US rank
- #18738
Category grades
Schools grade is shown separately in the Schools card above.
Census & demographics
- Population (ZIP)
- 3,716
Population outlook (Morgan County) Hauer SSP2
- Today (2025)
- 18,779 people
- By 2030
- 17,891 · -4.7%
- By 2040
- 16,227 · -13.6%
- By 2050
- 14,735 · -21.5%
- By 2075
- 11,433 · -39.1%
- By 2100
- 7,717 · -58.9%
Race, ethnicity, and origin ACS 2023
- Neighborhood character
- Predominantly White (86%)
- Race & ethnicity
- White 86% Two or more races 10% Hispanic / Latino 3%
- Common ancestry
- Lithuanian 3% Romanian 1% Iranian 1%
- Foreign-born
- 2% · Canada, Vietnam
- Languages at home
- 94% English-only · Spanish 3% German/W. Germanic 1% French/Haitian/Cajun 1%
Political lean MEDSL · Morgan
- 2024 margin
- Solid R (+59.7) · D 19.7% · R 79.4%
- 2008→2024 swing
- -39.1pp toward R · 2008: -20.6pp · 2024: -59.7pp
- All cycles
- 2024: R+59.7 2020: R+58.2 2016: R+56.6 2012: R+34.1 2008: R+20.6
Not yet ingested
- Civics
- —
Market trends
- HPI YoY
- ▲ 6.88%
- Current HPI
- 164.4454
- Rent YoY
- —
- Metro
- —
- State GDP YoY
- ▲ 1.84%
- F500 in state
- 20
Industry mix (Fortune 500 HQ in MO)
| Industry | F500 HQs | Revenue |
|---|---|---|
| Healthcare | 1 | $163B |
|
||
| Insurance | 1 | $21B |
|
||
| Industrial Technology | 1 | $17B |
|
||
| Retail | 1 | $16B |
|
||
| Industrial Distribution | 1 | $10B |
|
||
| Utilities | 1 | $9B |
|
||
Price history
-8.3% since first listed6 events — show timeline
- 2026-06-15 Pending — LOBR
- 2026-06-10 Contingent — LOBR
- 2026-06-01 Price Changed $165,000 LOBR
- 2026-04-27 Listed $168,000 LOBR
- 2025-11-22 Price Changed $170,000 LOBR
- 2025-10-12 Price Changed $180,000 LOBR
Property tax history
+1.9%/yrLatest (2025): $241 · +56.1% YoY. Source: county tax records.
Cash-flow waterfall
monthlySold comps — $/sqft
last 12 mo · ≤1 miLoading sold comps…