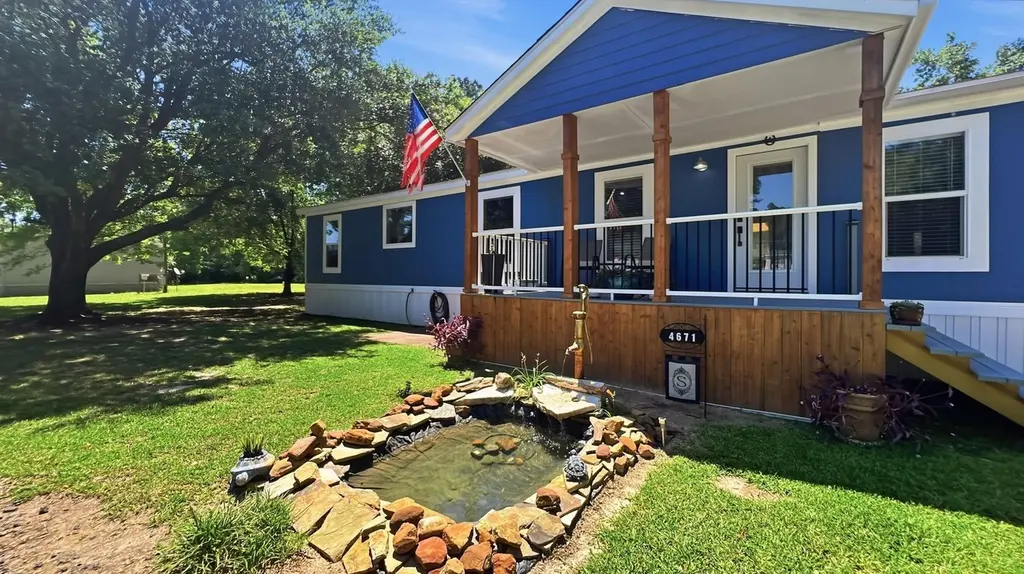
4671 Shakespeare Rd · Lumberton, TX
Flood risk 3/10 · Minor
- FEMA flood zone
- X (unshaded)
- Chance of flooding over 30 yrs
- 0.2%
- Est. flood insurance / yr
- $507 – $1,088
Fire risk 5/10 · Moderate
- Est. fire insurance / yr
- $1,222 – $2,270
Heat risk 9/10 · Severe
- Hot days now (above 112°F)
- 7 days/yr
- Hot days in 30 yrs
- 24 days/yr
Wind risk 9/10 · Severe
- Chance of severe wind over 30 yrs
- 99.0%
Air-quality risk 2/10 · Minimal
- Unhealthy air days now
- 1 days/yr
- Unhealthy air days in 30 yrs
- 1 days/yr
Risk factors via First Street. Map © Google.
Why this score? — see what drove the C- grade
The composite is a weighted blend of 9 inputs, each scored 0–100. Each bar is that input's sub-score; the figure is the points it added to the 100-point composite (weight × sub-score).
- Cash flow +20.4/30.0
- ARV discount +7.5/15.0
- DSCR +6.5/10.0
- 1% rule +4.6/10.0
- Livability +3.8/5.0
- Schools +3.0/10.0
- Rent growth +2.5/5.0
- Condition / age +2.5/5.0
- Appreciation +0.0/10.0
$195,000
🖨 Deal sheet (PDF) 📄 Offer letter ✓ Due diligence
Listing remarks
This completely renovated 3bedroom 2bathroom home is nestled on nearly an acre, and delivers the perfect blend of peaceful country living and modern comfort, all just minutes from town. Inside, you’ll find a thoughtfully designed split floor plan with an open-concept living, dining, and kitchen area filled with natural light and a warm, welcoming feel. The oversized primary suite is truly a retreat of its own, with plenty of space to unwind and an impressive walk-in closet. Every inch of this home has been updated, giving it a fresh, move-in-ready feel from top to bottom. Step outside and fall in love with the full-length covered back porch, the ultimate spot for entertaining guests,
Key facts
- Renovated home
- Walk-in closet
- Split floor plan
Tags
Property features AI
Exterior
- Parking: Carport with 2 spaces
- Utilities: Public water; Public sewer; Cable available
- Home design: Residential mobile home; Mobile home with land
- Construction: Composition roof
- Exterior features: Covered patio/porch; Chain link fencing; Storage structure on property
Interior
- Kitchen: Dishwasher; Microwave; Range
- Flooring: Carpet; Laminate
- Bathrooms: 2 full bathrooms
- Heating & cooling: Central heating (electric); Central air; Ceiling fan(s)
- Interior features: Dishwasher, Microwave, Range; Carpet and laminate flooring; Ceiling fans; Central air
Neighborhood map
What this means for you Summary
Snapshot
- This is a 3-bed/2.0-bath manufactured listed at $195k.
Deal economics
- At list price, monthly cash flow is $255 ($3k/yr) — positive.
- The deal already cash-flows at list — no discount required.
- To meet the 1% rule (rent ≥ 1% of price), the offer needs to be $188k (3.5% below list).
- Recommended offer: $188k (3.5% below list) — sets the bar for 1% rule.
- Cap rate 7.9% vs local median 3.2% in Lumberton — top-decile yield for the area; either an underpriced asset or a hidden risk that comps aren't pricing in. Stress-test before assuming the spread holds.
Location & tenants
- Location reads 75/100 on livability (#160 in TX, #4,326 nationally) — a middle-class / working-renter tenant base. Strengths: crime A+, employment A+, cost of living A+; Watch: amenities F, commute F.
- Kountze ISD (rural): math 35% / reading 35% proficiency, ranked #506 of 826 in TX (top 61%) — families likely to look elsewhere, expect single-tenant / working-renter base with shorter leases.
- Market conditions: 129 active listings in the ZIP; 3 comparable units currently listed for rent nearby; rentals leasing fast (median 14d on market — plan ~1-2 weeks tenant-placement turnaround); 358 units permitted in Hardin County in 2024 (0 in 5+ unit buildings).
Forward outlook
- Local home prices are declining (-3.0%/yr); year-one equity from $1k of loan paydown is wiped out by about $6k of value loss. Plan a longer hold.
Negotiation context
- Only 8 days on market — expect competitive offers; lowballing is unlikely to land.
Risks & watch-outs
- Climate carrying-cost: severe wind risk, 99% chance of damaging wind over 30y; moderate wildfire risk; extreme-heat days projected 7→24/yr by 2055 (HVAC capex compounding) — expect insurance premiums to compound above CPI over the hold.
Questions for the listing agent
- Is there a deadline driving the sale (1031 exchange, divorce, estate, relocation)? That informs how much negotiation room exists.
- What's the average days-on-market for RENTAL listings here right now (not sales)? A rising rental-DOM trend means longer vacancies and softer asking-rent achievability than the comps imply.
- What's the recent tenant-quality profile in this submarket — average credit score on applications, eviction rate, late-payment / NSF rate, and stable-employment percentage? A property-management company in the area should have these aggregated.
- How much new for-sale + rental construction is in the pipeline within 1–3 miles? Heavy new supply typically softens prices + rents 12–24 months out; constrained supply supports both.
Investment metrics
- 1% rule
- 0.96% ✗
- Cap rate
- 7.86%
- Cash-on-cash
- 5.60%
- DSCR
- 1.25
- GRM
- 8.6
CMA / ARV
No comps found within radius.
Projected returns pro-forma
-3.0% appreciation · 3.0% rent growth · sell at horizon
- IRR
- -7.7%
- Equity multiple
- 0.72×
- Total profit
- $-15,414
- Equity at exit
- $29,075
- IRR
- 1.9%
- Equity multiple
- 1.13×
- Total profit
- $7,298
- Equity at exit
- $16,860
Cash invested: $54,600 (down + closing). Projections, not guarantees.
Landlord ↔ Tenant lean methodology
- Overall (STATE)
- 87 Strongly Landlord-Friendly
- State Texas
- 87 Strongly Landlord-Friendly · R+5
- County
- — inherits STATE
- City
- — inherits STATE
ZIP-level market 77625
- Home prices YoY
- -22.0%
- Active inventory
- 129
- Price-to-rent
- 8.6×
Monthly cashflow live
- Estimated rent
- $1,881 medium interval (Pro) →
- Mortgage (P&I)
- −$1,023
- Tax from tax record
- −$128 /mo · $1,531/yr
- Insurance
- −$81
- HOA
- −$0
- Vacancy / Maint / Mgmt
- −$395
- Net cashflow
- $255
Break-even live
Sensitivity live
| Price | -10% $365 | -5% $310 | +0% $255 | +5% $200 | +10% $144 |
|---|---|---|---|---|---|
| Rent | -10% $106 | -5% $180 | +0% $255 | +5% $329 | +10% $403 |
| Rate | -1.0pp $353 | -0.5pp $304 | base $255 | +0.5pp $204 | +1.0pp $153 |
UW: 25.0% down · 7.5% · 30yr · 1.5% tax · 5.0% vac · 8.0% maint · 8.0% mgmt
Financing live
Cash to close
- Down payment
- $48,750
- Closing costs
- $5,850
- Reserves months
- —
- Total cash needed
- —
Loan-product check · same deal, 3 products live
Conventional
25% down · 7.5% · 30yr
- Down + closing
- —
- Monthly P&I
- —
- Monthly cashflow
- —
- DSCR
- —
- Eligible?
- —
Personal DTI + credit; lowest rate.
DSCR
20% down · 8.5% · 30yr
- Down + closing
- —
- Monthly P&I
- —
- Monthly cashflow
- —
- DSCR
- —
- Eligible?
- —
No personal income docs; deal must DSCR.
Hard money
10% down · 12.0% · 12mo
- Down + closing
- —
- Monthly P&I
- —
- Monthly cashflow
- —
- DSCR
- —
- Eligible?
- —
Short-term bridge; refi at stabilization.
Rent comps 3 comps
| Address | Beds | Baths | Sqft | Rent | $/sqft | DOM | Units | Dist |
|---|---|---|---|---|---|---|---|---|
| 30 Stephens Ln Lumberton, TX | 2.0 | 2.0 | 1290 | $1,650 | $1.28 | 44d | 1 | 0.85mi |
| 5525 Westchase Loop Lumberton, TX | 3.0 | 2.0 | 1384 | $2,100 | $1.52 | 13d | 1 | 0.92mi |
| 5670 Shadowbend Cir N Unit 104 Lumberton, TX | 3.0 | 2.5 | 1500 | $1,900 | $1.27 | 13d | 1 | 1.36mi |
Listing history 6 events
-
2026-05-30status $195,000 Pending 8 DOM
-
2026-05-21$195,000 Active
-
2025-03-11soldstatus
-
2024-11-15soldstatus
-
2024-11-15soldstatus
-
2018-12-12soldstatus
ⓘ Source: listings_history table (triggers on properties + properties_extension) + one-shot
backfill from property_details.listing_events for pre-trigger history.
Tax reassessment forecast TX · Resets to sale price
- Current annual tax
- $1,531 · $128/mo
- Projected year-2 tax
- $3,568 · $297/mo
- Expected delta
- +$2,038/yr (+$170/mo · 133.1%)
ⓘ Screening estimate from a state-policy table — verify with the county assessor before closing.
Climate risk First Street
- Flood 3/10 Moderate FEMA zone X (unshaded) · 20% chance over 30 yrs
- Wildfire 5/10 Major
- Heat 9/10 Extreme 7 d/yr ≥112°F today · 24 d/yr by 30 yrs out
- Wind 9/10 Extreme 99% chance of damaging wind over 30 yrs
- Air quality 2/10 Low 1 unhealthy d/yr today · 1 by 30 yrs out
Nearby sold comps map
Loading sold comps map…
Walkable amenities ~0.75 mi
Loading nearby amenities…
Taxation est. · year 1
- Rental income
- $22,575
- − Mortgage interest
- −$10,923
- − Property taxes
- −$1,531
- − Insurance
- −$975
- − Repairs & maintenance
- −$1,806
- − Management
- −$1,806
- − Depreciation
- −$5,673
- Taxable loss
- −$138
- Est. tax savings @ 24.0%
- +$33
- After-tax cash flow
- $3,091/yr
For passive investors: Depreciation is non-cash, so a rental often shows a tax loss while cash-flowing — sheltering income. Rental losses are passive: they offset passive income freely, and up to $25,000/yr can offset ordinary (W-2) income if you actively participate and your MAGI is under $100k (phasing out to $0 by $150k); unused losses carry forward. On sale, claimed depreciation is recaptured at up to 25%, and gains may owe capital-gains tax (a 1031 exchange can defer both). Figures are a year-1 estimate at your 24.0% rate — not tax advice; consult a CPA.
Schools (NCES district)
- District
- Kountze ISD
- NCES district ID
- 4825920
- Math proficiency
- 35% ▼ -11.00%
- Reading proficiency
- 35% ▼ -7.00%
- Median HH income
- $50,702
- Composite
- 30.42/100
- National rank
- #6244
- State rank
- #506 of 826 in TX
Livability — Lumberton
- Score
- 75/100
- State rank
- #160
- US rank
- #4326
Category grades
Schools grade is shown separately in the Schools card above.
Census & demographics
- City population
- 22,258
- Population (ZIP)
- 9,384
Population outlook (Hardin County) Hauer SSP2
- Today (2025)
- 57,780 people
- By 2030
- 58,296 · +0.9%
- By 2040
- 58,421 · +1.1%
- By 2050
- 57,391 · -0.7%
- By 2075
- 53,132 · -8.0%
- By 2100
- 44,905 · -22.3%
Race, ethnicity, and origin ACS 2023
- Neighborhood character
- Predominantly White (81%)
- Race & ethnicity
- White 81% Two or more races 8% Hispanic / Latino 8% Black 6%
- Hispanic origin (detail)
- Mexican 6%
- Common ancestry
- Lithuanian 8% Italian 3% Slovak 2%
- Foreign-born
- 2% · Canada
- Languages at home
- 91% English-only · Spanish 8% French/Haitian/Cajun 1%
Political lean MEDSL · Hardin
- 2024 margin
- Solid R (+75.8) · D 11.9% · R 87.7%
- 2008→2024 swing
- -14.6pp toward R · 2008: -61.2pp · 2024: -75.8pp
- All cycles
- 2024: R+75.8 2020: R+73.8 2016: R+73.9 2012: R+67.6 2008: R+61.2
Not yet ingested
- Civics
- —
Market trends
- HPI YoY
- ▼ -41.86%
- Current HPI
- 148.6087
- Rent YoY
- —
- Metro
- —
- State GDP YoY
- ▲ 3.95%
- F500 in state
- 110
Industry mix (Fortune 500 HQ in TX)
| Industry | F500 HQs | Revenue |
|---|---|---|
| Energy | 16 | $1,198B |
|
||
| Technology | 5 | $198B |
|
||
| Engineering / Construction | 4 | $72B |
|
||
| Energy Services | 3 | $60B |
|
||
| Utilities | 3 | $41B |
|
||
| Healthcare | 2 | $330B |
|
||
Price history
5 events — show timeline
- 2026-05-21 Listed $195,000 BBOR
- 2025-03-11 Sold (Public Records) — Public Records
- 2024-11-15 Sold (Public Records) — Public Records
- 2024-11-15 Sold (Public Records) — Public Records
- 2018-12-12 Sold (Public Records) — Public Records
Property tax history
-0.2%/yrLatest (2025): $1,531 · -14.8% YoY. Source: county tax records.
Cash-flow waterfall
monthlySold comps — $/sqft
last 12 mo · ≤1 miLoading sold comps…